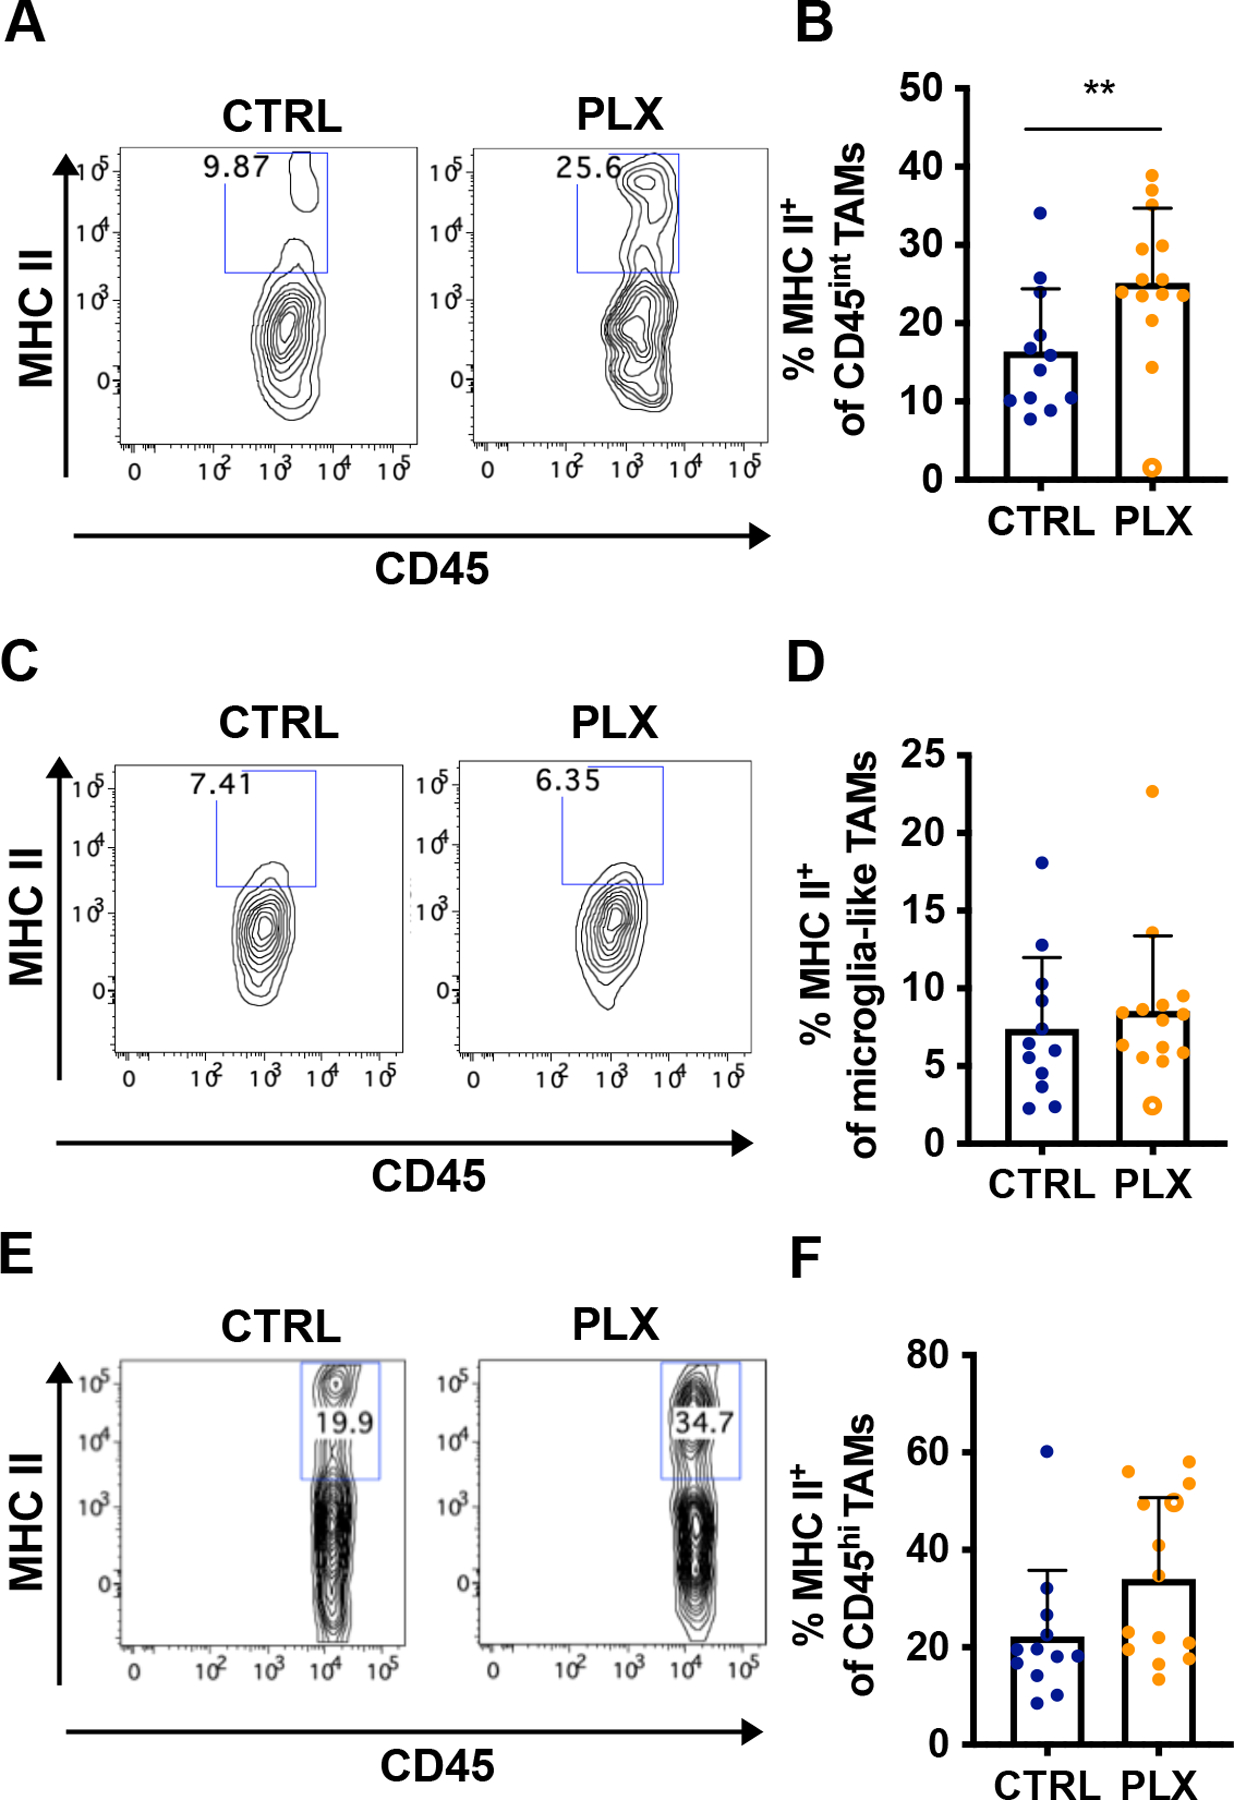
Figure 7. Depletion of TAMs in Atoh1-SmoM2 mice leads to a pro-inflammatory tumor microenvironment.

(A–F) Analysis of MHC II expression in 12 CTRL tumors and 14 PLX tumors (see Fig. 5). The open circle indicates an outlier PLX tumor. Representative flow cytometry panels from the CD45int TAMs population (A) showing the proportion of MHC II+ CD45int TAMs (B). Representative flow cytometry panels from the microglia-like TAMs population (C) showing the proportion of MHC II+ microglia-like TAMs (D). Representative flow cytometry panels from the CD45hi TAMs population (E) showing the proportion of MHC II+ CD45hi TAMs (F). Mean ± SD. Significance was performed excluding the outlier tumor by using unpaired t test. **p<0.01.
