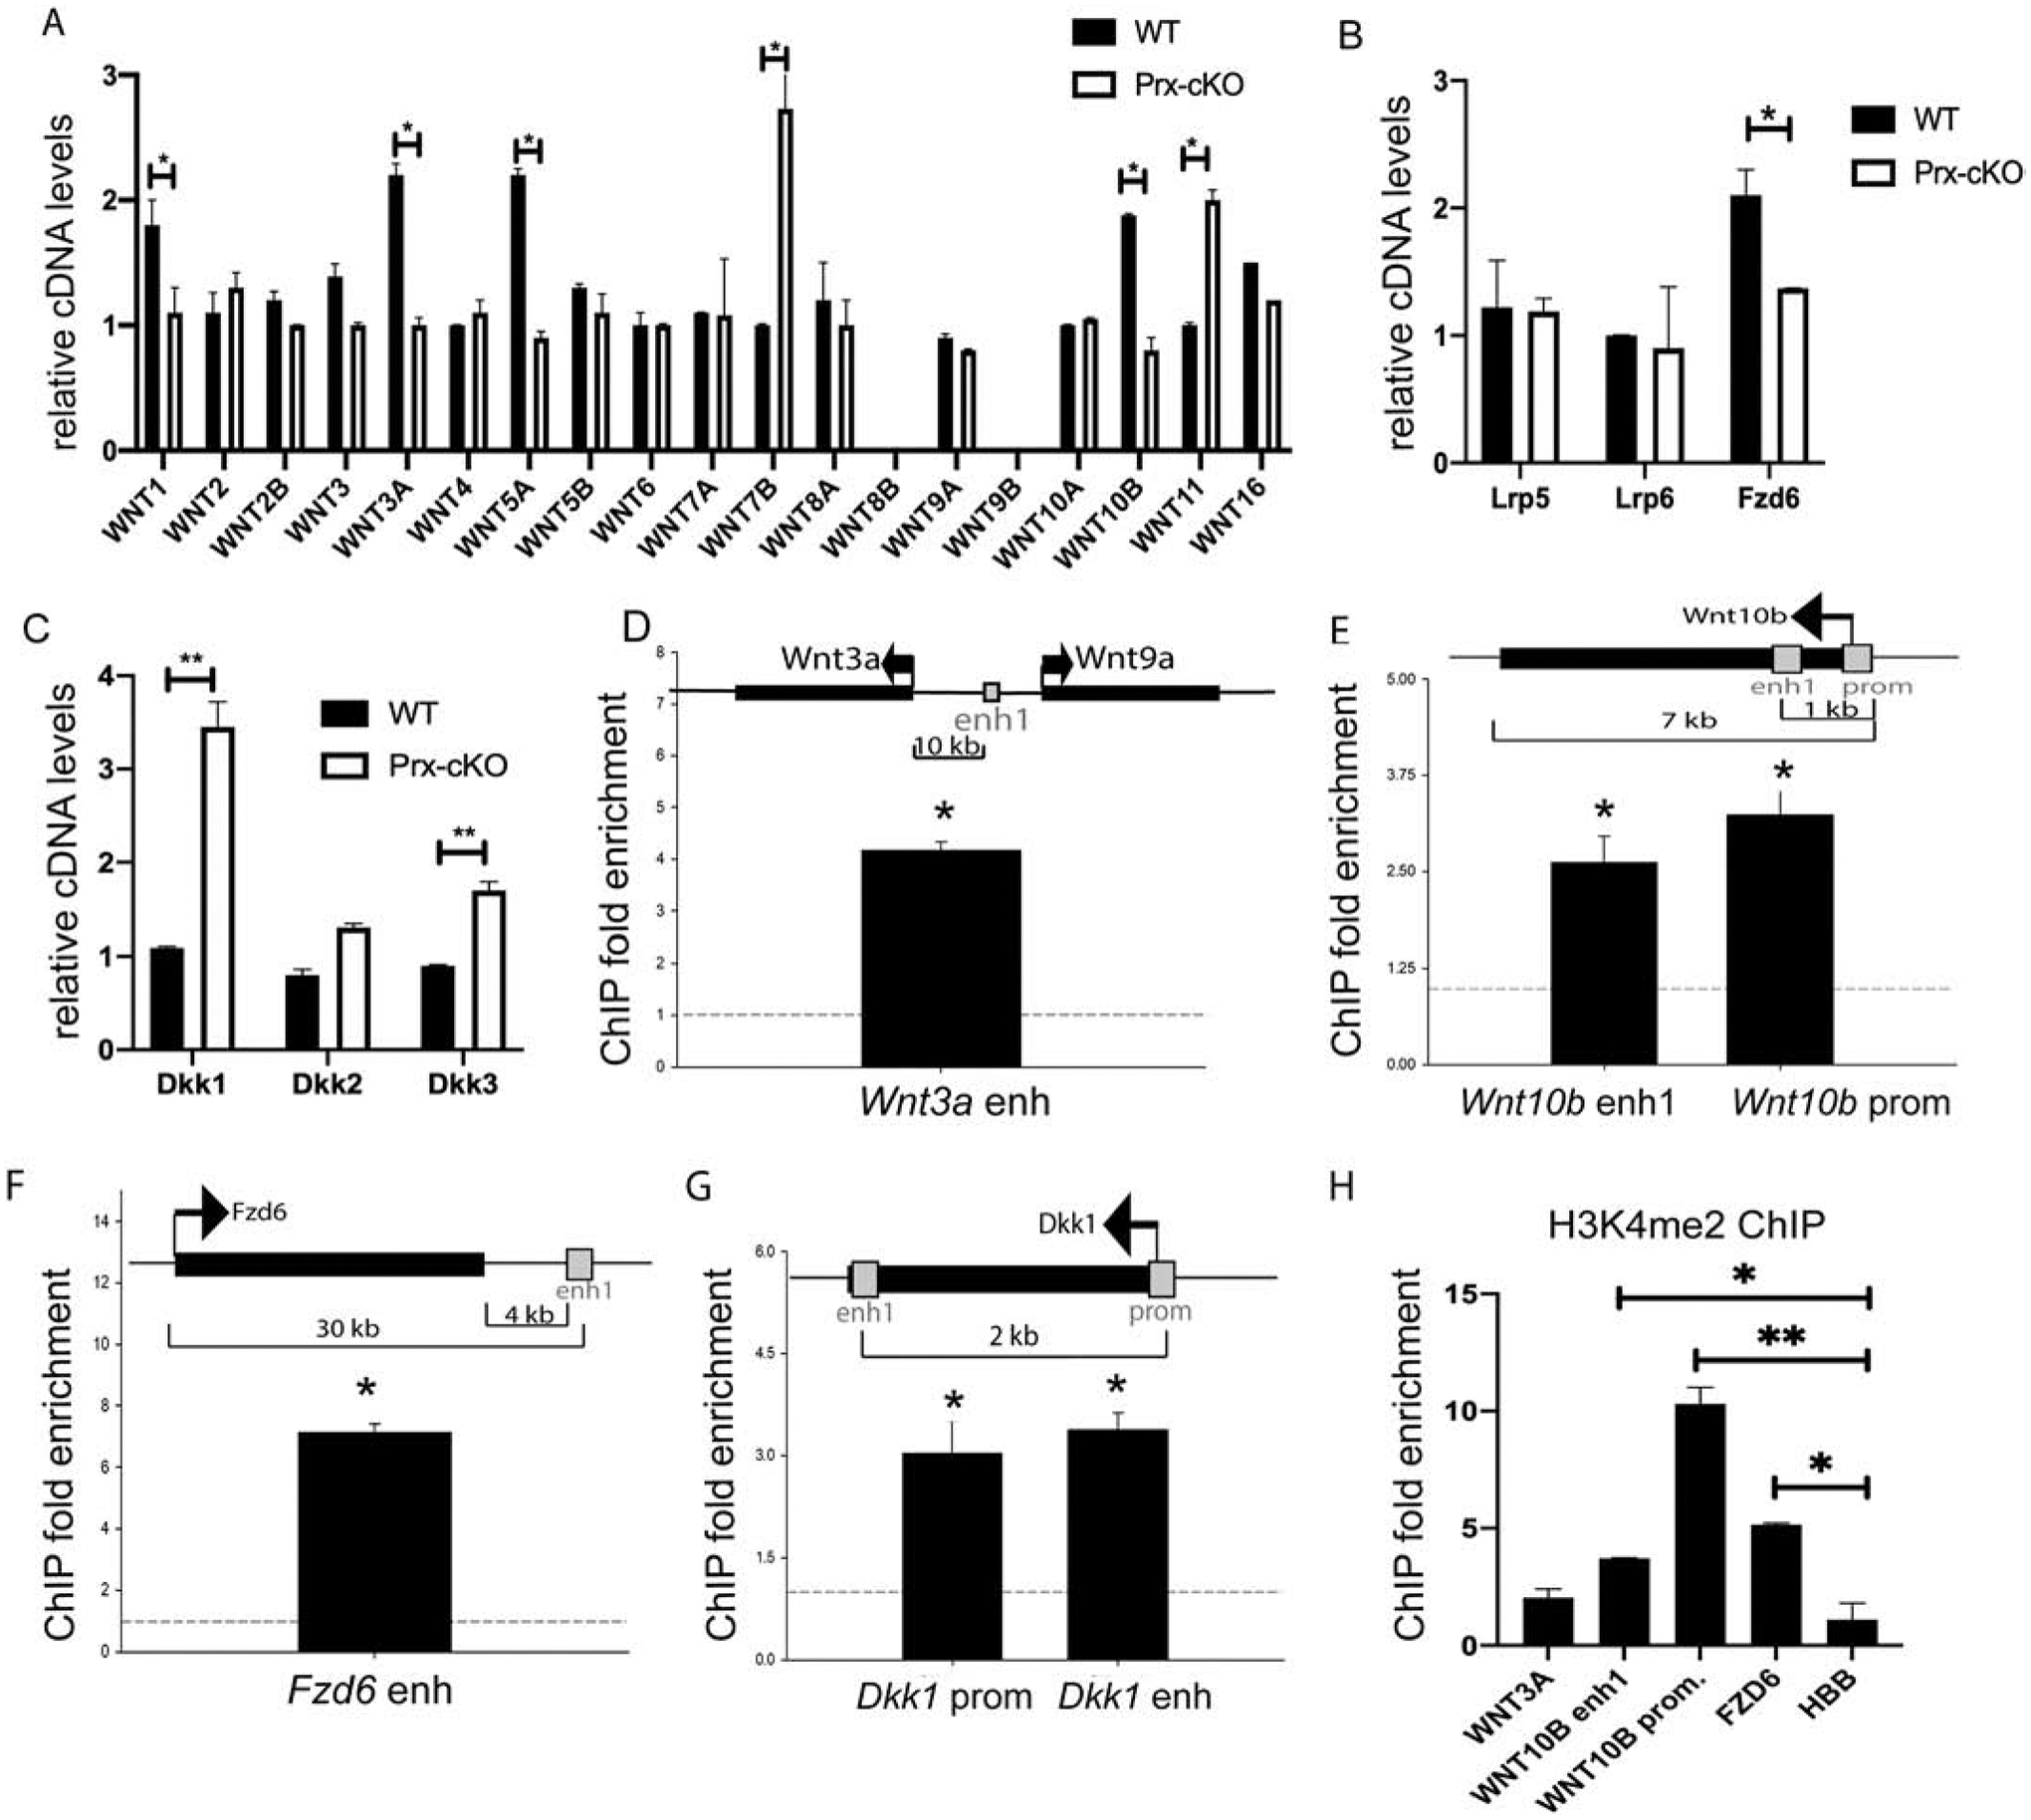
Figure 4: GATA4 directly regulates WNT signaling.

Bone marrow cells from WT and Gata4 Prx-cKO mice were cultured in MesenCult media. RNA was collected and qPCR was performed to the indicated (A) Wnt genes, (B) Wnt Co-receptors, and (C) Wnt signaling inhibitors. (D-G) Chromatin immunoprecipitation was performed at the indicated enhancers or promoters. Streptavidin-coated beads were used to precipitate Flag-biotin-GATA4. qPCR was performed with primers to the indicated regions (gray boxes). Each PCR was normalized to input and represented as fold enrichment over a negative genomic locus (dotted line). Insets show a schematic of the genomic region. Black bars indicate genes with arrows indicating the start and direction of transcription. Gray boxes indicate enhancer or promoter regions. (H) ChIP with antibodies to H3K4me2 was performed and qPCR was performed with primers to the indicated regions. Student’s t test; * P < 0.05; ** P < 0.01, *** P < 0.001 compared with wild-type (A-C) or negative genomic locus (D-H).
