

Abstract
Background:
Alcohol use disorder (AUD) is heterogenous. One approach to parsing this heterogeneity is to phenotype individuals by their underlying motivation to drink, specifically drinking for reward (i.e. positive reinforcement) or for relief (i.e. negative reinforcement/normalizing). Reward- vs. relief-motivated behavior is thought to be associated with a shift from ventral to dorsal striatal signaling. The present study examined whether reward and relief drinking were differentially associated with other clinical characteristics and with alcohol cue-elicited activation of the ventral and dorsal striatum.
Methods:
Non-treatment-seeking heavy drinkers (N=184; 61 female, 123 male) completed the UCLA Reward, Relief, Habit Drinking Scale (RRHDS) and the Reasons for Heavy Drinking Questionnaire (RHDQ), to categorize drinking motivation. Measures of alcohol use, alcohol problems, mood, and craving were also collected. A subset of participants (N=45; 17 female, 28 male) also completed a functional neuroimaging alcohol cue reactivity task.
Results:
RRHDS-designated relief/habit drinkers scored lower than reward drinkers on the RHDQ Reinforcement subscale (p=0.04) and higher on the RHDQ Normalizing subscale (p=0.004). Relief/habit drinkers also demonstrated greater AUD severity on a host of clinical measures. Relief/habit drinkers displayed higher cue-elicited dorsal striatal activation compared to reward drinkers (p=0.04), while ventral striatal cue-elicited activation did not significantly differ between groups.
Conclusions:
Our findings support and extend the differentiation of reward from relief/habit-motivated drinking and suggest that differences in dorsal striatal response to conditioned alcohol cues may underlie this distinction. Elucidating neurobiological and clinical differences between these subtypes may facilitate treatment matching and precision medicine for AUD.
Keywords: RRHDS, motivation, AUD, fMRI, RHDQ
Introduction
Alcohol use disorder (AUD) is a heterogenous disorder, subtypes of which present distinct characteristics and may require distinct treatment strategies. As such, there have been extensive efforts to parse this heterogeneity into typologies and other clinical phenotypes with the goal of matching each AUD subtype with the most effective treatment (Leggio et al., 2009). One of the latest developments in categorizing AUD subgroups has focused on the underlying motivation for drinking, namely drinking for reward (i.e., feeling good) or drinking for relief (i.e., alleviating unpleasant feelings). This approach may have clinical implications, as recent studies demonstrated that individuals whose drinking is driven by positive reinforcement (i.e., reward drinkers) benefit more from naltrexone, a medication known to blunt the rewarding effects of alcohol, than from other medications (Mann et al., 2018; Witkiewitz et al., 2019).
The contrast between reward- and relief-based alcohol use is generally consistent with the allostatic and incentive salience models of addiction, which propose a transition from positive to negative reinforcement (Koob and Schulkin, 2019), or from initial “liking” to later “craving” (Robinson and Berridge, 1993), respectively. This shift from positive to negative reinforcement may be accompanied by a transition from ventral striatal (VS) to dorsal striatal (DS) activation to alcohol cues. In a neuroimaging study, heavy drinkers showed higher DS activation to alcohol cues than lighter drinkers, whereas lighter drinkers showed higher VS activation (Vollstädt-Klein et al., 2010). The VS is implicated in reward-motivated decision-making, while the DS is thought to be involved in more compulsive or “habit-like” behavior (Burton et al., 2015). The notion that compulsive drug seeking may depend on the formation of long-lasting stimulus-response associations mediated by the DS is supported by animal research. It is thought that once drug use becomes compulsive, it is linked to cue-elicited DS dopamine release (Ito et al., 2002), and drug-seeking behavior can be limited by dopamine receptor blockade only in the DS, not in the VS (Vanderschuren et al., 2005). In human neuroimaging studies, alcohol cue-induced activation in the VS and DS has been shown in participants with AUD (Heinz et al., 2004; Schacht et al., 2011), and cue-reactivity throughout the striatum is associated with risk of relapse in abstinent subjects (Courtney et al., 2016; Grüsser et al., 2004).
Our group (Grodin et al., 2019) and others (Adams et al., 2016) have recently developed and validated brief scales with the goal of identifying reward and relief drinkers. Adams and colleagues (Adams et al., 2016) developed the Reasons for Heavy Drinking Questionnaire (RHDQ) and identified a two-factor solution, interpreting these two subscales as Reinforcement (i.e., positive reinforcement / reward) and Normalizing (i.e., negative reinforcement or restoration of allostatic balance / relief). While both subscales were associated with AUD severity, the normalizing subscale score was more strongly associated with severity than the reinforcement subscale score. Our group’s brief UCLA Reward, Relief, Habit Drinking Scale (RRHDS) (Grodin et al., 2019) categorizes subjects into reward, relief, or habit drinking subgroups. The RRHDS was shown to successfully differentiate reward drinkers from relief drinkers based on clinical characteristics including alcohol craving measures, withdrawal symptoms, and anxiety and depression symptomology. While habit drinking was also assessed, it was determined that habit and relief drinkers were not dissociable on clinical measures, suggesting that the two constructs may overlap phenotypically. Therefore, we proposed combining the relief and habit groups, supported by previous research in the domain which characterizes only reward and relief subtypes (Glöckner-Rist et al., 2013; Mann et al., 2018; Roos et al., 2017).
While these recent efforts are promising and may carry important clinical implications, much work remains to be done. One gap in the literature is understanding how the RHDQ and RRHDS self-report scales relate to one another. Admittedly, for clinical application, shorter scales are likely to have the most acceptability; however, clinical sensitivity should not be compromised. Another critical area is the biological validation of these phenotypes using neural markers, as reward and relief phenotypes are thought to be subserved by VS and DS neural circuitry, respectively. These systems are related, yet distinct and represent targets for precision pharmacotherapy. No studies to date have examined the association between self-report scales of reward and relief with measures of VS and DS activation to alcohol or other alcohol-related biomarkers.
With the overarching goal of identifying clinically meaningful drinking phenotypes, this study compares two scales of reward and relief drinking in a sample of non-treatment seeking heavy drinkers. We hypothesized that the two scales would largely align, such that participants categorized as reward drinkers on the RRHDS would have higher Reinforcement scores on the RHDQ, while relief/habit drinkers would have higher Normalizing scores. Furthermore, we examined the relationship between self-reported reward and relief drinking and neural activation to visual alcohol cues during a functional magnetic resonance imaging (fMRI) task in a subset of participants. Our analyses of neural activation are informed by the literature on reward and relief/habit drinking, which posits a dissociation between ventral and dorsal striatal activation in heavy drinkers (Vollstädt-Klein et al., 2010). As such, we hypothesized that reward drinkers would show higher cue-induced VS activation while relief/habit drinkers would show higher DS response to alcohol cues.
Materials and Methods
This study was performed as part of a two-week randomized controlled clinical trial (ClinicalTrials.gov NCT03489850) of ibudilast for drinking reduction. The trial was approved by the Institutional Review Board of the University of California, Los Angeles. All study participants provided written informed consent for screening, medication, and neuroimaging procedures. The current study used data from the initial in-person screening visit for all participants, and fMRI data from a subset of these individuals who completed the neuroimaging visit.
Participants
Participants included 184 non-treatment-seeking heavy drinkers [61 female, 123 male, mean±SD age 31.98±8.69], 45 of whom completed the fMRI neuroimaging paradigm [17 female, 28 male, mean±SD age 32.51±8.59] after being randomly assigned to take either ibudilast or placebo. Ibudilast was titrated as follows: 20 mg b.i.d. on days 1–2 and 50 mg b.i.d. on days 3–14. The neuroimaging session occurred after participants had been taking medication for seven days. Participants were recruited through social media and mass transit advertisements. Initial screening was conducted through telephone interviews. Eligible participants were invited for the in-person assessment visit. Data from all individuals who completed the full in-person screening visit and individual differences battery were included in the aim of comparing drinker subtypes on clinical measures.
Eligibility criteria for the fMRI scan included an age range between 21 and 50 years; meeting DSM-5 criteria for current AUD; and drinking more than 14 drinks per week for men (more than 7 for women) in the 30 days prior to screening. Exclusion criteria included currently receiving or seeking treatment for AUD; past year DSM-5 diagnosis of any other substance use disorder (excluding nicotine); lifetime diagnosis of schizophrenia, bipolar disorder, or any psychotic disorder; non-removable ferromagnetic objects in body; claustrophobia; serious head injury or prolonged period of unconsciousness (>30 minutes); medical conditions thought to interfere with safe participation (unstable cardiac, renal or liver disease, uncontrolled hypertension, diabetes, or elevated liver enzymes); and pregnancy, nursing, or refusal to use reliable birth control (women).
Assessments
Participants completed a battery of assessments at the in-person screening visit. These measures included the Structured Clinical Interview for DSM-5 (SCID) (First et al., 1995), Clinical Institute Withdrawal Assessment – Alcohol Revised (CIWA-Ar) (Sullivan et al., 1989), and the 30-day Timeline Followback interview (TLFB) (Sobell and Sobell, 1992) for alcohol, cigarette, and marijuana use. Participants completed assessments regarding alcohol use and related problems, including the Alcohol Dependency Scale (ADS) (Skinner and Allen, 1982) and Alcohol Use Disorders Identification Test (AUDIT) (Saunders et al., 1993); and measures of alcohol craving, including the Penn Alcohol Craving Scale (PACS) (Flannery et al., 1999) and the Obsessive Compulsive Drinking Scale (OCDS) (Anton, 2000). The three subscales of the OCDS (Resistance/Control Impairment (RCI), Obsession, and Interference) (Roberts et al., 1999) were analyzed separately. Participants completed the Fägerstrom Test for Nicotine Dependence (Heatherton et al., 1991), a measure of smoking severity. Measures of interest for the current study were the UCLA Reward, Relief, Habit Drinking Scale (RRHDS) (Grodin et al., 2019) and the Reasons for Heavy Drinking Questionnaire (RHDQ) (Adams et al., 2016), which assess motivations for drinking.
Derivation of Reward and Relief Groups
Reward and relief groups were derived by self-categorization on the RRHDS. Continuous scales (questions 2–4) ask subjects to rate on a 1–7 Likert scale how often they drank alcohol for its rewarding effects (e.g. to feel good, excited, or confident), relief effects (e.g. to feel less bad, sad, or nervous), or habit (e.g. without thinking about the effects), respectively. The highest rating on these Likert scales is used to categorize subjects into reward, relief, and habit groups. In the event of a participant rating more than one dimension equally highly, the first question, which asks participants to select their primary drinking motivation, is used as a tie-breaker (Grodin et al., 2019).
fMRI Data Acquisition
Neuroimaging took place at the UCLA Center for Cognitive Neuroscience (CCN) on a 3.0T Siemens Prisma Scanner (Siemens Medical Solutions USA, Inc., Malvern, PA). A T2‐weighted, high‐resolution matched‐bandwidth (MBW) anatomical scan (time to repetition (TR) = 5,000 ms, time to echo (TE) = 34 ms, flip angle = 90°, voxel size: 1.5 mm × 1.5 × 4 mm, field of view (FOV) = 192 mm2, 34 slices, ~1.5 minutes) and a T1‐weighted magnetization‐prepared rapid gradient‐echo (MPRAGE) sequence (TR = 2,530 ms, TE = 1.74 ms, time to inversion = 1,260 ms, flip angle = 7°, voxel size: 1 mm3, FOV = 256 mm2, ~6.2 minutes) were acquired for co‐registration to the functional data. A T2*‐weighted echo planar imaging (EPI) scan (TR = 2,200 ms, TE = 35ms, flip angle = 90°, FOV = 192 mm, slices = 36, 3.0 mm, ~12 minutes) was acquired to examine the blood oxygen-level dependent (BOLD) signal during the visual alcohol cue reactivity task.
Participants completed a 720s-long visual alcohol cue-reactivity task (Schacht et al., 2013), in which they were presented with 24 pseudo-randomly interspersed blocks of alcoholic beverage images (ALC), non-alcoholic beverage images (BEV), blurred images to serve as visual controls, and a fixation cross. Each block was composed of 5 individual pictures of the same type, each presented for 4.8 seconds, for a total of 24-seconds. Each block was followed by a 6-second washout period during which participants reported on the urge to drink. Alcoholic beverage blocks were distributed between images of beer, wine, and liquor (2 of each).
Data analysis
Preprocessing of neuroimaging data followed conventional procedures as implemented in FMRIB Software (FSL v6.0.1 http://www.fmrib.ox.ac.uk/fsl), including motion correction (Jenkinson et al., 2002), high-pass temporal filtering (100-second cut-off), and smoothing with a 5-mm full-width, half-maximum Gaussian kernel. Functional and structural data were skull-stripped to remove non-brain tissue. Each subject’s functional images were registered to their MBW, followed by their MPRAGE using affine linear transformations, and then were normalized to the Montreal Neurological Institute (MNI) 152-brain-average template through non-linear registration (Andersson et al., 2007).
All data analysis was conducted in R (RStudio 1.2.5001). Two-sample T-tests, Chi-Squared tests, and univariate analyses of variance (ANOVAs) were used to compare continuous and categorical behavioral variables across participants divided into two (i.e. reward vs. relief+habit drinkers) or three (i.e. reward vs. relief vs. habit drinkers) groups, respectively. T, X2, and F- statistics, along with corresponding p-values, are reported in Table 1 (entire sample) and Table 2 (fMRI subset).
Table 1.
Clinical characteristics of reward, relief, habit, and relief+habit groupings within the entire sample. 2-group comparison refers to reward group vs. relief+habit combined group; 3-group comparison refers to reward vs. relief vs. habit groups. ± indicates standard deviation.
| Measure (Cronbach’s α) | Total (n=184) | Reward (n=122) | Relief (n=28) | Habit (n=34) | Relief +Habit (n=62) | 2-group comparison | 3-group comparison |
|---|---|---|---|---|---|---|---|
| Sex F/M | 61/123 33/67% | 43/79 35/65% | 10/18 36/64% | 8/26 24/76% | 18/44 29/71% |
X2=0.46 p=0.496 |
X2=1.75 p=0.417 |
| Age | 31.98±8.69 | 32.34±9.16 | 32.11±8.53 | 30.59±6.98 | 31.27±7.70 |
t=0.835 p=0.405 |
F=0.544 p=0.581 |
| Smoker | 87 47% |
55 45% |
14 50% |
18 53% |
32 52% |
X2=0.47 p=0.495 |
X2=0.76 p=0.685 |
| THC+ | 55 30% |
33 27% |
7 25% |
15 44% |
22 35% |
X2=1.02 p=0.312 |
X2=4.07 p=0.131 |
| Total Drinking Days | 19.05±7.53 | 17.69±7.40 | 19.75±7.00 | 23.39±6.84 | 21.72±7.10 |
t=−3.559 p<0.001 |
F=8.175 p<0.001 |
| Drinks / Day | 3.57±2.98 | 3.25±2.75 | 3.48±2.33 | 4.84±3.92 | 4.22±3.33 |
t=−1.954 p=0.054 |
F=3.793 p=0.024 |
| Drinks/ Week | 25.06±20.91 | 22.77±19.27 | 24.42±16.31 | 33.89±27.45 | 29.55±23.33 |
t=−1.954 p=0.054 |
F=3.793 p=0.024 |
| Drinks/Drinking Day | 5.51±3.26 | 5.43±3.22 | 5.24±2.65 | 6.00±3.87 | 5.65±3.36 |
t=−0.420 p=0.675 |
F=0.508 p=0.603 |
| CIWA-Ar (α=0.484) | 0.98±2.18 | 0.95±2.07 | 0.89±1.89 | 1.15±2.79 | 1.03±2.41 |
t=−0.228 p=0.819 |
F=0.132 p=0.877 |
| AUDIT (α=0.822) | 15.62±7.27 | 14.52±6.89 | 17.86±5.61 | 17.71±8.95 | 17.77±7.57 |
t=−2.836 p=0.005 |
F=4.256 p=0.016 |
| OCDS (α=0.920) | 17.83±9.81 | 15.95±8.95 | 24.68±8.99 | 18.94±10.92 | 21.53±10.42 |
t=−3.597 p<0.001 |
F=10.22 p<0.001 |
| OCDS RCI Factor (α=0.786) | 10.83±4.78 | 10.00±4.67 | 13.643±3.73 | 11.50±5.05 | 12.468±4.59 |
t=−3.422 p<0.001 |
F=7.513 p<0.001 |
| OCDS Obsession Factor (α=0.893) | 5.33±3.85 | 4.72±3.53 | 8.07±3.83 | 5.26±4.09 | 6.53±4.19 |
t=−2.918 p=0.004 |
F=9.429 p<0.001 |
| OCDS Interference Factor (α=0.811) | 1.67±2.17 | 1.23±1.71 | 2.96±2.86 | 2.18±2.52 | 2.53±2.68 |
t=−3.478 p<0.001 |
F=9.136 p<0.001 |
| PACS (α=0.904) | 12.41±6.86 | 11.30±6.47 | 16.54±6.25 | 13.00±7.49 | 14.60±7.12 |
t=−3.064 p=0.003 |
F=7.723 p<0.001 |
| ADS (α=0.853) | 12.53±7.09 | 11.53±6.58 | 15.29±7.04 | 13.85±8.19 | 14.50±7.67 |
t=−2.599 p=0.011 |
F=4.049 p=0.019 |
Table 2.
Clinical characteristics of reward and relief+habit groupings within the subset of individuals who participated in neuroimaging. ± indicates standard deviation.
| Measure | fMRI Total (n=45) | fMRI Reward (n=27) | fMRI Relief+Habit (n=18) | 2-group comparison |
|---|---|---|---|---|
| Sex F/M | 17/28 38/62% |
10/17 37/63% |
7/11 39/61% |
X2<0.001 p=1 |
| Age | 32.5±8.59 | 32.48±8.81 | 32.56±8.51 |
t=−0.02 p=0.978 |
| Smoker | 24 53% |
15 56% |
9 50% |
X2=0.004 p=0.951 |
| THC+ | 13 29% |
6 22% |
7 39% |
X2=0.76 p=0.383 |
| Total Drinking Days | 20.53±6.58 | 17.78±5.73 | 24.67±5.63 |
t=−3.996 p<0.001 |
| Drinks / Day | 3.92±3.14 | 3.46±3.04 | 4.62±3.25 |
t=−1.201 p=0.238 |
| Drinks/ Week | 27.51±22.00 | 24.27±21.29 | 32.38±22.77 |
t=−1.201 p=0.238 |
| Drinks/Drinking Day | 5.65±3.37 | 5.73±3.56 | 5.52±3.14 |
t=0.205 p=0.839 |
| CIWA-Ar | 0.58±1.41 | 0.89±1.71 | 0.11±0.47 |
t=2.231 p=0.033 |
| AUDIT | 16.53±6.21 | 15.00±5.36 | 18.83±6.81 |
t=−2.008 p=0.053 |
| OCDS | 18.6±9.02 | 16.56±8.21 | 21.67±9.53 |
t=−1.861 p=0.072 |
| OCDS RCI Factor | 11.30±4.60 | 10.15±4.36 | 12.49±4.57 |
t=−2.049 p=0.048 |
| OCDS Obsession Factor | 5.69±3.65 | 5.15±3.60 | 6.50±3.67 |
t=−1.220 p=0.230 |
| OCDS Interference Factor | 1.64±1.79 | 1.26±1.53 | 2.22±2.02 |
t=−1.721 p=0.096 |
| PACS | 12.00±6.31 | 11.07±6.31 | 13.39±6.23 |
t=−1.215 p=0.232 |
| ADS | 12.20±6.56 | 11.81±7.22 | 12.78±5.58 |
t=−0.503 p=0.618 |
| IBUD | 20 44% |
11 40.7% |
9 50% |
X2=0.09 p=0.759 |
For the fMRI task, the mean percent signal change between alcohol and non-alcoholic beverage blocks of the task was extracted from a priori striatal regions of interest (ROIs). The first ROI, bilateral ventral striatum (VS), was defined anatomically as the nucleus accumbens from the Harvard-Oxford subcortical structure probability atlas, binarized at a 0.5 probability threshold (Kaag et al., 2019; Ray et al., 2014). The bilateral dorsal striatum (DS) ROI was defined anatomically as the caudate and putamen from the Harvard-Oxford atlas, also binarized at a 0.5 probability threshold. Overlap between the VS and DS regions were subtracted from the DS mask to distinguish between dorsal and ventral striatal areas (Kaag et al., 2019; Liu et al., 2017). Analyses of group differences in DS and VS cue-reactivity, as well as associations between cue-reactivity and behavioral measures, were conducted in R as general linear models. Since the relief group scored higher than the reward group on the ADS, a measure of AUD severity, all neuroimaging analyses controlled for ADS score (as well as medication assignment and interaction effects) in order to probe neural activation differences between groups over and beyond what could be explained by AUD severity or medication. As the current study was conducted within the framework of a medication trial, medication effects and interaction effects were tested within these models, and exploratory analyses of DS and VS cue-reactivity within the placebo and medication groups were conducted separately as well.
Results
In the initial sample of 184 subjects, 122 were categorized as reward drinkers, 28 as relief drinkers, and 34 as habit drinkers (i.e. 62 relief+habit drinkers). Mean RHDQ scores for the full sample were 7.48±1.72 for Reinforcement and 2.88±2.63 for Normalizing. Cronbach’s α was 0.507 for Reinforcement and 0.813 for Normalizing, which are consistent with previous studies using these reward and relief scales. Of the 45 participants who underwent the fMRI paradigm, 27 were categorized as reward drinkers and 18 as relief+habit drinkers. The proportion of participants randomized to ibudilast vs. placebo did not differ between the reward and relief+habit participants who completed the fMRI session.
RRHDS-defined relief/habit drinkers reported higher craving on the OCDS than reward drinkers [t=−3.60; p<0.0001]. The same pattern emerged for the PACS [t=−3.06; p=0.003], ADS [t=−2.60; p=0.011], and all subscales of the OCDS [Resistance/Control Impairment (RCI) t=−3.42; p<0.001; Obsession t=−2.918; p=0.004; Interference t=−3.478; p<0.001.]. The groups did not differ significantly on the CIWA-Ar measure of withdrawal. See Table 1 for complete results for clinical variables.
Among the 45 participants who completed the fMRI task, reward and relief/habit groups differed on the OCDS RCI subscale [t=−2.05; p=0.04]. Unlike the broader sample, the two groups did not differ significantly on the PACS, ADS, total OCDS score, or the other OCDS subscales. See Table 2 for complete results.
Comparison of Reward and Relief Drinking Assessments
RRHDS-defined reward and relief+habit groups differed significantly from each other on both the Reinforcement [t=2.06; p=0.04] and Normalizing [t=−2.94; p=0.004] subscales of the RHDQ (Figure 1a). When relief and habit drinkers were separated, the three groups differed significantly only on the Normalizing subscale [F = 4.49; p=0.01] (Figure 1b).
Figure 1.
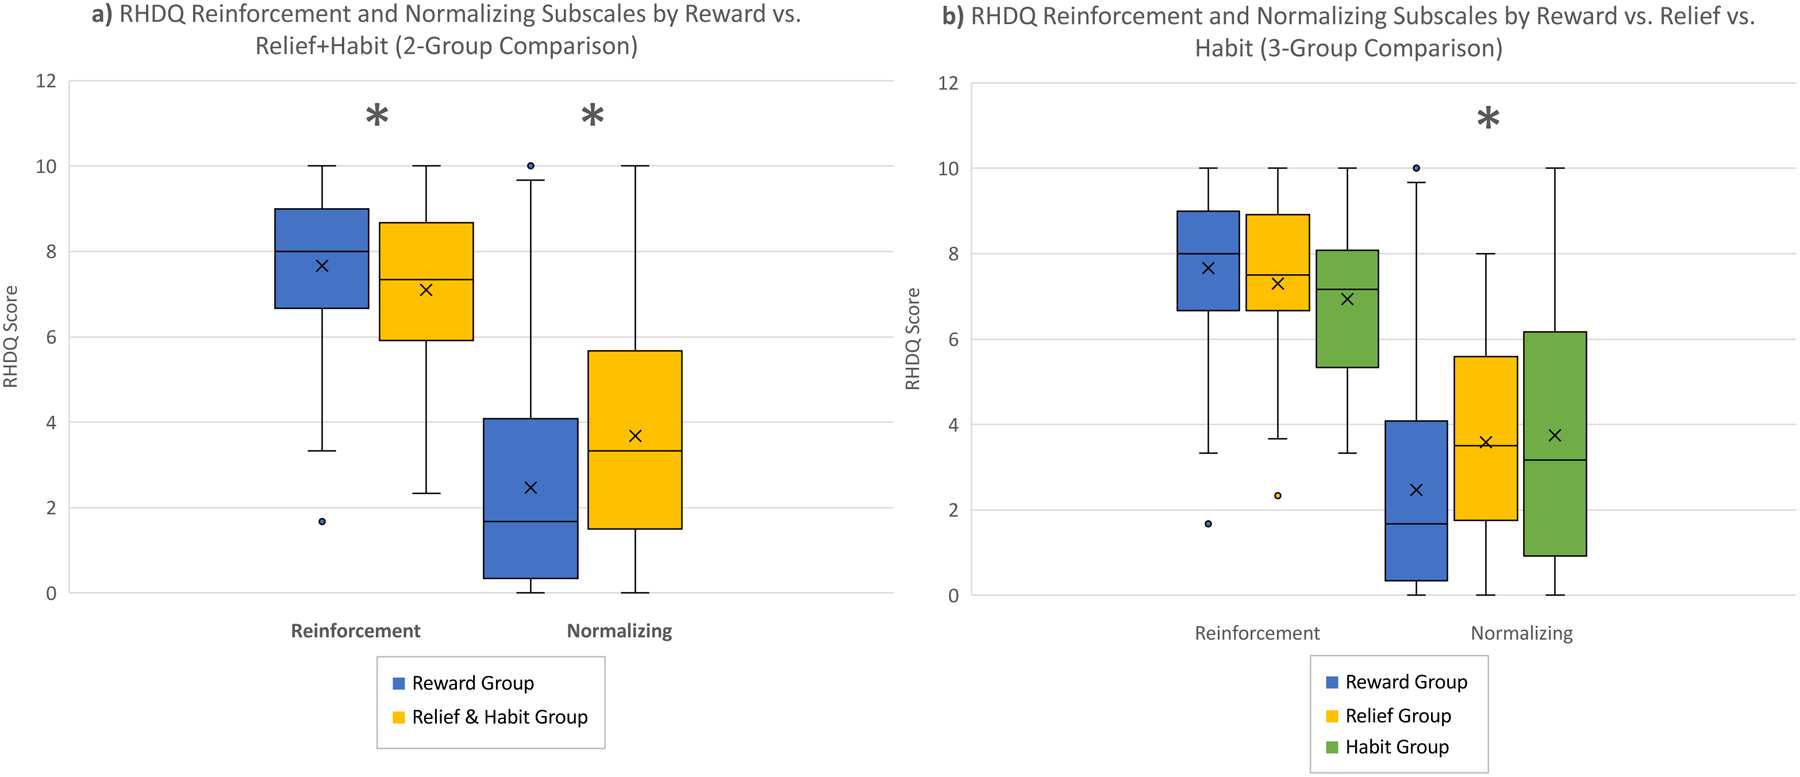
RHDQ Reinforcement and Normalizing scores by reward / relief drinkers. a) Two-group comparison between reward (blue) and relief+habit (yellow) drinking groups; b) Three-group comparison between reward (blue), relief (yellow), and habit (green) drinking groups.
Neuroimaging Results
Reward and relief+habit groups differed in activation within the DS only, such that the relief+habit group showed higher cue-elicited DS activation [reward mean = −0.0001±0.14; relief+habit mean = 0.09±0.13; p=0.04] (Figure 2a). As all fMRI participants were in a medication trial, medication and interaction effects were examined to evaluate if medication influenced this result. A main effect of medication was not seen (p>0.34), but a medication × group interaction effect was present (p<0.05). An exploratory analysis estimated the models separately within each medication group. This analysis indicated that the difference in DS cue-elicited activation was driven by the placebo group [placebo reward mean = −0.02±0.13; placebo relief+habit mean= 0.15±0.13; p=0.002] (Figure 2b), as there was no significant difference in the group receiving active medication [ibudilast reward mean = 0.03±0.16; ibudilast relief+habit mean= 0.04±0.12; p=0.45] (Figure 2c). No significant differences were found in VS activation between groups.
Figure 2.
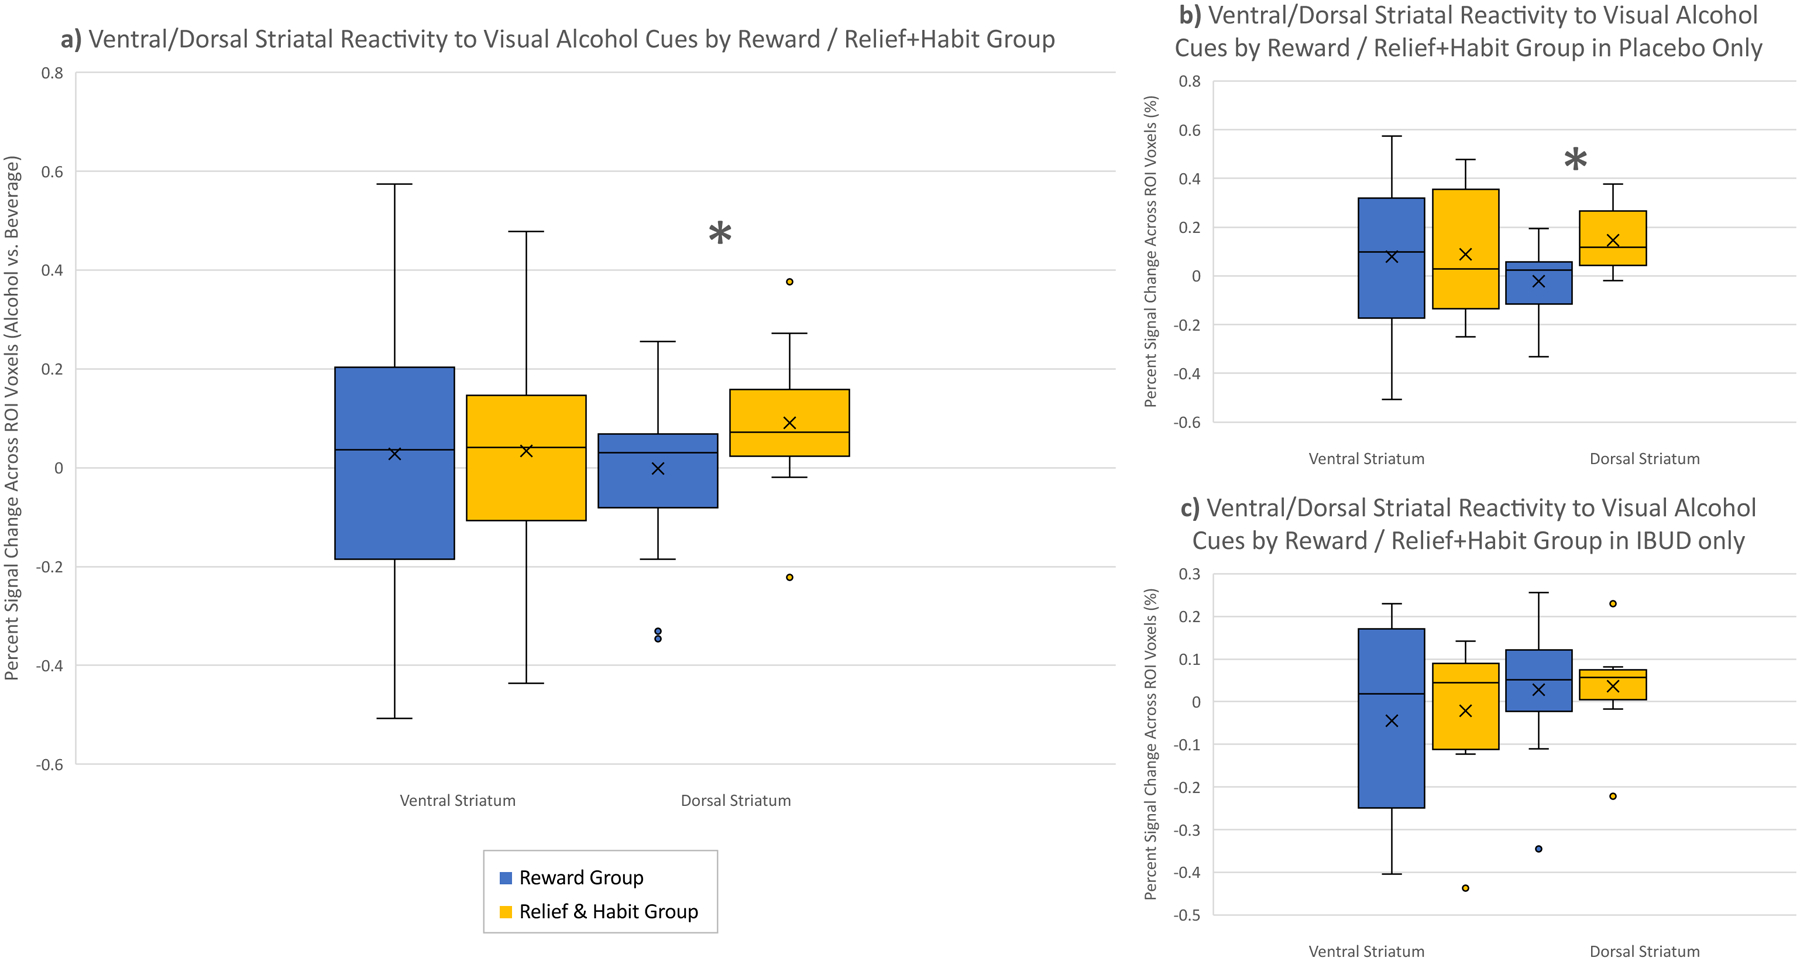
Dorsal and ventral striatal cue-reactivity in reward (blue) vs. relief+habit (yellow) drinkers. a) all fMRI participants; b) placebo group only; c) ibudilast group only.
Cue-elicited VS activation was significantly negatively correlated with a continuous measure of relief on the RRHDS (Question 3: “How often do you drink alcohol because it reduces negative feelings (e.g. makes you feel bad, sad, or nervous)?”, rated on a 1–7 Likert scale) [R2=0.32; p=0.03] (Figure 3). Due to responses on the continuous scale being moderately right-skewed (skewness=0.592), the continuous data was transformed on a log scale. As with the previous result, medication and interaction effects were examined to evaluate if medication influenced this result. Neither a main effect of medication (p>0.12) or a medication × group interaction effect (p>0.15) were present. The other two continuous RRHDS items (Questions 2 or 4) were not significantly correlated with VS or DS activation (p>0.09); nor were there any correlations between VS or DS cue-reactivity and RHDQ scores (p>0.41).
Figure 3.
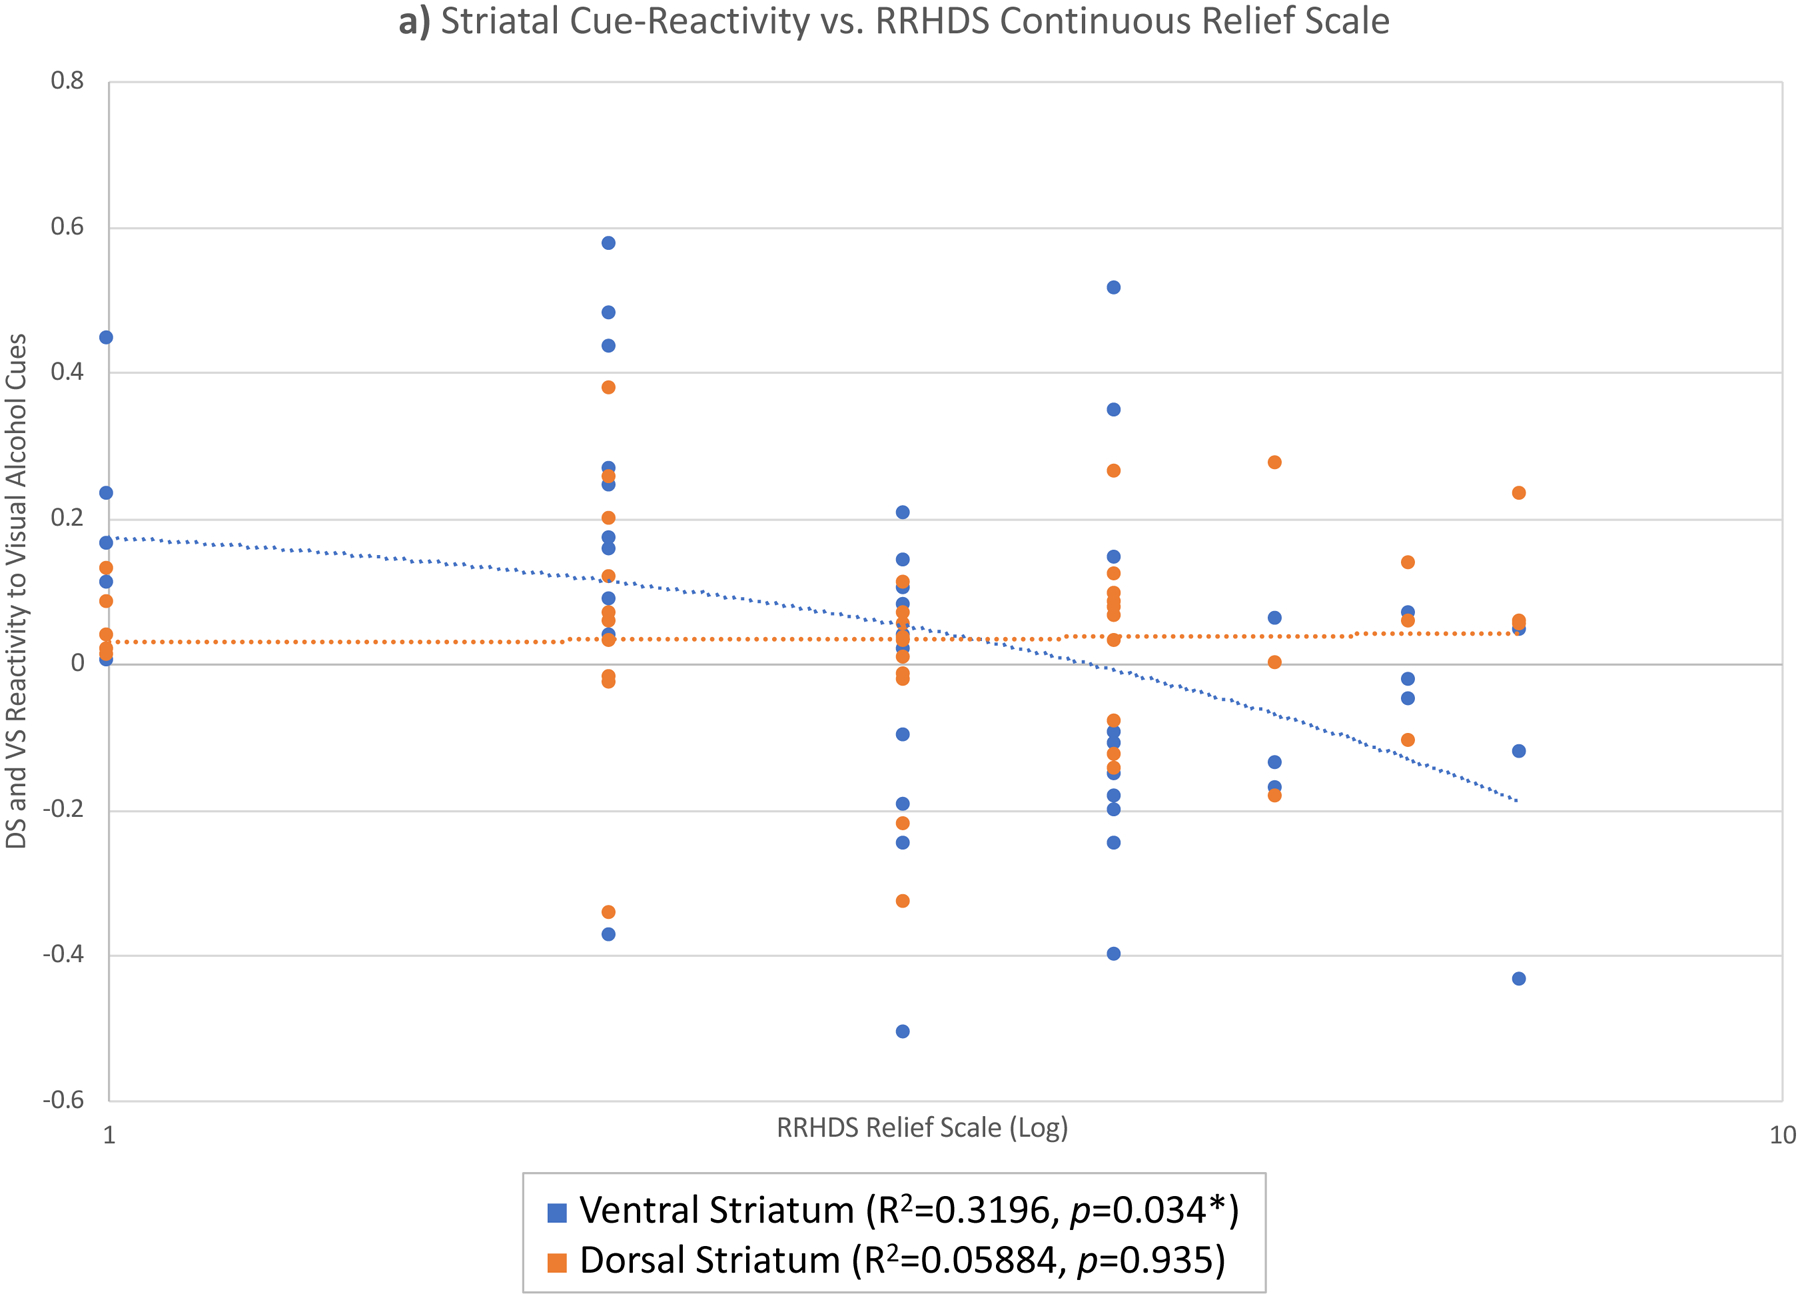
Ventral (blue) and dorsal (orange) striatal cue-reactivity vs. RRHDS continuous relief scale.
Discussion
This study sought to elucidate clinical and neural correlates of reward and relief drinking, captured through recently developed self-report instruments. Results replicated original findings regarding the score distributions and internal consistency of the RHDQ (Adams et al., 2016). Group differences between reward and relief/habit drinkers on alcohol measures including the PACS, ADS, and OCDS were also replicated in this independent sample (Grodin et al., 2019), such that relief/habit drinkers reported significantly higher scores than reward drinkers on these measures, with relief drinkers scoring highest when separated into three groups.
As hypothesized, characterizations based on the RRHDS and RHDQ largely aligned, such that RRHDS-designated reward drinkers scored significantly higher than relief/habit drinkers on the Reinforcement subscale of the RHDQ, whereas relief/habit drinkers scored significantly higher than reward drinkers on the Normalizing subscale. Further analysis separating relief from habit drinkers found that the three groups all significantly differed from each other only on the Normalizing subscale, suggesting that the difference seen in Reinforcement when the relief and habit groups were combined may be driven by habit drinkers’ lower reinforcement scores.
Neuroimaging results indicated that, as hypothesized, relief/habit drinkers showed greater DS activation to visual alcohol cues than reward drinkers. However, contrary to our hypotheses, cue-elicited VS activation did not differ significantly between groups. A possible interpretation of these results may be that among relief/habit drinkers, reward is not lost; rather, a dimension of drinking for relief is gained or amplified. This finding aligns with previous studies showing that positive, stimulatory response to alcohol, but not the negative, sedative response, predicts the development of escalated drinking and AUD (King et al., 2019, 2014, 2011). This hedonic response to alcohol, or “liking” as it is termed in the incentive salience model (Robinson and Berridge, 1993), is thought to be associated with reward, and serves as positive reinforcement under the allostatic model of addiction (Koob and Schulkin, 2019). The interpretation that reward is not lost while relief is amplified is also supported by a previous finding that alcohol-dependent participants did not show a blunted stimulation response compared to heavy-drinking controls, but did show a higher sedation response as alcohol administration began (Bujarski and Ray, 2014) – a result that is distinct from what would be hypothesized simply due to tolerance syndrome, in which all domains of subjective response are expected to be blunted (Morean and Corbin, 2008). It should be noted that while previous studies (Bujarski and Ray, 2014; Schacht et al., 2013) administered alcohol, the present study did not. Nevertheless, we reference those studies as they capture drinking responses and motives in “real-time” through controlled alcohol administration models.
This finding generally aligns with the allostatic and incentive salience models, but may suggest that the current participants are still somewhat early in the process of transitioning from positive reinforcement to negative reinforcement, or from liking to wanting/craving. This may be a result of the current sample being a relatively high-functioning, outpatient group that did not reach the most severe levels of AUD, with the vast majority of participants categorized as reward drinkers. Future studies should examine ventral and dorsal striatal cue-reactivity in participants with more severe AUD, whom might be farther along in the transition to negative reinforcement and as such, more likely to be categorized as relief drinkers. It is also important to note that while the RHDQ measure was developed in treatment-seeking samples (Adams et al., 2016), the current study is comprised of non-treatment seeking heavy drinkers. While the results of the current study largely replicated the findings seen in treatment seekers, the two populations differ, with treatment-seekers reporting a greater number of AUD symptoms, consuming more drinks per drinking day, and having higher ADS and OCDS scores than non-treatment-seeking participants (Ray et al., 2017). Thus, the findings identified in the current study, particularly with regards to neural activation, should be tested in treatment seekers, who are more likely to reach more severe levels of AUD. In the between-groups finding presented herein, exploratory follow-up analyses found that the observed effects were largely driven by the placebo group, which calls for further neuroimaging studies that do not involve a medication component.
Further neuroimaging results examining correlations between continuous measures of reward, relief, and habit and neural alcohol cue-reactivity found that cue-elicited VS activation was significantly negatively correlated with the continuous measure of relief. This finding was unexpected, as we would have hypothesized that there would be a positive relationship between relief and DS cue-reactivity rather than the observed negative correlation with VS cue-reactivity. Again, this may be a function of our outpatient sample not reaching the most severe levels of AUD. Changes in reward and relief scores may be best studied within-person and longitudinally.
The current study creates subtypes based on reward (reinforcement) and relief (normalizing); however, previous work focusing on precision medicine (Mann et al., 2018) differentiates high reward/low relief individuals from those who are high relief/low reward, high in both, or low in both. While the RRHDS was developed with the aim of characterizing participants’ primary motivations for drinking, the continuous 1–7 Likert scales (questions 2–4) can be dichotomized (i.e., “high” reward or relief = 4 or higher; “low” = 3 or lower). Using these designations, in the current sample of 184 participants, 83 (45%) were characterized as high reward/high relief, 86 (47%) as high reward/low relief, 7 (4%) as low reward/high relief, and 8 (4%) as low reward/low relief. As previously discussed, our high-functioning outpatient sample did not reach the most severe levels of AUD, so these categorizations are unsurprising. Additionally, few individuals were low on both reward and relief, despite higher prevalence in this category within treatment-seeking samples. It may be a limitation of the RRHDS measure that does not provide an opportunity for individuals to be low in both dimensions, as it emphasizes participants’ highest dimension. Future studies should examine these further subtypes in a sample with more severe AUD, which may yield more participants with low reward scores.
These results should be considered in light of the study’s strengths and limitations. Strengths include the integration of two novel measures of drinking motivation, as well as the combination of clinical phenotyping and neuroimaging (fMRI) methodologies. A notable limitation is that participants in the fMRI analysis were originally from a larger medication study and were scanned after one week on medication. Medication effects were not the focus of the present study and was controlled for in all analyses presented; however, exploratory analyses of interaction effects indicated that group differences in striatal cue-reactivity were driven by the placebo group. In light of this limitation, it is critical that these results be replicated in independent samples, including studies that do not have a medication component. An additional limitation was the moderate sample size within the neuroimaging group, which limited our ability to probe the neural differences in differences between reward and relief/habit drinkers (e.g., through whole-brain analyses). On balance, these results represent a first step towards characterizing the underlying neural correlates of neuroscience-informed drinking phenotypes in a clinical sample. The study is also limited by the reliability of assessments used, as the RRHDS has been shown to have strong test-retest reliability for reward drinkers, but to be less reliable for relief drinkers (Grodin et al., 2019) and the RHDQ had low reliability on the reinforcement subscale both in its original development (Adams et al., 2016) and in our sample. Additionally, the current sample is relatively young, with average age at least ten years younger than in comparable studies (Mann et al., 2018; Ooteman et al., 2006; Witkiewitz et al., 2019). While age did not distinguish between reward and relief within the current sample, in samples with a higher representation of older adults, age may differentiate these two groups. Specifically, relief drinkers may be older than reward drinkers, which is also associated with longer drinking history and potential for higher severity. Furthermore, the small neuroimaging sample size limited our ability to further probe additional factors such as sex differences. While the current sample did not show sex differences in reward/relief categorization, future studies may explore sex differences within a sample with a wider range of AUD severity, as men and women have been shown to drink for different reasons (Peltier et al., 2019) and sex differences have also been implicated in differential cue-reactivity signatures in smoking studies (Cosgrove et al., 2014). Finally, the disproportionate ratios of reward drinkers to relief and habit drinkers in both the fMRI sample and the larger behavioral sample necessitated the combining of relief and habit drinkers with regards to neuroimaging analyses. Nonetheless, the decision to combine these groups was informed both by previous research (Grodin et al., 2019; Mann et al., 2018; Roos et al., 2017) and by the lack of significant differences between groups on clinical measures within the fMRI sample.
In conclusion, this study reports on the neural and clinical characterization of heterogenous AUD subtypes based on motivations for drinking, as assessed by the RHDQ and the UCLA RRHDS. The overall agreement between these two measures suggests a consistent differentiation between reward-driven and relief-driven alcohol use, providing indirect support for the allostatic and incentive salience models of addiction (Koob and Schulkin, 2019; Robinson and Berridge, 1993). The present study also elucidates neural mechanisms (i.e. cue-elicited striatal cue-activation) underlying these AUD subgroups. The clinical and neural correlates of reward and relief/habit drinking found in this study may present a path towards the refinement of these neuroscience-informed phenotypes with the ultimate goal of informing personalized treatments for AUD.
Table 3.
Correlation matrix of all assessments conducted. Reported values are R2.
| 1 | 2 | 3 | 4 | 5 | 6 | 7 | 8 | 9 | |
|---|---|---|---|---|---|---|---|---|---|
| 1. RHDQ Reinforcing | - | ||||||||
| 2. RHDQ Normalizing | 0.119*** | - | |||||||
| 3. RRHDS Reward | 0.171*** | 0.003 | - | ||||||
| 4. RRHDS Relief | 0.142*** | 0.258*** | 0.003 | - | |||||
| 5. RRHDS Habit | 0.010 | 0.244*** | 0.002 | 0.063*** | - | ||||
| 6. CIWA-Ar | 0.015 | 0.234*** | 0.004 | 0.051** | 0.045** | - | |||
| 7. AUDIT | 0.095*** | 0.457*** | 0.004 | 0.176*** | 0.143*** | 0.190*** | - | ||
| 8. OCDS | 0.061*** | 0.418*** | 0.000 | 0.221*** | 0.167*** | 0.251*** | 0.554*** | - | |
| 9. PACS | 0.098*** | 0.402*** | 0.016 | 0.286*** | 0.179*** | 0.219*** | 0.464*** | 0.686*** | - |
| 10. ADS | 0.073*** | 0.313*** | 0.002 | 0.179*** | 0.117*** | 0.145*** | 0.608*** | 0.462*** | 0.410*** |
p<0.05,
p<0.01,
p<0.001.
Support:
This work was partially supported by P50DA005010-33. EMB is supported by F31AA028976. ENG is supported by F32AA027699. LAR is supported by NIAAA K24AA025704. Medication for the clinical trial to which this study is supplementary was supplied by MediciNova. JPS reports that, in the past two years, he has received grant funding from Laboratorio Farmaceutico CT. None of the authors have conflicts of interest to disclose.
References
- Adams ZW, Schacht JP, Randall P, Anton RF, 2016. The Reasons for Heavy Drinking Questionnaire: Factor Structure and Validity in Alcohol-Dependent Adults Involved in Clinical Trials. J Stud Alcohol Drugs 77, 354–361. 10.15288/jsad.2016.77.354 [DOI] [PMC free article] [PubMed] [Google Scholar]
- Andersson J, Jenkinson M, Smith S, 2007. Non-Linear Registration, aka Spatial Normalisation: FMRIB Technical Report. Oxford University, Oxford, England. [Google Scholar]
- Anton RF, 2000. Obsessive-compulsive aspects of craving: development of the obsessive compulsive drinking scale. Addiction 95, 211–217. [DOI] [PubMed] [Google Scholar]
- Bujarski S, Ray LA, 2014. Subjective Response to Alcohol and Associated Craving in Heavy Drinkers vs. Alcohol Dependents: An Examination of Koob’s Allostatic Model in Humans. Drug Alcohol Depend 140, 161–167. 10.1016/j.drugalcdep.2014.04.015 [DOI] [PMC free article] [PubMed] [Google Scholar]
- Burton AC, Nakamura K, Roesch MR, 2015. From ventral-medial to dorsal-lateral striatum: neural correlates of reward-guided decision-making. Neurobiol Learn Mem 117, 51–59. 10.1016/j.nlm.2014.05.003 [DOI] [PMC free article] [PubMed] [Google Scholar]
- Cosgrove KP, Wang S, Kim S-J, McGovern E, Nabulsi N, Gao H, Labaree D, Tagare HD, Sullivan JM, Morris ED, 2014. Sex differences in the brain’s dopamine signature of cigarette smoking. The Journal of Neuroscience: The Official Journal of the Society for Neuroscience 34, 16851–16855. 10.1523/JNEUROSCI.3661-14.2014 [DOI] [PMC free article] [PubMed] [Google Scholar]
- Courtney KE, Schacht JP, Hutchison K, Roche DJO, Ray LA, 2016. Neural substrates of cue reactivity: association with treatment outcomes and relapse. Addict Biol 21, 3–22. 10.1111/adb.12314 [DOI] [PMC free article] [PubMed] [Google Scholar]
- First MB, Spitzer RL, Gibbon M, Williams JBW, et al. , 1995. The Structured Clinical Interview for DSM-III-R Personality Disorders (SCID-II): II. Multi-site test-retest reliability study. Journal of Personality Disorders 9, 92–104. 10.1521/pedi.1995.9.2.92 [DOI] [Google Scholar]
- Flannery BA, Volpicelli JR, Pettinati HM, 1999. Psychometric properties of the Penn Alcohol Craving Scale. Alcohol. Clin. Exp. Res 23, 1289–1295. [PubMed] [Google Scholar]
- Glöckner-Rist A, Lémenager T, Mann K, PREDICT Study Research Group, 2013. Reward and relief craving tendencies in patients with alcohol use disorders: results from the PREDICT study. Addict Behav 38, 1532–1540. 10.1016/j.addbeh.2012.06.018 [DOI] [PubMed] [Google Scholar]
- Grodin EN, Bujarski S, Venegas A, Baskerville W-A, Nieto SJ, Jentsch JD, Ray LA, 2019. Reward, Relief and Habit Drinking: Initial Validation of a Brief Assessment Tool. Alcohol Alcohol. 54, 574–583. 10.1093/alcalc/agz075 [DOI] [PMC free article] [PubMed] [Google Scholar]
- Grüsser SM, Wrase J, Klein S, Hermann D, Smolka MN, Ruf M, Weber-Fahr W, Flor H, Mann K, Braus DF, Heinz A, 2004. Cue-induced activation of the striatum and medial prefrontal cortex is associated with subsequent relapse in abstinent alcoholics. Psychopharmacology (Berl.) 175, 296–302. 10.1007/s00213-004-1828-4 [DOI] [PubMed] [Google Scholar]
- Heatherton TF, Kozlowski LT, Frecker RC, Fagerstrom K-O, 1991. The Fagerström Test for Nicotine Dependence: a revision of the Fagerstrom Tolerance Questionnaire. British Journal of Addiction 86, 1119–1127. 10.1111/j.1360-0443.1991.tb01879.x [DOI] [PubMed] [Google Scholar]
- Heinz A, Siessmeier T, Wrase J, Hermann D, Klein S, Grüsser SM, Grüsser-Sinopoli SM, Flor H, Braus DF, Buchholz HG, Gründer G, Schreckenberger M, Smolka MN, Rösch F, Mann K, Bartenstein P, 2004. Correlation between dopamine D(2) receptors in the ventral striatum and central processing of alcohol cues and craving. Am J Psychiatry 161, 1783–1789. 10.1176/appi.ajp.161.10.1783 [DOI] [PubMed] [Google Scholar]
- Ito R, Dalley JW, Robbins TW, Everitt BJ, 2002. Dopamine release in the dorsal striatum during cocaine-seeking behavior under the control of a drug-associated cue. J. Neurosci 22, 6247–6253. https://doi.org/20026606 [DOI] [PMC free article] [PubMed] [Google Scholar]
- Jenkinson M, Bannister P, Brady M, Smith S, 2002. Improved optimization for the robust and accurate linear registration and motion correction of brain images. Neuroimage 17, 825–841. 10.1016/s1053-8119(02)91132-8 [DOI] [PubMed] [Google Scholar]
- Kaag AM, Wiers RW, de Vries TJ, Pattij T, Goudriaan AE, 2019. Striatal alcohol cue-reactivity is stronger in male than female problem drinkers. Eur. J. Neurosci 50, 2264–2273. 10.1111/ejn.13991 [DOI] [PMC free article] [PubMed] [Google Scholar]
- King AC, Cao D, deWit H, O’Connor SJ, Hasin DS, 2019. The role of alcohol response phenotypes in the risk for alcohol use disorder. BJPsych Open 5 10.1192/bjo.2019.18 [DOI] [PMC free article] [PubMed] [Google Scholar]
- King AC, de Wit H, McNamara PJ, Cao D, 2011. Rewarding, stimulant, and sedative alcohol responses and relationship to future binge drinking. Arch. Gen. Psychiatry 68, 389–399. 10.1001/archgenpsychiatry.2011.26 [DOI] [PMC free article] [PubMed] [Google Scholar]
- King AC, McNamara PJ, Hasin DS, Cao D, 2014. Alcohol challenge responses predict future alcohol use disorder symptoms: a 6-year prospective study. Biol. Psychiatry 75, 798–806. 10.1016/j.biopsych.2013.08.001 [DOI] [PMC free article] [PubMed] [Google Scholar]
- Koob GF, Schulkin J, 2019. Addiction and stress: An allostatic view. Neurosci Biobehav Rev 106, 245–262. 10.1016/j.neubiorev.2018.09.008 [DOI] [PubMed] [Google Scholar]
- Leggio L, Kenna GA, Fenton M, Bonenfant E, Swift RM, 2009. Typologies of alcohol dependence. From Jellinek to genetics and beyond. Neuropsychol Rev 19, 115–129. 10.1007/s11065-008-9080-z [DOI] [PubMed] [Google Scholar]
- Liu L, Yip SW, Zhang J-T, Wang L-J, Shen Z-J, Liu B, Ma S-S, Yao Y-W, Fang X-Y, 2017. Activation of the ventral and dorsal striatum during cue reactivity in Internet gaming disorder. Addict Biol 22, 791–801. 10.1111/adb.12338 [DOI] [PMC free article] [PubMed] [Google Scholar]
- Mann K, Roos CR, Hoffmann S, Nakovics H, Leménager T, Heinz A, Witkiewitz K, 2018. Precision Medicine in Alcohol Dependence: A Controlled Trial Testing Pharmacotherapy Response Among Reward and Relief Drinking Phenotypes. Neuropsychopharmacology 43, 891–899. 10.1038/npp.2017.282 [DOI] [PMC free article] [PubMed] [Google Scholar]
- Morean ME, Corbin WR, 2008. Subjective alcohol effects and drinking behavior: the relative influence of early response and acquired tolerance. Addict Behav 33, 1306–1313. 10.1016/j.addbeh.2008.06.007 [DOI] [PubMed] [Google Scholar]
- Ooteman W, Koeter M, Verheul R, Schippers G, Van den Brink W, 2006. Development and validation of the Amsterdam Motives for Drinking Scale (AMDS): an attempt to distinguish relief and reward drinkers. Alcohol Alcohol. 41, 284–292. 10.1093/alcalc/agl012 [DOI] [PubMed] [Google Scholar]
- Peltier MR, Verplaetse TL, Mineur YS, Petrakis IL, Cosgrove KP, Picciotto MR, McKee SA, 2019. Sex differences in stress-related alcohol use. Neurobiol Stress 10 10.1016/j.ynstr.2019.100149 [DOI] [PMC free article] [PubMed] [Google Scholar]
- Ray LA, Bujarski S, Yardley MM, Roche DJO, Hartwell EE, 2017. Differences between treatment-seeking and non-treatment-seeking participants in medication studies for alcoholism: do they matter? Am J Drug Alcohol Abuse 43, 703–710. 10.1080/00952990.2017.1312423 [DOI] [PMC free article] [PubMed] [Google Scholar]
- Ray LA, Courtney KE, Hutchison KE, Mackillop J, Galvan A, Ghahremani DG, 2014. Initial evidence that OPRM1 genotype moderates ventral and dorsal striatum functional connectivity during alcohol cues. Alcohol. Clin. Exp. Res 38, 78–89. 10.1111/acer.12136 [DOI] [PMC free article] [PubMed] [Google Scholar]
- Roberts JS, Anton RF, Latham PK, Moak DH, 1999. Factor structure and predictive validity of the Obsessive Compulsive Drinking Scale. Alcohol. Clin. Exp. Res 23, 1484–1491. [PubMed] [Google Scholar]
- Robinson TE, Berridge KC, 1993. The neural basis of drug craving: an incentive-sensitization theory of addiction. Brain Res. Brain Res. Rev 18, 247–291. 10.1016/0165-0173(93)90013-p [DOI] [PubMed] [Google Scholar]
- Roos CR, Mann K, Witkiewitz K, 2017. Reward and relief dimensions of temptation to drink: construct validity and role in predicting differential benefit from acamprosate and naltrexone. Addict Biol 22, 1528–1539. 10.1111/adb.12427 [DOI] [PMC free article] [PubMed] [Google Scholar]
- Saunders JB, Aasland OG, Babor TF, Fuente JRDL, Grant M, 1993. Development of the Alcohol Use Disorders Identification Test (AUDIT): WHO Collaborative Project on Early Detection of Persons with Harmful Alcohol Consumption-II. Addiction 88, 791–804. 10.1111/j.1360-0443.1993.tb02093.x [DOI] [PubMed] [Google Scholar]
- Schacht JP, Anton RF, Myrick H, 2013. Functional neuroimaging studies of alcohol cue reactivity: a quantitative meta-analysis and systematic review. Addiction Biology 18, 121–133. 10.1111/j.1369-1600.2012.00464.x [DOI] [PMC free article] [PubMed] [Google Scholar]
- Schacht JP, Anton RF, Randall PK, Li X, Henderson S, Myrick H, 2011. Stability of fMRI striatal response to alcohol cues: a hierarchical linear modeling approach. Neuroimage 56, 61–68. 10.1016/j.neuroimage.2011.02.004 [DOI] [PMC free article] [PubMed] [Google Scholar]
- Skinner HA, Allen BA, 1982. Alcohol dependence syndrome: measurement and validation. J Abnorm Psychol 91, 199–209. 10.1037//0021-843x.91.3.199 [DOI] [PubMed] [Google Scholar]
- Sobell LC, Sobell MB, 1992. Timeline Follow-Back, in: Litten RZ, Allen JP (Eds.), Measuring Alcohol Consumption: Psychosocial and Biochemical Methods. Humana Press, Totowa, NJ, pp. 41–72. 10.1007/978-1-4612-0357-5_3 [DOI] [Google Scholar]
- Sullivan JT, Sykora K, Schneiderman J, Naranjo CA, Sellers EM, 1989. Assessment of Alcohol Withdrawal: the revised clinical institute withdrawal assessment for alcohol scale (CIWA-Ar). British Journal of Addiction 84, 1353–1357. 10.1111/j.1360-0443.1989.tb00737.x [DOI] [PubMed] [Google Scholar]
- Vanderschuren LJMJ, Di Ciano P, Everitt BJ, 2005. Involvement of the dorsal striatum in cue-controlled cocaine seeking. J. Neurosci 25, 8665–8670. 10.1523/JNEUROSCI.0925-05.2005 [DOI] [PMC free article] [PubMed] [Google Scholar]
- Vollstädt-Klein S, Wichert S, Rabinstein J, Bühler M, Klein O, Ende G, Hermann D, Mann K, 2010. Initial, habitual and compulsive alcohol use is characterized by a shift of cue processing from ventral to dorsal striatum. Addiction 105, 1741–1749. 10.1111/j.1360-0443.2010.03022.x [DOI] [PubMed] [Google Scholar]
- Witkiewitz K, Roos CR, Mann K, Kranzler HR, 2019. Advancing Precision Medicine for Alcohol Use Disorder: Replication and Extension of Reward Drinking as a Predictor of Naltrexone Response. Alcohol. Clin. Exp. Res 43, 2395–2405. 10.1111/acer.14183 [DOI] [PMC free article] [PubMed] [Google Scholar]