Abstract
Spo11, which makes DNA double-strand breaks (DSBs) essential for meiotic recombination, has long been recalcitrant to biochemical study. We provide molecular analysis of S. cerevisiae Spo11 purified with partners Rec102, Rec104 and Ski8. Rec102 and Rec104 jointly resemble the B subunit of archaeal Topoisomerase VI, with Rec104 occupying a position similar to the Top6B GHKL-type ATPase domain. Unexpectedly, the Spo11 complex is monomeric (1:1:1:1 stoichiometry), consistent with dimerization controlling DSB formation. Reconstitution of DNA binding reveals topoisomerase-like preferences for duplex-duplex junctions and bent DNA. Spo11 also binds noncovalently but with high affinity to DNA ends mimicking cleavage products, suggesting a mechanism to cap DSB ends. Mutations that reduce DNA binding in vitro attenuate DSB formation, alter DSB processing, and reshape the DSB landscape in vivo. Our data reveal structural and functional similarities between the Spo11 core complex and Topo VI, but also highlight differences reflecting their distinct biological roles.
INTRODUCTION
Spo11 evolved from the DNA cleaving subunit of archaeal topoisomerase VI1,2, which is a tetramer of two A subunits (DNA cleaving) and two B subunits (GHKL-type ATPase)3,4. Concerted attack of the A subunits on opposite strands of a duplex using active-site tyrosines breaks the DNA and produces covalent 5’-phosphotyrosyl links5. Topo VI passes an intact duplex through the transient DSB to modulate DNA topology.
In contrast, Spo11 remains in the covalent complex6. Endonucleolytic cleavage of Spo11-bound strands then releases Spo11 with a short oligonucleotide still covalently attached (Spo11-oligo complexes)7. This frees DSB ends for further exonucleolytic resection followed by homology search and strand exchange8.
Spo11 requires a cohort of partners6 that are conserved functionally9–14 despite having highly diverged sequences15. One critical partner (Top6BL) is homologous to the Topo VI B subunit10,13. Discovery of Top6BL in plants and mouse led to identification of putative B subunits in yeasts and flies. This protein in S. cerevisiae, Rec102, was long known to be important for Spo11 activity16,17, but its relationship with the B subunit had remained unnoticed. Structural modeling suggested that the yeast and fly B-type subunits lack the GHKL domain that mediates ATP-dependent dimerization in Topo VI, whereas the mouse and plant counterparts contain a degenerate version of this domain10,13.
Biochemical studies of the meiotic DSB machinery have been lacking, largely due to difficulties in purifying components. Consequently, how Spo11 engages DNA, relationships with Topo VI, and roles of Spo11 partners have remained a matter of conjecture. We present in vitro characterization of a stoichiometric Spo11 core complex from yeast. We elucidate similarities with the ancestral Topo VI but also uncover unique features related to its exaptation as the meiotic DSB generator.
RESULTS
The meiotic DSB core complex has a 1:1:1:1 stoichiometry
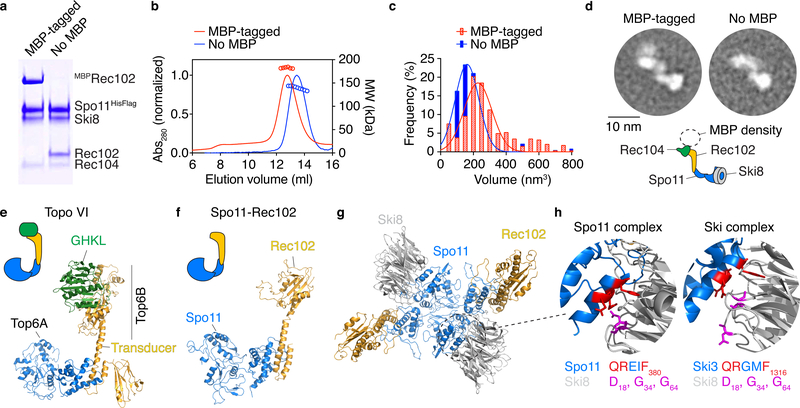
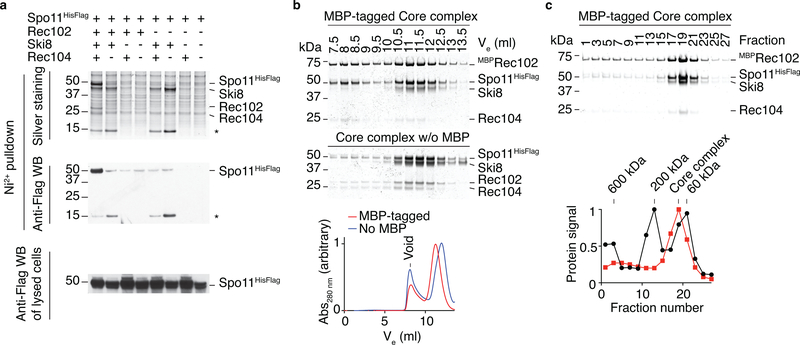
We purified complexes of Spo11 with its closest associates Ski8, Rec102, and Rec1046,17–22 (Fig. 1a). We refer to this as the “core complex.” Omission of any of the other proteins resulted in low Spo11 solubility (Extended Data Fig. 1).
Fig. 1: The meiotic DNA double-strand break core complex.
a. SDS-PAGE of purified core complexes with a C-terminal tag on Spo11, with and without MBP tag on Rec102 (4 μg per lane).
b. SEC-MALS of the core complex with and without MBP on Rec102.
c. Volumes of core complexes imaged by AFM.
d. 2D class averages from nsEM of core complexes with or without MBP on Rec102. Cartoon illustrates subunit positions.
e. Structure of Topo VI (PDB: 2Q2E)3.
f. Model of Spo11–Rec102 based on homology with Topo VI13.
g. Structural model of a dimer of the Spo11–Rec102–Ski8 complex. Rec104 is not included.
h. Interaction between Ski3 and Ski8 in the Ski complex25 and modeled interaction between Spo11 and Ski8. The motif in Ski3 that interacts with Ski8 (red) is also found in Spo11. Mutation of Q376 in Spo11 abolishes the yeast two-hybrid interaction with Ski819 and compromises integrity of the complex (see Extended Data Fig. 3).
Uncropped gel image for panel a and data for graphs in b, c are provided as Source Data.
Sizes with and without a maltose binding protein (MBP) tag (182 kDa and 140 kDa, respectively) determined by size exclusion chromatography and multi-angle light scattering (SEC-MALS) matched expectation for a heterotetramer (187 kDa and 145 kDa, respectively) (Fig. 1b). Thus, the purified core complex has a 1:1:1:1 stoichiometry, not 2:2:2:2 as expected based on Topo VI3,4,13.
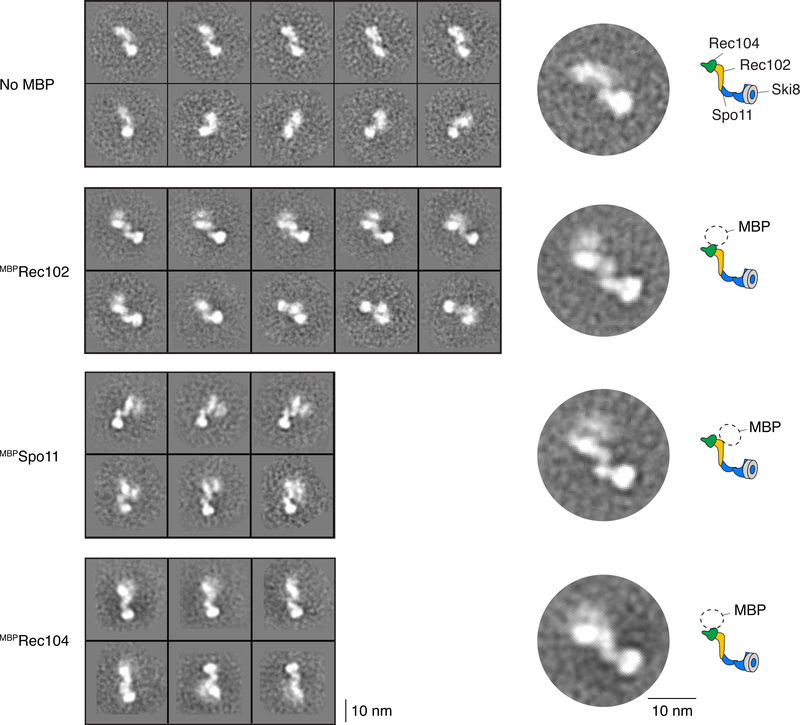
This conclusion was validated by atomic force microscopy (AFM) and negative-staining electron microscopy (nsEM). Modal particle volumes by AFM were 227 nm3 and 161 nm3 (with and without MBP, respectively) (Fig. 1c), consistent with a heterotetramer (226 nm3 and 176 nm3, respectively). Two-dimensional class averages of particles visualized by EM revealed an elongated shape (Fig. 1d, Extended Data Fig. 2). MBP-tagged complexes displayed additional signal corresponding to only a single MBP, whether the tag was on Rec102, Rec104, or Spo11 (Fig. 1d, Extended Data Fig. 2).
A structural model of the core complex
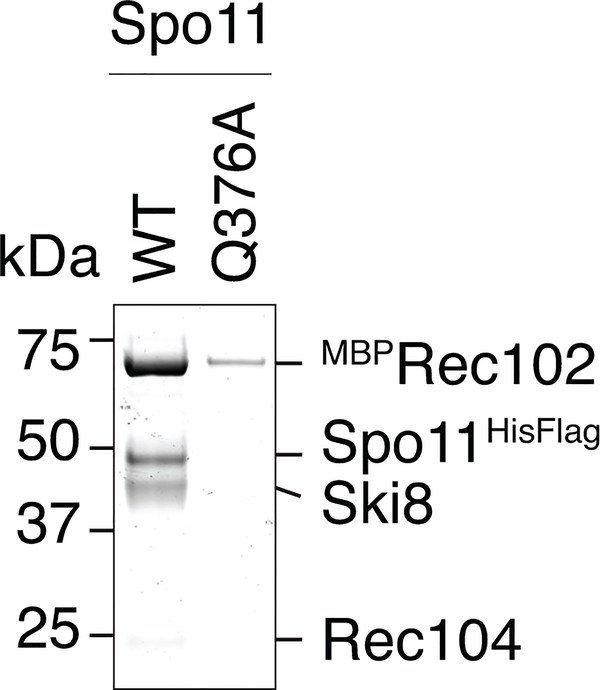
Spo11 and Rec102 were previously modeled based on homology with Topo VI (Fig. 1e, f)13. We constructed a dimeric version representing the putative DSB-competent form (Fig. 1g), based on the Topo VI holoenzyme3. The interface of Spo11 with Ski8 (crystal structures from refs 23–25) was modeled using the Ski complex, in which Ski8 directly contacts a sequence motif in Ski3 that is also present in Spo1125 (Fig. 1h). This motif is critical for Spo11–Ski8 interaction19 and integrity of the core complex (Extended Data Fig. 3). The disposition of Rec104 was unknown (see below).
Experimental validation of the structural model
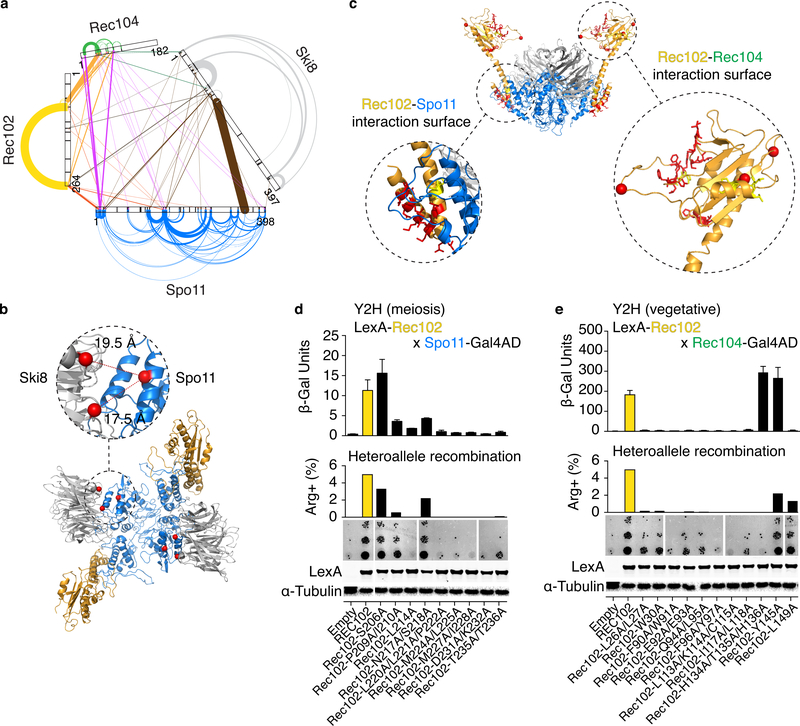
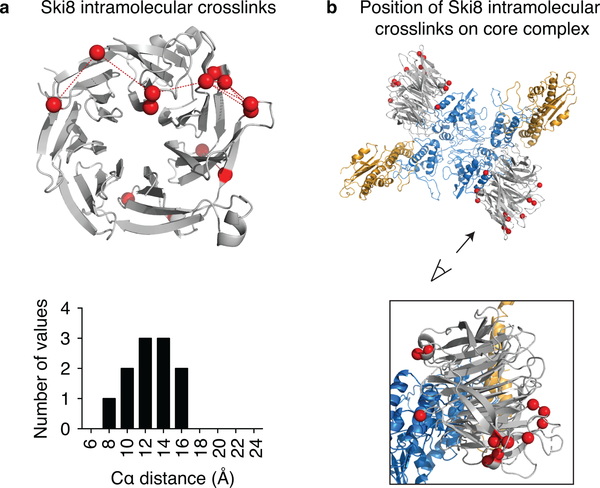
We tested the model using crosslinking and mass spectrometry (XL-MS)26 and analysis of mutants in vivo. Samples treated with disuccinimidyl suberate (DSS) yielded 861 crosslinks corresponding to 246 distinct pairs of lysines (Fig. 2a, Supplementary Table 1). For Ski8, the distances between the α-carbons of all intramolecular crosslinked lysines were below 27.4 Å (the maximum distance for DSS) (Extended Data Fig. 4a, Supplementary Table 2) and all crosslinked lysines were located away from the predicted interaction surface with Spo11 (Extended Data Fig. 4b). The XL-MS dataset thus appears appropriately constrained and specific.
Fig. 2: Protein-protein interactions within the core complex.
a. XL-MS of the core complex. Arches and lines represent intramolecular and intermolecular crosslinks, respectively. Line width is proportional to the number of independent crosslinked peptides and is a proxy for crosslinking frequency.
b. Intermolecular crosslinks between Spo11 and Ski8. Distances between α-carbons (red spheres) of crosslinked lysines are shown.
c. Positions of mutated residues (red) at predicted interaction surfaces between Rec102 and Spo11 (left), or Rec102 and Rec104 (right). Red spheres are α-carbons of Rec102 lysines that crosslink with Rec104.
d, e. Quantitative β-galactosidase assays to measure yeast-two-hybrid (Y2H) interactions in meiotic or vegetative conditions (mean ± SD from four replicates). Center: Complementation of the meiotic recombination defect in a rec102 null mutant background. The graph shows the frequency of Arg+ prototrophs generated by recombination between two different arg4 mutant alleles; the image shows examples of growth of 5-fold serial dilutions of meiotic cultures spotted onto medium lacking arginine. Bottom: anti-LexA western blotting with α-tubulin as loading control. Data for empty vector and wild-type Rec102 are duplicated in d, e to aid comparison. Uncropped blot images and data for graphs are provided as Source Data.
Intermolecular crosslinks were particularly abundant between Spo11 K350 and Ski8 K121 or K147 (fat brown line in Fig. 2a), supporting the close proximity of these residues in the model (Fig. 2b).
The Spo11–Rec102 interface was modeled on the Topo VI holoenzyme, in which an N-terminal segment of the A subunit interacts with the C-terminal end of the alpha-helical transducer domain in the B subunit (Fig. 1e, f)3,13. Crosslinks between the Spo11 N-terminus and Rec102 C-terminus may be consistent with this configuration (Fig. 2a, Supplementary Table 1), although the lysines are not in the model. More importantly, alanine scanning across the predicted interacting region of Rec102 (Fig. 2c) yielded mutants defective for interaction with Spo11 in a yeast two-hybrid assay (see mutations affecting L214 or residues 220–236 in Fig. 2d). These mutants were also defective in an arg4 heteroallele recombination assay despite being expressed at wild-type levels (Fig. 2d).
Rec104 replaces the GHKL domain
These findings support the hypothesis that the core complex retains the structural arrangement expected from homology with Topo VI. However, the B subunit lacks a GHKL domain and a subunit of unknown structure and position (Rec104) is also present.
Rec102 and Rec104—argued to behave as a functional unit20—were efficiently crosslinked (orange lines in Fig. 2a), with prominent links mapping to the top of the putative transducer domain of Rec102, at the edge of a five-stranded β-sheet (Fig. 2c). This is where the GHKL domain is seated on the transducer domain in Topo VI3,4 (Fig. 1e).
Nearly all tested alanine substitutions in this region of Rec102 (Fig. 2c) abolished or greatly reduced interaction with Rec104 and compromised meiotic recombination without reducing protein levels (Fig. 2e; e.g., F90A/W91A double substitution). Exceptions were the triple H134A/T135A/H136A substitution that showed reduced meiotic recombination but normal two-hybrid interaction, L149A that showed the opposite effect, and Y145A that behaved like wild type. The XL-MS and mutational data strongly indicate that Rec104 occupies the position expected for the GHKL domain.
DNA bending and binding to duplex junctions
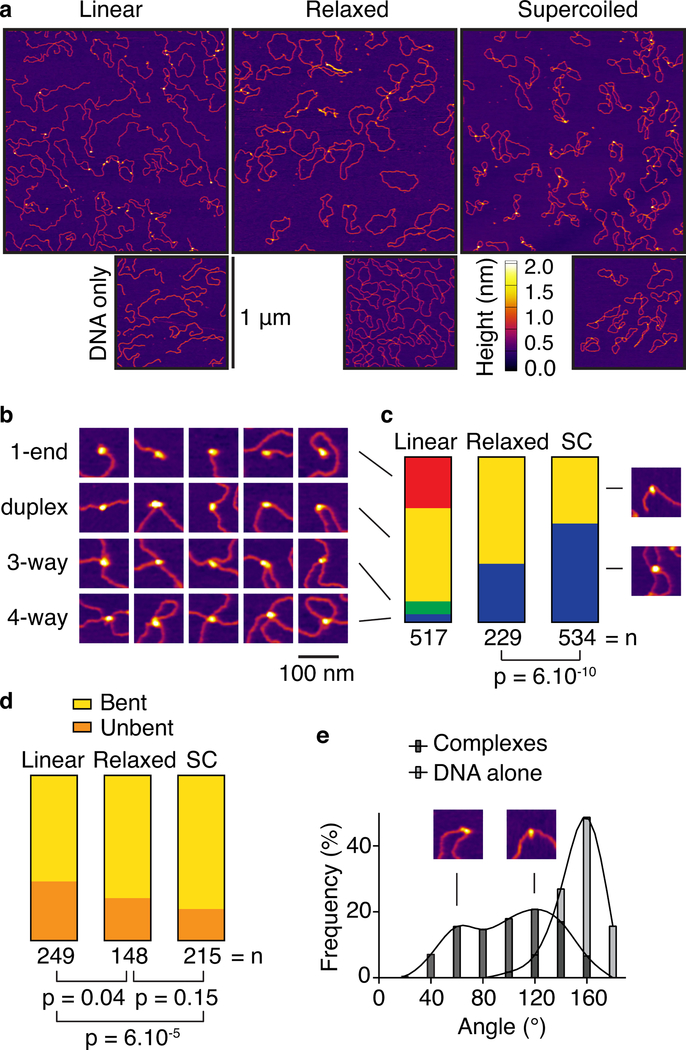
AFM analysis of the core complex binding to linear, relaxed circle, and supercoiled plasmid DNA revealed several unanticipated DNA-binding modes (Fig. 3a). With all three DNA forms, 40–65% of the particles were bound internally to the DNA duplex (Fig. 3b, c), the presumed pre-DSB substrate of Spo11. Particles were frequently associated with DNA bends (Fig. 3d, e), suggesting that the core complex either bends its substrate or prefers pre-bent DNA. Two apparent subpopulations with modal bend angles of ~60° and ~120° (Fig. 3e) may represent structural isoforms of the nucleoprotein complexes.
Fig. 3: DNA-binding by the core complex analyzed by AFM.
a. Wide-field views of core complexes bound to pUC19 plasmids.
b. Examples of binding to ends (1-end), internally on duplex DNA (duplex), junctions of three DNA arms (3-way), and junctions with four DNA arms (4-way).
c. Quantification of DNA-bound particles with the three substrates assayed. SC, supercoiled.
d. Fractions of duplex-bound particles that exhibited DNA bending.
e. Histogram of bending angles (n = 212 particles). Angles at randomly chosen positions along the DNA are shown as a control (n = 115 particles).
P values in c, d are from two-sided Fisher’s exact tests.
Data for graphs in c, d, e are provided as Source Data.
With circular substrates, 35% and 60% of the particles (relaxed and supercoiled, respectively) fell where DNA duplexes crossed one another (Fig. 3b, c). Internal duplex binding sites are in molar excess over sites where duplexes happen to cross, so we infer that the core complex prefers DNA crossings, similar to type II topoisomerases including Topo VI27–30.
Tight non-covalent interactions with DSB ends
One third of particles on linear DNA were at an end and ~7% were at locations from which three DNA arms emanated, presumably simultaneous binding to a DNA end and internally to a duplex (Fig. 3b, c). We therefore surmised that Spo11 has intrinsic affinity for the cleavage product, even without a covalent link.
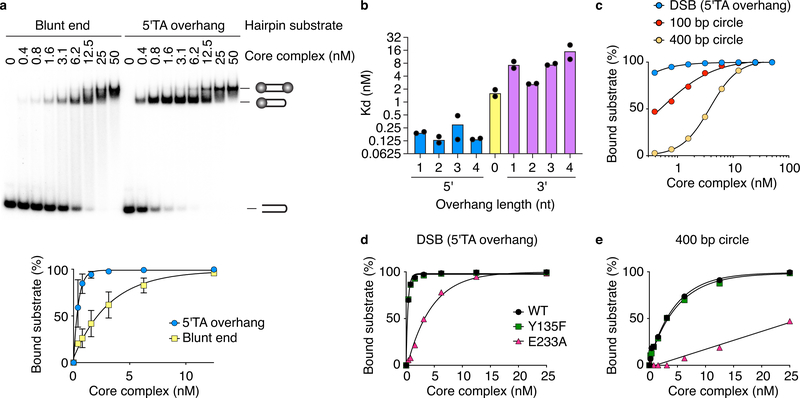
Electrophoretic mobility shift assays (EMSA) with 25-bp hairpin substrates that carried a “DSB” end that was either blunt or had a 5′-TA overhang showed a discrete band of reduced mobility starting at low concentrations of the core complex (≤ 3 nM); higher concentrations yielded an additional slower migrating band (Fig. 4a). The overhang substrate, mimicking the two-base 5′ overhang that Spo11 generates in vivo31–33, was bound better than the blunt one, but the shift to the slowest species occurred at similar protein concentrations for both substrates. We interpret the two shifted species as binding to one or both DNA ends with the order of affinities being overhang > blunt > hairpin.
Fig. 4: DNA-binding properties of the core complex.
a. EMSA of the core complex binding to DNA ends. Core complex was titrated with 5′-labeled 25-bp hairpin substrates with either blunt or two-nucleotide 5′-overhang ends. Quantification (mean ± SD from n=3 experiments) is shown below.
b. Apparent dissociation constants for binding (EMSA) to DNA ends with 5′ and 3′ overhangs of different lengths. Data points and means from two experiments are plotted.
c. Quantification of EMSAs comparing core complex binding to duplex DNA (100-bp or 400-bp DNA circles) vs. DNA ends (25-bp hairpin with 5′-TA overhang).
d, e. EMSAs of end binding (d) and duplex binding (e) by Spo11 active-site mutants. Uncropped blot image for a and data for graphs are provided as Source Data.
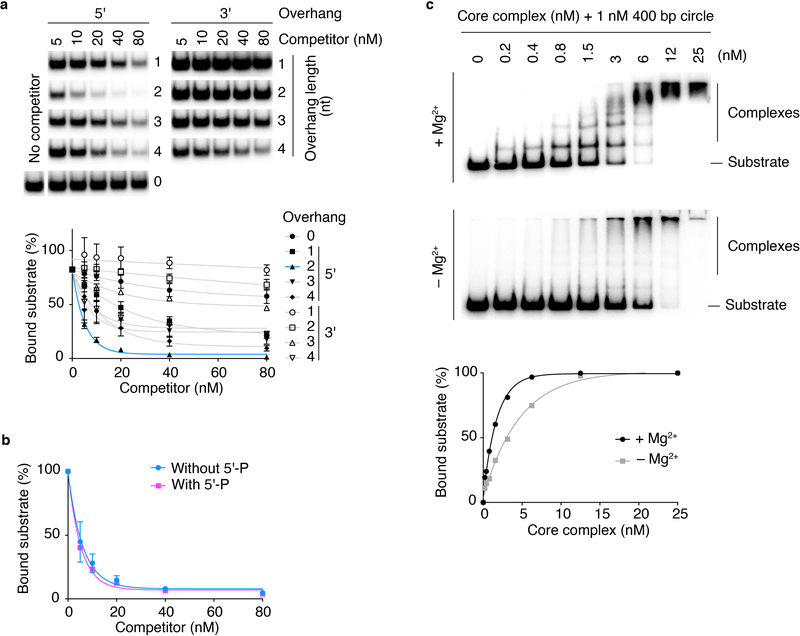
The core complex preferred 5′ overhangs to 3′, with sub-nanomolar apparent dissociation constants (Fig. 4b). These are remarkably high affinities for non-sequence-specific binding. Two-base 5′ overhangs outcompeted other lengths and end-binding did not require a 5′ phosphate (Extended Data Fig. 5a,b).
To compare end binding with internal binding to duplexes, we used 100 and 400 bp mini-circles. Compared to hairpins (apparent KD ≈ 0.1 nM), mini-circles were bound with lower affinity (KD = 0.5 ± 0.04 nM for 100 bp; 3.8 ± 0.07 nM for 400 bp) (Fig. 4c). We interpret the difference between the circles as reflecting a preference for pre-bent substrates, because the 100 bp circle is more strained34. These findings agree with AFM of plasmid substrates.
Mg2+ enhanced DNA binding (Extended Data Fig. 5c). Mutating the Spo11 catalytic tyrosine (Y135F) had no effect on DNA binding but mutating a presumptive metal-ion-coordinating glutamate (E233A) decreased binding ~10-fold (Fig. 4d, e). These results validate use of the Y135F mutant to compromise catalytic activity while maintaining DNA binding in vivo (e.g. refs 1,21) and may explain why Y135F but not E233A can be semi-dominant35.
Mapping DNA-binding sites on the core complex
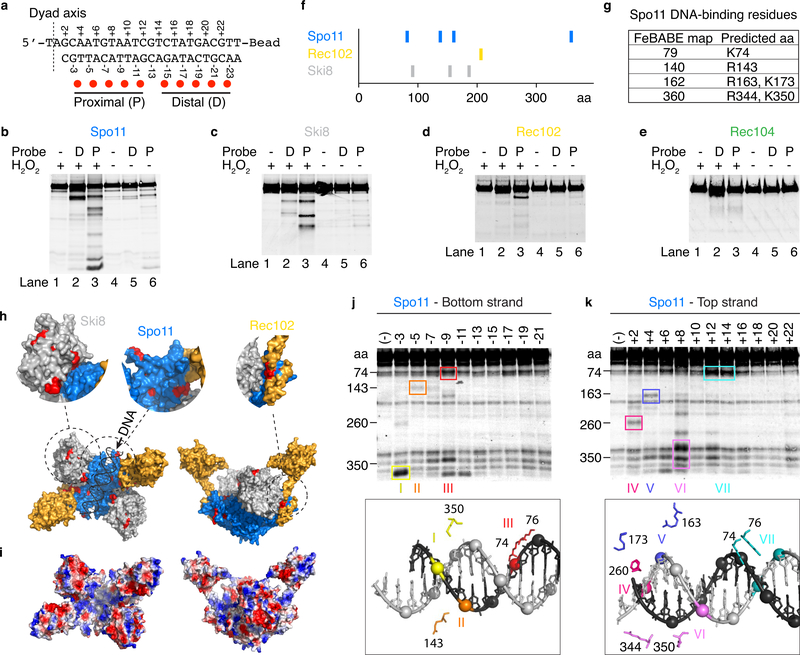
To map DNA-binding surfaces, we used FeBABE footprinting, in which chelated Fe3+ ions covalently attached to DNA generate hydroxyl radicals that cleave nearby proteins. Estimating sizes of cleavage fragments by western blotting of terminally-tagged proteins identifies protein residues that are close to DNA36,37.
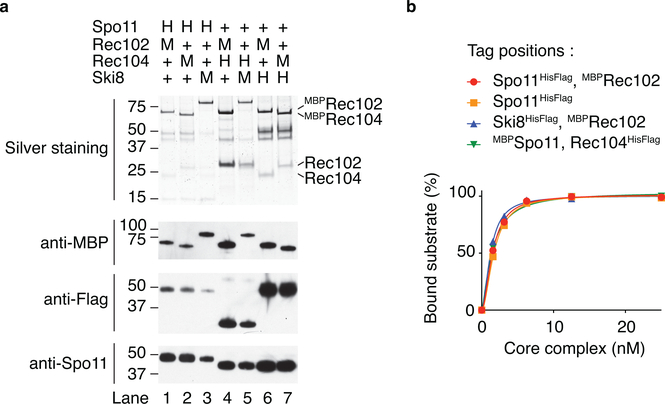
We first used two probes based on a 25-bp duplex with a two-base 5′ overhang on one end and a biotin-streptavidin block on the other, each conjugated to five FeBABE moieties that were either proximal or distal to the overhang (Fig. 5a). Each core complex subunit was tagged in turn, all with similar DNA-binding activities (Extended Data Fig. 6). Hydroxyl radical cleavage yielded specific banding patterns for Spo11, Ski8, and Rec102, and a weak signal for Rec104 (Fig. 5b–e, lanes 2 and 3). Cleavage required presence of the FeBABE probe, was strongly stimulated by hydrogen peroxide (compare lanes 2 and 3 with lanes 1, 4–6), and was more efficient with the proximal probe than the distal one (compare lanes 2 and 3), confirming binding to the overhang-containing end.
Fig. 5: Mapping DNA-binding surfaces by hydroxyl radical footprinting.
a. Sequence of the DNA substrate and positions of FeBABE moieties (red dots). The dyad axis is the center of rotational symmetry of Spo11 DSBs.
b–e. Hydroxyl radical cleavage of core complexes carrying a C-terminal Flag tag on Spo11 (b), Ski8 (c), or Rec104 (e), or an N-terminal tag on Rec102 (d). Asterisks in panel b indicate cleavage positions illustrated in panel f.
f. Summary of hydroxyl radical cleavages.
g. Estimated cleavage positions in Spo11 and corresponding predicted DNA-binding residues.
h. Hydroxyl radical cleavage sites (red) highlighted on the model of the core complex.
i. Electrostatic potential map of the core complex model.
j, k. Hydroxyl radical cleavage of tagged Spo11 using probes labeled at single positions along either the bottom (j) or top (k) strands. Prominent cleavage positions are color-coded (roman numerals) and highlighted on the structural model of the end-bound complex (below) to show the spatial correlation with positions of FeBABE-modified phosphates. Some minor cleavage positions were omitted for simplicity. Non-specific degradation fragments were also observed, some of which comigrate with bone fide FeBABE-dependent fragments because cleaved positions tend to be surface-exposed.
Uncropped blot images for panels b-e, j, k are provided as Source Data.
Cleavage positions and candidate DNA-binding (basic) residues are summarized in Fig. 5f, g, and mapped onto the model in Fig. 5h. Cleavage sites in Spo11 mapped to positions equivalent to the groove that is thought to accommodate DNA in Topo VI3,4. This predicted groove is positively charged in Spo11 (Fig. 5i). The main cleavage position in Rec102 (residue ~207) corresponds to the base of the transducer domain, close to the Spo11 DNA-binding groove (Fig. 5h, top right). Ski8 was cleaved along the surface predicted to point toward the Spo11 groove (Fig. 5h, top left). Ski8 may directly contact DNA, in which case the end-bound complex must be more closed upon itself than the model based on the Topo VI apoenzyme suggests. Additional support for conformational differences of the end-bound complex is presented below.
We next used substrates with a single FeBABE at each of multiple positions on either strand (Fig. 5j, k). Spo11 was cleaved when FeBABE was ≤14 nucleotides from the dyad axis, and each position yielded a distinct cleavage pattern that we mapped onto a model of Spo11 bound to a DNA end, highlighting specific residues predicted to lie on the surface of the DNA-binding groove (Fig. 5j, k, bottom panels). The spatial correlation between FeBABE positions and the predicted positions of DNA-binding residues provides strong experimental support for our model of Spo11 binding to the DSB end.
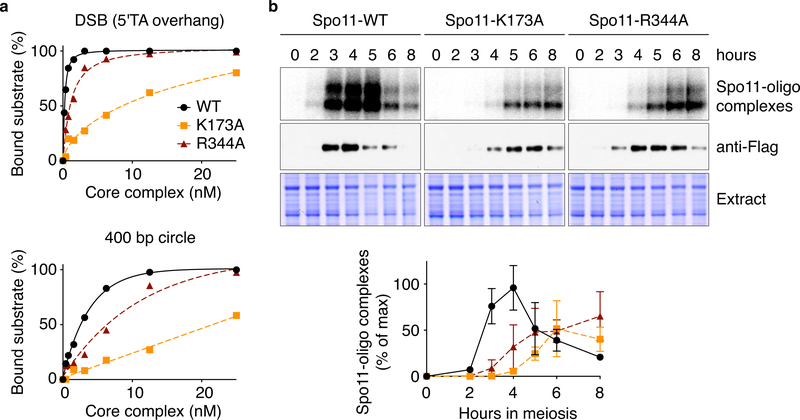
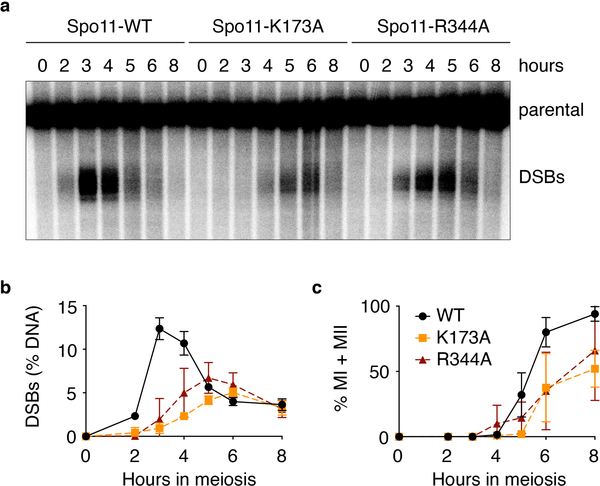
Based on these results, we mutated candidate DNA-interacting residues in Spo11. K173A and R344A mutations reduced binding, both to DNA ends and internally to duplexes (Fig. 6a). In vivo, these mutations caused reduced and delayed DSB formation as assessed by labeling of Spo11-oligo complexes (Fig. 6b) and direct DSB measurements at the CCT6 hotspot (Extended Data Fig. 7a, b). Meiotic divisions were also delayed (Extended Data Fig. 7c), possibly in part because frequently achiasmate chromosomes trigger the spindle checkpoint38.
Fig. 6: Mutations that affect Spo11 DNA binding compromise DSB formation.
a. Binding of wild-type or mutant Spo11-containing core complexes to a 25-bp hairpin substrate with 5′-TA overhang (DSB) or a DNA mini-circle. The affinity of R344A was decreased 3-fold for DNA duplex and 4-fold for DNA ends. For K178A, the affinity was decreased 27-fold for the ends and could not be measured on duplex DNA because binding did not reach saturation.
b. Labeling of Spo11-oligo complexes. Representative gels of n = 2 assays are shown above; quantification is plotted below (mean and range from two experiments).
Uncropped blot and gel images and data for graphs are provided in the Source Data.
Conformational changes upon DNA binding
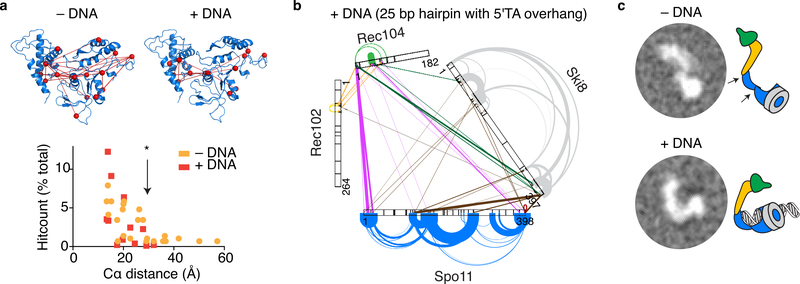
When crosslinks within Spo11 were mapped on our model, at least six lysine pairs were further apart than the crosslinker’s 27.4 Å limit (Fig. 7a, Supplementary Table 2), suggesting that Spo11 might be structurally flexible. Variability in 2D class averages from nsEM supports this interpretation (Extended Data Fig. 2). The polypeptide linker between Toprim and 5Y-CAP domains is a likely flex point39.
Fig. 7: Conformational changes upon DNA binding.
a. Model of a Spo11 monomer displaying intramolecular crosslinks without (left) and with (right) DNA. The histogram tabulates distances separating α-carbons of crosslinked lysines. The crosslinkable limit (*) is 27.4 Å. Model-clashing crosslinks would not be explained better by Spo11 dimerization.
b. XL-MS of the core complex bound to DNA (hairpin substrate with 2-nt 5′ overhang).
c. 2D class averages from nsEM of core complexes in the presence or absence of DNA.
DNA substrate in all panels was a 25-bp hairpin with 5′-TA overhang. </p/> Data for graph in panel a are provided in the Source Data.
Model-clashing crosslinks in Spo11 were not observed in the presence of DNA (Fig. 7a, b, Supplementary Table 2). We interpret that Spo11 is flexible but adopts a configuration more consistent with the model when it binds to DNA. Moreover, DNA substantially changed the crosslinking spectrum across the entire core complex (Fig. 7b). Noteworthy changes included (i) loss of prominent intramolecular and intermolecular crosslinks involving the C-terminus of Rec102, suggesting that this domain is more constrained in the presence of DNA; (ii) loss of prominent crosslinks between Ski8 and Spo11 (highlighted in Fig. 2b) presumably because occupancy of the DNA-binding groove of Spo11 obstructs crosslinker access; and (iii) appearance of crosslinks involving the C-terminus of Ski8 with Rec104 and internal parts of Spo11, consistent with end-bound complexes adopting a more closed configuration. In nsEM, the core complex tended to show an elongated shape in the absence of DNA but a more compact, closed configuration with DNA (Fig. 7c).
A DNA-binding mutant of Spo11 alters DSB processing in vivo
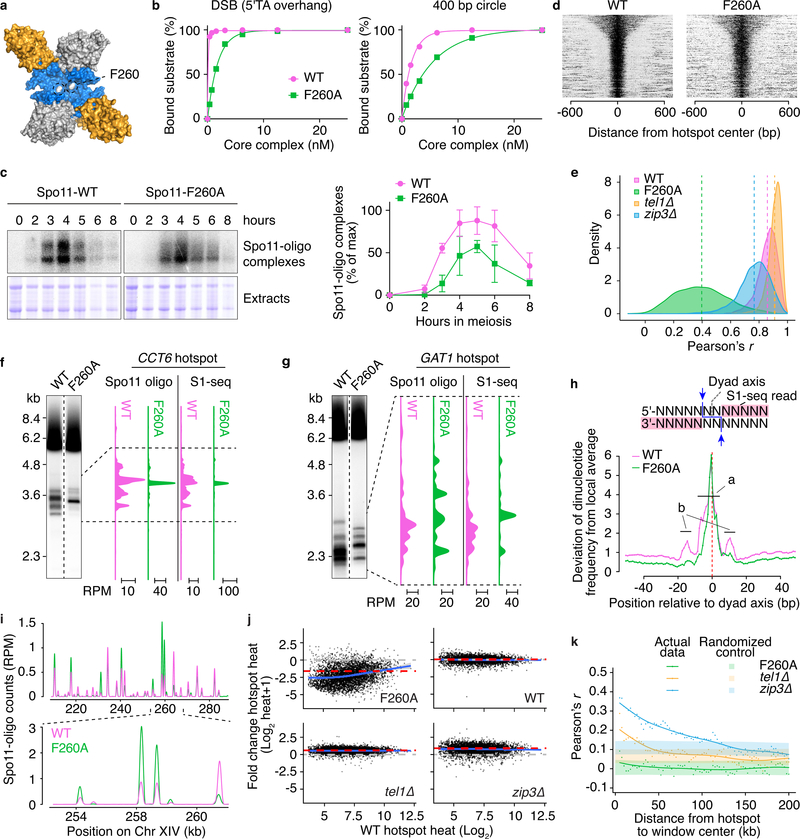
To elucidate how DNA binding contributes to Spo11 function in vivo, we analyzed the F260A mutant, which was originally constructed because the residue was predicted to be in the DNA-binding groove35 (Fig. 8a). Mutant core complexes bound DNA with reduced affinity, both at ends (12-fold) and internally (3.2-fold) (Fig. 8b). This mutant has a moderate DSB defect at specific hotspots35. Quantification of Spo11-oligo complexes indicated that global DSB frequency is reduced to about 40% of wild type (Fig. 8c).
Fig. 8: A mutation that affects Spo11-DNA interaction leads to a re-distribution DSBs.
a. Position of F260.
b. DNA binding by wild-type (WT) or F260A core complexes.
c. Labeling of Spo11-oligo complexes [left, representative gels; right, quantification (mean ± SD, three experiments)].
d. Spo11 oligos at known hotspots49 ordered by decreasing width (n=3908). Oligo counts for each hotspot were normalized to the local sum, so color coding shows spatial patterns, not relative strength between hotspots.
e. Altered DSB distribution within hotspots. For each hotspot (n=3908), we calculated Pearson’s r between the consensus Spo11-oligo pattern in wild type (average of independent maps49) and either F260A or wild type from this study, or tel1Δ and zip3Δ.
f, g. DSBs in sae2Δ genomic DNA detected by Southern blotting at CCT6 (f) and GAT1 (g).
h. Nonrandom base composition (summed deviation from local average of dinucleotide frequencies) at DSB sites. Schematic illustrates where Spo11 cuts (arrows) relative to S1-seq reads.
I,j. Altered hotspot strengths. (i) Unscaled RPM (reads per million mapped) compares relative strengths between example hotspots, not absolute changes. (j) Log-fold changes in absolute strength of hotspots (n=3908) are plotted as a function of strength in the consensus wild-type map. The genome-wide Spo11-oligo counts in F260A, tel1Δ and zip3Δ were scaled by 0.4, 1.5 and 1.8 fold, respectively, based on quantification of Spo11-oligo complexes. Lines show Loess trend (blue), average fold change (red), and no change (gray).
k. Changes in hotspot strength in F260A do not show domains of correlated behavior. Each point compares the log-fold change in hotspots with the change in their neighbors in a 5-kb window the indicated distance away. Shaded regions show 95% confidence intervals for hotspots randomized within-chromosome.
Uncropped blot and gel images for panels c, f and g and data for graphs in b, c are provided as Source Data.
We also observed an unexpected shift in the size distribution of Spo11 oligos. In wild type, radiolabeled Spo11-oligo complexes migrate on SDS-PAGE as two predominant species that differ by oligo size and are about equally abundant7, but the F260A mutant gave a strong bias toward shorter oligos (Fig. 8c and Extended Data Fig. 8a). A similar bias was seen with the other DNA-binding mutants above (K173A and R344A; Fig. 6b). These findings suggest that nucleolytic processing of DSBs is influenced by direct DNA binding by Spo11 (see Discussion).
Spo11 DNA binding shapes the DSB landscape
S. cerevisiae DSB distributions are highly nonrandom33,40–43. Most DSBs form in hotspots that mostly coincide with nucleosome-depleted regions at gene promoters6,33,40,44. At broader scales, chromosomes show large domains (tens of kb) that are relatively DSB-hot or DSB-cold, and at finer scale DSBs are distributed nonrandomly within hotspots. The factors shaping these distributions over different size scales remain poorly understood6,45.
We hypothesized that DNA binding by Spo11 influences the finest scale of the DSB landscape by selecting cleavage sites within hotspots, supported by studies of a few hotspots32,35. To test this idea genome-wide, we sequenced Spo11 oligos. Because a larger fraction of oligos in the F260A mutant were of the unmapped shorter class, we also mapped unresected DSBs in a sae2 background using S1-seq, which uses S1 nuclease to remove 3′-ssDNA tails of resected DSBs and 5′ overhangs of unresected DSBs46,47. Biological replicate maps were highly reproducible (Extended Data Fig. 8b, c). For results described below, Spo11-oligo mapping and S1-seq were largely indistinguishable.
Hotspots in the mutant had similar widths as in wild type (Fig. 8d), reflecting the constraining influence of the surrounding nucleosomes33. However, as predicted, there was a dramatically different DSB distribution within hotspots (Fig. 8e), irrespective of how strong the hotspots were in wild type (Extended Data Fig. 8d). For example, whereas DSBs occurred across ~880 bp of the CCT6 hotspot in wild type, most of the F260A signal collapsed to a single site (Fig. 8f). Similarly at the GAT1 hotspot, DSBs formed at a smaller number of prominent sites in the mutant than in wild type (Fig. 8g). Some of the newly prominent sites were also targeted by wild-type Spo11, but often they were either relatively minor sites in wild type or not cleaved at all (e.g., the uppermost band at GAT1 for the mutant, Fig. 8g). Thus, Spo11-F260A has substantially altered site selectivity, possibly attributable to its altered affinity for DNA.
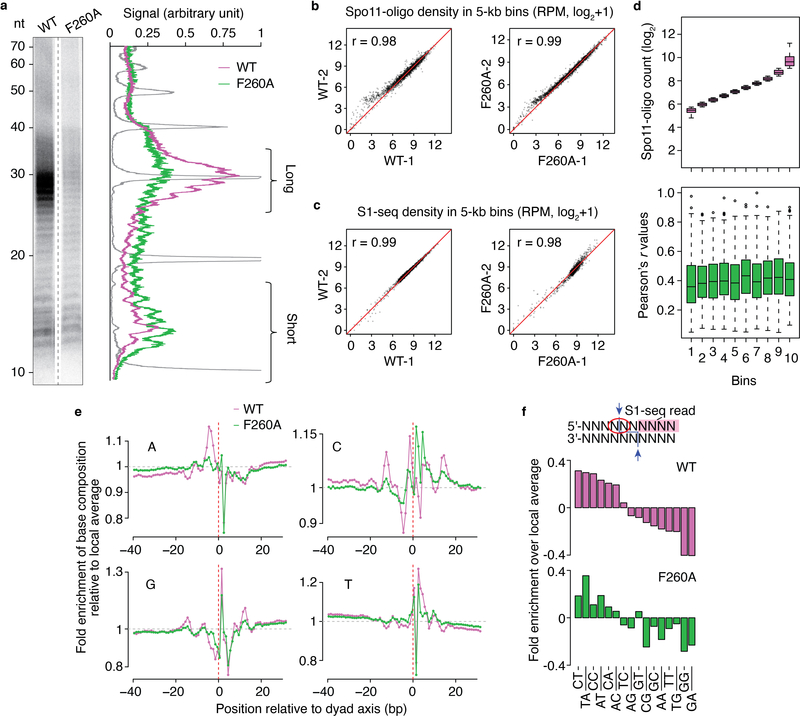
Map positions of Spo11 oligos tend to occur in the context of a rotationally symmetric base composition bias that implies preferences of Spo11 for DNA binding and catalysis33. We speculated that the altered site selectivity of F260A would be accompanied by changes in these preferences. To test this, we used the S1-seq maps because these are not subject to a mapping ambiguity caused by rGMP-tailing of Spo11 oligos during library preparation33. In wild-type, C residues were favored and G residues were disfavored at the position 5′ of the scissile phosphate, and dinucleotides encompassing the scissile phosphate were enriched for 5′-C[A/C/T], TA, AT and AC, but were depleted for GG and GA (Extended Data Fig. 8e, f). Moreover, there was a ~20-bp zone of strong sequence bias centered on the dyad axis (“a” region in Fig. 8h, which corresponds to the footprint deduced by docking Topo VI onto DNA) flanked by sites of weaker bias 11–16 bp on either side of the dyad axis (“b” regions in Fig. 8h, outside the predicted footprint). These patterns agree with prior findings33.
By contrast, F260A reduced or eliminated most of these base composition signatures. There was less enrichment for C and depletion of G 5′ of the scissile phosphate (Extended Data Fig. 8e) and a corresponding alteration in dinucleotide preferences (i.e., less enrichment (C[A/C/T]) or more depletion (CG) of dinucleotides with 5′-C; Extended Data Fig. 8f). Other changes within the predicted Spo11 footprint included substantial weakening of the normally strong preference for A at positions –2 to –5 and for T at +2 to +5 (Extended Data Fig. 8e) and regions outside of the footprint showed a flattening of all of the base composition maps, i.e., substantially less bias (Fig. 8h & Extended Data Fig. 8e).
Unexpectedly, we also observed that relative strengths of hotspots changed substantially (Fig. 8i). To examine these changes, we scaled the F260A map based on the global 2.5-fold decrease in Spo11-oligo complexes (Fig. 8c) and plotted the absolute log-fold change in the mutant as a function of hotspot strength in wild type (Fig. 8j). Compared with other mutants that change the DSB landscape (tel1Δ and zip3Δ), Spo11-F260A caused a wider dispersion of fold changes, and the fold changes showed a modest negative correlation with hotspot strength in wild type. In other words, hotspots vary markedly from one another in their response to F260A, with a tendency for weaker hotspots to decrease more. In tel1Δ and zip3Δ mutants, large-scale changes in relative hotspot strength occurred in a domain-wise fashion in which the behavior of individual hotspots was correlated with other hotspots within 50 kb or more48,49. In contrast, the F260A mutant showed no evidence of such local correlation (Fig. 8k), indicating that the mutation affects DSB frequency in a “hotspot-autonomous” rather than domain-wise fashion. We conclude that Spo11 DNA-binding activity contributes to a surprising degree to the selection of which hotspot will be cleaved, not just to the selection of cleavage site within a hotspot.
DISCUSSION
Biochemical characterization of the meiotic DSB core complex from S. cerevisiae shows that it retains molecular architecture and DNA-binding properties similar to ancestral Topo VI. Nevertheless, key differences stand out, presumably reflecting distinct biological requirements in recombination initiation vs. control of DNA topology.
Architecture of the core complex
The 1:1:1:1 stoichiometry was unanticipated because Topo VI forms a stable A2B2 dimer of dimers3,4 and because DSB formation requires two Spo11 subunits. Mouse SPO11 and TOP6BL were suggested to form 2:2 complexes when expressed in E. coli13. However, this conclusion was based on low-resolution gel filtration and glycerol gradient sedimentation analysis and the proteins were not shown to retain DNA-binding activity, so misfolding or nonspecific aggregation cannot be excluded. Thus, while it is possible that the purified yeast and mouse proteins behave differently, available data do not definitively establish the stoichiometry of the mammalian complex. We propose that controlled dimerization of yeast Spo11 controls DSB formation in vivo. More specifically, we suggest that dimerization of the core complex occurs in the context of recruitment to the chromosome axis by Rec114. Indeed, coimmunoprecipitation experiments indicated that Spo11 self-association depends on Rec102, Rec104, and Rec11422.
The core complex retains an overall topology similar to Topo VI, in which ATP-dependent dimerization of the GHKL fold is communicated by the transducer domain to the A subunit to coordinate DSB formation with passage of an intact duplex through the DNA gate3. The mouse and plant TOP6BL subunits have both GHKL and transducer domains10,13. In yeast, the B subunit appears to be split into two polypeptides with Rec102 forming the transducer domain and Rec104 occupying the position where the GHKL domain should be. Perhaps it is similar in S. pombe and Drosophila, whose TOP6BL homologs also lack GHKL domains13,50.
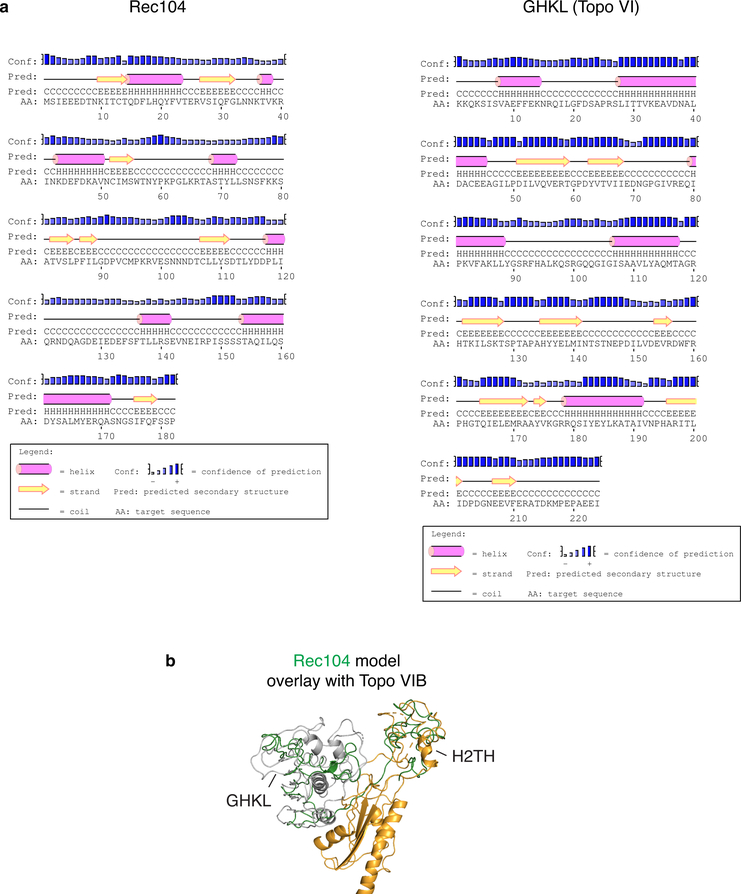
One possibility is that Rec104 evolved from part of the ancestral Top6BL subunit and now remains as a highly divergent GHKL-like fold. In potential support of this idea, although secondary structure prediction was uninformative about a potential relationship with GHKL (Extended Data Fig. 9a), iTasser51 generated a three-dimensional model for Rec104 with similarity to the GHKL fold when Topo VIB was the template (Extended Data Fig. 9b). This model also included partial overlap with the helix-two-turns-helix (H2TH) domain of Top6B that was not identified in the mouse homolog but was proposed to remain in vestigial form in the plant homolog10,13. Another possibility is that Rec104 is a wholly unrelated structure occupying the GHKL position. In either case, Rec104 lacks recognizable ATPase motifs. The mouse and plant TOP6BL proteins also lack important ATPase residues10,13. Topoisomerases are proposed to use ATP to avoid entrapment in the covalent complex52. Perhaps loss of ATPase activity was a route to yield the meiotic DSB enzyme from the ancestral topoisomerase.
The S. cerevisiae core complex also includes Ski8, which is separately part of the Ski complex that provides mRNA to the exosome for degradation19,25. Spo11–Ski8 interaction is essential for DSB activity19 and integrity of the core complex, but its specific function is unclear. Ski8 has a WD40 structure, something often involved in protein-protein interactions23. Ski8 may also directly participate in DNA binding, as suggested by FeBABE footprinting. However, FeBABE assays for proximity, not interaction, so whether Ski8 directly contacts DNA is unclear. The role of Ski8 in DSB formation is conserved in S. pombe and S. macrospora, but not Arabidopsis53–55.
Substrate specificities and reaction dynamics
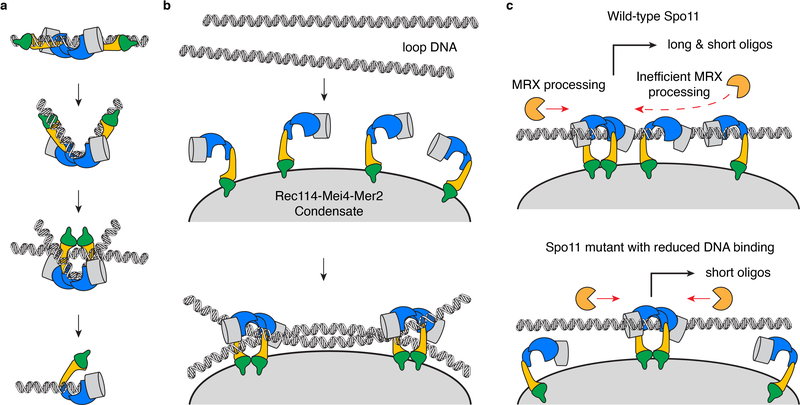
We propose that the different modes of interaction between the core complex and DNA revealed by AFM correspond to intermediates in a multi-step reaction pathway. Spo11 may introduce a bend as it engages DNA, then may trap a second duplex within a closed dimer, similar to Topo VI (Extended Data Fig. 10a)3,30. In this model, catalysis occurs on a trapped junction and the core complex then remains tightly associated to the DSB end through both non-covalent protein-DNA interactions and the covalent phosphotyrosyl link.
An important caveat is that our data do not establish a temporal relationship between the binding modes. Moreover, although the end-bound complex is clearly monomeric, the stoichiometry of the other DNA-bound complexes is unclear. It is possible that binding to two crossed DNA duplexes and/or the three-armed complexes containing an internally bound duplex and a DNA end reflect assembly of dimers of the core complex (hetero-octamers).
The similarities in DNA-binding properties between the core complex and type II topoisomerases are intriguing. The biological function of Spo11 does not require strand passage, so it is unclear why Spo11 retained affinity for DNA junctions27–30. One possibility is that Spo11 captures both sister chromatids to restrict cleavage to just one. An alternative invokes tethering of the core complex to the chromosome axis: perhaps the uncleaved duplex corresponds to axis DNA while the duplex that experiences the DSB corresponds to the loop.
DNA binding residues and substrate selection by Spo11
FeBABE footprinting provided direct experimental support for the predicted DNA-binding surface on Spo11 and identified residues K173 and R344 as likely DNA-interacting residues that affect cleavage in vivo. Genome-wide DSB mapping with the DNA-binding mutant F260A revealed profound effects on the DSB landscape, showing that Spo11 directly influences both fine-scale and hotspot-scale selection of cleavage sites.
The attenuated binding affinity of F260A means that Spo11 preferences contribute less to site selection, and other factors now contribute more, such as chromatin structure (including nucleosome occupancy, H3K4me3 binding by Spp1), competition with other proteins for DNA access, and DNA binding by Spo11-associated proteins. The remaining base composition bias in the mutant is strongly concentrated around the dyad axis, suggesting that it reflects direct constraints on catalysis and/or binding.
The effect of Spo11 DNA binding on DSB processing
The DNA-binding mutants K173A, F260A and R344A yielded fewer of the longer Spo11 oligos. The provenance of the long and short oligo classes was previously unclear33,56, but was recently explained through studies of DSB patterns57. Spo11 can often cut the same DNA molecule twice in close proximity; when it does, the cuts are spaced at intervals with a 10-bp periodicity that is interpreted to mean that adjacent Spo11 complexes engage the same side of a DNA duplex. This suggests that Spo11 complexes are tethered on a surface57. Rec114–Mei4 and Mer2 complexes undergo DNA-driven macromolecular condensation58, so we propose that Rec114–Mei4–Mer2 nucleoprotein assemblies attached to the chromosome axis provides a surface that is occupied by co-oriented Spo11 core complexes that can engage DNA simultaneously (Extended Data Fig. 10b).
Short oligos are enriched at the edges of DSB hotspots, suggesting that oligo size is dictated in part by the access of MRX/Sae2, which is proposed to be inhibited at the center of the hotspot by arrays of Spo11 complexes57. The depletion of the long-oligo class we observed with Spo11 DNA-binding mutants is consistent with this model, because reduced occupancy of hotspot DNA by mutant complexes should improve the access of Mre11 (Extended Data Fig. 10c).
Spo11 end binding and DSB repair
Usual models envision that Spo11-oligo complexes dissociate from the complementary 3’-end after MRX/Sae2-mediated clipping, although it has been argued that longer oligos might require active displacement7,15. In fact, the remarkably tight end binding by the core complex suggests that Spo11-oligo complexes may cap most DSB ends, potentially affecting subsequent repair. In support, recent mapping of ssDNA–dsDNA junctions in mouse spermatocytes revealed patterns of recombination intermediates consistent with the 3’ end remaining annealed to the Spo11 oligo59,60. Because the core complex is tethered to the chromosome axis, probably embedded in Rec114–Mei4–Mer2 condensates, end-capping might maintain a physical connection between the two broken ends during recombination, facilitating repair and reducing the risks of gross chromosomal rearrangements.
ONLINE METHODS
Preparation of expression plasmids and baculoviruses
Oligonucleotides (Integrated DNA Technologies) are in Supplementary Table 3. Plasmids are in Supplementary Table 4. Expression vectors for untagged Spo11, Ski8, Rec102 and Rec104 were generated by cloning sequences from SK1 in pFastBac1 (Invitrogen). C-terminal 10xHis–3xFlag tags on Spo11 or Ski8 were introduced by inverted PCR and self ligation; N-terminal tagging of Rec102 was achieved by cloning in pFastBac-HTb-Flag, which codes for 6xHis and 2xFlag tags. N-terminal MBP-tagged vectors were generated by amplifying MBP from pMAL-c2x and cloning into the untagged expression construct using appropriate restriction enzymes. Point mutants were generated by QuikChange mutagenesis. The viruses were produced by a Bac-to-Bac Baculovirus Expression System (Invitrogen) following the manufacturer’s instructions. The C-terminal tag on Spo11 is known to be functional in vivo61.
The yeast two-hybrid vector expressing the LexA-Rec102 fusion (pSK282) was reported previously62. Rec102 mutants were generated by QuikChange using pSK282 as a template and verified by sequencing using primer cb902. Gal4AD-Spo11 (pSK305) and Gal4AD-Rec104 (pSK310), empty Gal4AD (pSK276) and LexA (pSK272) vectors were described previously19.
Expression and purification of recombinant proteins
Spo11 core complexes were expressed by co-infecting Spodoptera frugiperda Sf9 cells with a combination of viruses at a multiplicity of infection (MOI) of 2.5 each. Spo11HisFlag:Ski8:Rec102:Rec104 complex used viruses produced from vectors pCCB592, pCCB587, pCCB588 and pCCB589. Spo11HisFlag:Ski8:MBPRec102:Rec104 complex used pCCB592, pCCB587, pCCB617 and pCCB589. Other tagged or mutant complexes were prepared using the appropriate combination of viruses (vector list in Supplementary Table 4).
Cells were harvested 62 h after infection, washed with phosphate buffered saline (PBS), frozen in dry ice and kept at −80 °C until use. A typical purification was performed with cell pellets from 0.5–2 l culture. All purification steps were carried out at 0–4 °C. Cell pellets were resuspended in 4 volumes of lysis buffer (25 mM HEPES-NaOH pH 7.5, 500 mM NaCl, 0.1 mM DTT, 20 mM imidazole, 1× Complete protease inhibitor tablet (Roche) and 0.1 mM phenylmethanesulfonyl fluoride (PMSF)). Cells were lysed by sonication and centrifuged at 43,000 g for 30 min. Cleared extract was loaded onto 1 ml pre-equilibrated NiNTA resin (Qiagen). The column was washed extensively with Nickel buffer (25 mM HEPES-NaOH pH 7.5, 500 mM NaCl, 10% glycerol, 0.1 mM DTT, 20 mM imidazole, 0.1 mM PMSF). The tagged complexes were then eluted in Nickel buffer containing 250 mM imidazole. MBP-tagged complexes were further purified on amylose resin (NEB). The core complex without MBP was instead further purified on Anti-Flag M2 affinity resin (Sigma). Fractions containing protein were pooled and diluted in 3 volumes of Amylose/Flag buffer (25 mM HEPES-NaOH pH 7.5, 500 mM NaCl, 10% glycerol, 2 mM DTT, 5 mM EDTA). Next, the complexes were bound to 1 ml of the appropriate resin in a poly-prep chromatography column (Bio-Rad) and the resin was washed extensively with buffer. Complexes were eluted from amylose resin with buffer containing 10 mM maltose, or from anti-Flag resin with buffer containing 250 μg/ml 3xFlag peptide (Sigma). Fractions containing protein were pooled and loaded on a Superdex 200 column preequilibrated in Amylose/Flag buffer. Fractions containing protein were concentrated in 50-kDa-cutoff Amicon centrifugal filters (Millipore). Aliquots were frozen in dry ice and stored at −80 °C. Mutant core complexes were prepared using the same procedure as the wild-type proteins.
Substrates for DNA-binding assays
DNA substrates were generated by annealing complementary oligos (Supplementary Table 3). Oligos over 40 nucleotides were first purified on 10% polyacrylamide-urea gels. They were subsequently mixed in equimolar concentrations (typically 10 μM) in STE (100 mM NaCl, 10 mM Tris-HCl pH 8, 1 mM EDTA), heated and slowly cooled on a PCR thermocycler (98 °C for 3 min, 75 °C for 1 h, 65 °C for 1 h, 37 °C for 30 min, 25 °C for 10 min).
Hairpin substrates for EMSA were assembled by self-annealing of the following primers: blunt end (cb953); 5′-overhang of 1 nt (cb1061), 2 nt (cb957), 3 nt (cb1062), 4 nt (cb1063); 3′-overhang of 1 nt (cb1064), 2 nt (cb1065), 3 nt (cb1066), 4 nt (cb1067). Substrates were 5′ end-labeled with [γ-32P]-ATP (Perkin Elmer) and T4 polynucleotide kinase (NEB) and purified by native polyacrylamide gel electrophoresis. The 100-bp mini-circle was prepared as follows: oligos cb1027 and cb1028 were labeled with [γ-32P]-ATP (Perkin Elmer) by T4 polynucleotide kinase. Labeled oligos were mixed and annealed by boiling and slow cooling. The mini-circle was then ligated with T4 DNA ligase and the circle substrate was purified by native polyacrylamide gel electrophoresis. The 400-bp mini-circle was prepared by PCR amplification of pUC19 plasmid DNA with phosphorylated primers cb962 and cb963 in the presence of α-32P-dCTP and self-ligation in dilute conditions by T4 DNA ligase. The DNA was concentrated by ethanol precipitation and the mini-circle purified by native agarose electrophoresis.
Substrates for hydroxyl radical footprinting used the 3′-biotinylated oligo cb958 and either the unmodified oligo cb959 (5’-TA-control) or the phosphorotioate-containing oligo cb560 (5′-TA-distal) or cb561 (5′-TA-proximal). FeBABE probes in Fig. 5j used oligo cb598 annealed with cb1072 to cb1081. Probes in Fig. 5k used cb1082 annealed with cb1083 to cb1093. Oligos were annealed in 40 μl STE at a concentration of 5 μM biotinylated oligos and a 1.2-fold excess of non-biotinylated oligos, then ethanol precipitated and resuspended in 20 mM MOPS pH 7.9. FeBABE conjugation to phosphorothioate-containing DNA substrates were in 20 μl reactions in 20 mM MOPS (pH 7.9) containing 4 μM DNA and 3.5 mM FeBABE (Dojindo). After 16 h incubation at 50 °C, the substrates were immobilized to 800 ng M280 streptavidin-coated Dynabeads (Invitrogen) in 400 μl 20 mM MOPS (pH 7.9) for 4 hours at 4 °C. Excess FeBABE was removed by washing three times with 500 μl 20 mM MOPS pH 7.9 and one time with 200 μl storage buffer (25 mM Tris-HCl pH 7.5, 10% glycerol, 100 mM NaCl, 200 μg/ml BSA). Substrates were resuspended in storage buffer at an estimated concentration of 1000 pmol/μl beads (final substrate concentration of about 1 μM) and stored at 4 °C.
Electrophoretic mobility shift assays
Binding reactions (20 μl) were carried out in 25 mM Tris-HCl pH 7.5, 7.5% glycerol, 100 mM NaCl, 2 mM DTT, 5 mM MgCl2 and 1 mg/ml BSA with 0.1 nM DNA (for hairpin substrates) or 1 nM DNA (for mini-circles) and the indicated amounts of protein complexes. Complexes were assembled for 30 minutes at 30 °C and separated on a 5% Tris-acetate-polyacrylamide/bis (80:1) gel containing 0.5 mM MgCl2 at 200 V for two hours. Gels were dried then analyzed by phosphorimaging (Fuji). Apparent dissociation constants (KD) were estimated from protein titration EMSA experiments as the concentration of protein at which 50% of the substrate was bound. Because binding to 5′ overhang substrates was so tight (apparent KD close to the DNA substrate concentration in the assay), these measurements are approximations of the true KD.
Hydroxyl radical cleavage assay
Binding reactions (20 μl) were in 25 mM Tris-HCl pH 7.5, 10% glycerol, 100 mM NaCl, 1 mg/ml BSA, 5 mM MgCl2 with 25 nM immobilized substrates and 25 nM Spo11 core complex. Complexes were assembled for 10 minutes at 30 °C, washed twice with 200 μl FeBABE buffer (25 mM Tris-HCl pH 7.5, 10% glycerol, 100 mM NaCl, 5 mM MgCl2, 0.01% NP-40) with 2 mM DTT and once with 200 μl buffer without DTT. Reactions were resuspended in 20 μl FeBABE buffer. One half (10 μl) was treated with 1.25 μl of 50 mM sodium ascorbate followed rapidly with 1.25 μl of 50 mM H2O2 in 10 mM EDTA and the cleavage reaction performed at 30 °C for 10 minutes. The other half was left untreated as a negative control. Reactions were quenched with 6 μl 4× LDS sample buffer and 1 μl 1 M DTT, boiled for 5 minutes and loaded on 4–12% NuPAGE Bis-Tris gels (to analyze the Spo11 and Ski8 fragments) or 10% gels (to analyze the Rec102 and Rec104 fragments) in MES running buffer. After electrophoresis, proteins were transferred onto Immobilon-FL PVDF membranes (Millipore) and membranes were probed with Anti-Flag M2 antibody (Sigma) followed by a IRDye 680RD Goat anti-mouse IgG (Li-COR). Blots were imaged using the Li-COR Bioscience Odyssey infrared system.
Mapping of the protein-DNA interface
The sizes of Flag-tagged fragments of Spo11, Ski8, Rec102 and Rec104 generated by hydroxyl radical cleavage were determined by comparing their migration with MagicMark™ XP Western protein standards (Invitrogen). Lane profiles were quantified using ImageGauge. Peaks identified for molecular weight standards were fitted to a fourth order polynomial equation of migration distance as a function of molecular weight. The accuracy with which fragment sizes are estimated was assessed by comparing deduced trypsin and chymotrypsin cleavage sites with expected cleavage sites. Based on multiple experiments, we estimate that cleavage sites are mapped within 5–10 residues.
Structural modeling
The Ski complex is from PDB accession number 4BUJ25. Ski8 intramolecular crosslinks were mapped on 1SQ923. The homology model for Spo11 and Rec102 was reported previously13. Secondary structure predictions were generated by PsiPred63. The 3D model of Rec104 was generated by iTasser51 with Topo VIB (PDB: 2Q2E) as a template (C-score = −2.15, estimated TM-score = 0.46 ± 0.15, estimated RMSD = 10.0 ± 4.6 Å). The model of the core complex was generated using Pymol. The pdb files are available upon request.
AFM imaging
Relaxed and linear plasmids for AFM were prepared by treatment of pUC19 with topoisomerase I and NdeI, respectively. Core complexes were diluted to a final concentration of 4 nM in the presence of 1 nM DNA in 25 mM HEPES-NaOH pH 6.8, 5 mM MgCl2, 50 mM NaCl, 10% glycerol. Complexes were assembled at 30 °C for 30 minutes. A volume of 40 μl of the protein-DNA binding reaction was deposited onto freshly cleaved mica (SP1) for 2 minutes. The sample was rinsed with 10 ml ultrapure deionized water and the surface was dried using a stream of nitrogen. AFM images were captured using an Asylum Research MFP-3D-BIO (Oxford Instruments) microscope in tapping mode at room temperature. An Olympus AC240TS-R3 AFM probe with resonance frequencies of approximately 70 kHz and spring constant of approximately 1.7 N/m was used for imaging. Images were collected at a speed of 0.5–1 Hz with an image size of 2 μm at 2048 × 2048 pixel resolution.
For AFM imaging of proteins alone, samples were diluted in 25 mM HEPES-NaOH pH 7.5, 500 mM NaCl, 10% glycerol, 2 mM DTT, 5 mM EDTA. Immobilized proteins were imaged with a Bruker FMV-A AFM probe with resonance frequencies of approximately 75 kHz and spring constant of approximately 2.5 N/m. Images were collected at a speed of 0.8 Hz with an image size of 1 μm at 512 × 512 pixel resolution. For volume analyses, raw data were exported into 8-bit grayscale tiff images using the Asylum Research’s Igor Pro software. Tiff images were then imported into FIJI/ImageJ (NIH) for quantification of volume using a custom written FIJI code. A height threshold of 0.25 nm was set for each protein sample, as well as a pixel area threshold, to exclude noise from the image. The volume of each structure was calculated using the formula V = Iavg · Zconversion · Ap · XYconversion2 where Iavg is the average intensity, Zconversion is the conversion of one gray scale unit of intensity into height in nanometers, XYconversion is the pixel to nanometer conversion for the image in xy, and Ap is the area of particles in pixels. The predicted volume of protein complexes can be calculated according to the equation: Vc = V1 × M0 / N0, where M0 is the molecular weight, N0 is Avogadro’s number and V1 is the specific volume for proteins (0.73 cm3 g−1)64. Based on this equation, the predicted volume of a 1:1:1:1 core complex with MBP tag (187.8 kDa) or without MBP tag (145.3 kDa) is 226 nm3 and 176 nm3, respectively.
Additional FIJI analysis was done for the quantification of DNA bending angles at protein-DNA interaction sites. A FIJI macro was written to allow for two lines to be manually drawn on DNA strands on either side of a DNA-protein binding event to allow for automated calculation of the angles created by the DNA strand.
Yeast strains and targeting vectors
Yeast strains were from the SK1 background (Supplementary Table 5). Flag-tagged Spo11 strains were constructed by transformation of Sph1 fragments of plasmids pSK806 (WT), pSK809 (F260A), pCCB822 (K173A) and pCCB823 (R344A), replacing the endogenous locus with the tagged construct together with a hygromycin resistance cassette.
XL-MS
For protein-alone samples, ~25 μg protein complexes were cross linked in 160 μl reactions in the presence of 2 mM disuccinimidyl suberate (DSS) in buffer containing 25 mM HEPES-NaOH pH 7.5, 500 mM NaCl, 10% glycerol, 2 mM DTT, 5 mM EDTA. After 10–20 minutes at 30 °C, reactions were quenched with 100 mM Tris-HCl pH 7.5. For crosslinking in the presence of DNA, 20 μg core complexes was bound to equimolar concentrations (100 nM) of a 25 bp hairpin substrate with 2 nt 5′-overhang in a 6-ml reaction volume. Binding reactions and crosslinking were performed as above, but with 100 mM NaCl and 5 mM MgCl2 (instead of EDTA). After crosslinking, proteins were concentrated by acetone precipitation and resuspended in 1× Laemmli buffer. Samples were boiled, separated by SDS-polyacrylamide gel electrophoresis and stained with SimplyBlue SafeStain (Invitrogen). Slower-migrating bands representing protein-protein crosslinks were excised and digested in situ with trypsin digestion as described65. The tryptic peptides were purified using a 2-μl bed volume of Poros 50 R2 (Applied Biosystems) reversed-phase beads packed in Eppendorf gel-loading tips66. The digested peptides were diluted to 0.1% formic acid, and each sample was analyzed separately by microcapillary LC with tandem MS by using the NanoAcquity system (Waters) with a 100 μm inner diameter × 10 cm length C18 column (1.7 μm BEH130; Waters) configured with a 180 μm × 2 cm trap column coupled to a Q-Exactive Plus mass spectrometer (Thermo Fisher Scientific). A proxeon nanoelectrospray source set at 1800 V and a 75 μm (with 10 μm orifice) fused silica nano-electrospray needle (New Objective, Woburn, MA) was used to complete the interface. 1 μl of sample was loaded onto the trap column, washed with 3× loop volume of buffer A (0.1% formic acid) and the flow was reversed through the trap column and the peptides eluted with a 1–50% acetonitrile (with 0.1% formic acid) gradient over 50 min at a flow rate of 300 nl/min over the analytical column. The QE Plus was operated in automatic, data-dependent MS/MS acquisition mode with one MS full scan (370–1700 m/z) at 70,000 mass resolution and up to ten concurrent MS/MS scans for the ten most intense peaks selected from each survey scan. Survey scans were acquired in profile mode and MS/MS scans were acquired in centroid mode at 17500 resolution and isolation window of 1.5 amu. AGC was set to 1 × 10⁶ for MS1 and 5 × 10⁵ and 100 ms maximum IT for MS2. Charge exclusion of 1, 2 and greater than 8 enabled with dynamic exclusion of 15 s. To analyze the cross-linked peptides we used pLink67. The raw MS data was analyzed using pLink search with the following parameters: precursor mass tolerance 50 p.p.m., fragment mass tolerance 10 p.p.m., cross-linker DSS (cross-linking sites K and protein N terminus, xlink mass-shift 138.068, monolink mass-shift 156.079), fixed modification C 57.02146, variable modification oxidized methionine, deamidation N,Q, protein N-acetyl, peptide length minimum 4 amino acids and maximum 100 amino acids per chain, peptide mass minimum 400 and maximum 10,000 Da per chain, enzyme trypsin, two missed cleavage sites per chain (four per cross-link). The data were imported on the xiNET online tool to generate crosslinking maps68. All identified crosslinks can be found in Supplementary Table 1.
SEC-MALS
The light scattering data were collected using a Superdex 200, 10/300, HR Size Exclusion Chromatography (SEC) column (GE Healthcare, Piscataway, NJ), connected to High Performance Liquid Chromatography System (HPLC), Agilent 1200, (Agilent Technologies, Wilmington, DE) equipped with an autosampler. The elution from SEC was monitored by a photodiode array (PDA) UV/VIS detector (Agilent Technologies, Wilmington, DE), differential refractometer (OPTI-Lab rEx Wyatt Corp., Santa Barbara, CA), static and dynamic, multiangle laser light scattering (LS) detector (HELEOS II with QELS capability, Wyatt Corp., Santa Barbara, CA). The SEC-UV/LS/RI system was equilibrated in buffer 25 mM Hepes pH 7.5, 500 mM NaCl, 10% glycerol, 2 mM EDTA at the flow rate of 0.5 ml/min or 1.0 ml/min. Two software packages were used for data collection and analysis: the Chemstation software (Agilent Technologies, Wilmington, DE) controlled the HPLC operation and data collection from the multi-wavelength UV/VIS detector, while the ASTRA software (Wyatt Corp., Santa Barbara, CA) collected data from the refractive index detector, the light scattering detectors, and recorded the UV trace at 280 nm sent from the PDA detector. The weight average molecular masses were determined across the entire elution profile in intervals of 1 sec from static LS measurement using ASTRA software as previously described69.
Negative-stain EM
The sample (4 μl of protein at 100–150 nM in buffer containing 25 mM HEPES-NaOH pH 7.5, 500 mM NaCl, 10% glycerol, 2 mM DTT, 5 mM EDTA) was applied to fresh, glow-discharged homemade continuous carbon grids. For the DNA-bound sample, the complex was mixed with a 25-bp hairpin substrate with 5′-TA overhang in 25 mM HEPES-NaOH pH 7.5, 100 mM NaCl, 10% glycerol, 2 mM DTT, 2 mM MgCl2. After 1-minute incubation, the grids were stained in five consecutive 40-μl drops of 2% uranyl acetate during a total of 45 seconds prior to blotting completely dry. Negatively-stained specimens were examined under an FEI Tecnai-12 TWIN electron microscope equipped with a LaB6 filament and operated at 100 kV acceleration voltage. Data were acquired using a dose of ~25 e−/Å2 at a nominal magnification of 49,000 × and binned to 4.14 Å per pixel. All images were recorded on a FEI Eagle 4k × 4k pixel camera (Thermo) utilizing LEGINON data collection software70. Particle picking, contrast transfer function estimation and phase-flipping correction were performed using EMAN71,72. Reference-free 2D methods implemented in EMAN71, and 2D maximum-likelihood classification as implemented in RELION73, were used to analyze an average of 10,000 particles for each condition. The particles were too conformationally heterogeneous to permit 3D volume reconstruction.
Spo11-oligo labeling
The procedure has been described56. Briefly, yeast cultures were harvested at the indicated time in meiosis and denatured extracts were prepared by trichloroacetic acid precipitation. Proteins were solubilized in 2% SDS, 500 mM Tris-HCl pH 8.1, 10 mM EDTA. Extracts were diluted in an equal volume of 2× IP Buffer (2% Triton X100, 30 mM Tris-HCl pH 8.1, 300 mM NaCl, 2 mM EDTA, 0.02% SDS) and Flag-tagged Spo11-oligo complexes were immunoprecipitated on agarose beads conjugated with mouse monoclonal M2 anti-Flag antibody. DNA was labeled on the beads with terminal deoxynucleotidyl transferase and [α−32P]-dCTP. After washing the beads in 1× IP buffer, proteins were eluted with LDS sample buffer and separated by SDS-PAGE. The gel was dried and developed by autoradiography. Total DSB levels were estimated from relative areas under the curves for time courses. For analysis of Spo11-oligo length, radiolabeled Spo11-oligo complexes were digested with proteinase K and deproteinized oligos were separated on a 15% TBE-UREA polyacrylamide gel.
Southern blot analysis of meiotic DSB formation
Meiotic DSB analysis by Southern blotting was performed as described74. Briefly, synchronized cultures undergoing meiosis were harvested at the indicated times. After DNA purification, 800 ng of genomic DNA was digested with PstI and separated on a 1% TBE-agarose gel. For direct comparison of break formation at GAT1 and CCT6 with genome-wide DSB maps, genomic DNA from sae2 strains were prepared in agarose plugs as described74. Plugs were equilibrated in NEB CutSmart buffer, digested with PstI-HF, and digested DNA was separated on a 0.65% TBE-agarose gel. DNA was transferred to Hybond-XL nylon membranes by vacuum transfer, hybridized with GAT1 probe (amplified with primers 5′-CGCGCTTCACATAATGCTTCTGG and 5′-TTCAGATTCAACCAATCCAGGCTC) or CCT6 probe (amplified with primers 5′-GCGTCCCGCAAGGACATTAG and 5′-TTGTGGCTAATGGTTTTGCGGTG), and developed by autoradiography.
Heteroallele recombination assays
Heteroallele recombination assays were done in diploid strains carrying the arg4-Bgl and arg4-Nsp alleles75. Three independent colonies were cultured overnight in selective dropout medium, then transferred to YPA for 13.5 hours prior to meiotic induction in 2% KOAc. After at least 6 hours in meiosis, appropriate dilutions of cultures were plated on arginine dropout medium to measure frequency of Arg+ recombinants and on YPD to measure colony forming units.
Yeast extracts and western blotting
Denaturing whole-cell extracts were prepared in10% trichloroacetic acid by agitation with glass beads. Proteins were solubilized in Laemmli sample buffer, separated by SDS-PAGE and analyzed by western blotting. Antibodies were goat polyclonal anti-LexA (1:2000, Santa Cruz), rat polyclonal anti-α-tubulin (1:5000, Bio-rad), mouse monoclonal anti-Flag M2 (1:2000, Sigma) HRP-conjugated mouse monoclonal anti-Flag M2 (1:2000, Sigma), mouse monoclonal anti-MBP (1:2000, NEB), rabbit polyclonal anti-Spo11 (1:1000, this laboratory). Secondary antibodies were used at 1:5000 dilution: IRDye 800CW goat anti-mouse IgG (LI-COR), HRP-conjugated goat anti-mouse IgG (Bio-Rad), HRP-conjugated goat anti-rabbit IgG (Bio-Rad), HRP-conjugated donkey anti-goat IgG (Santa Cruz), HRP-conjugated donkey anti-rat IgG (Abcam).
Yeast two-hybrid assays
Yeast two-hybrid vectors were transformed separately into haploid strains SKY661 and SKY662 and selected on appropriate synthetic dropout medium. Strains were mated and streaked for single diploid colonies on medium lacking tryptophan and leucine. Single colonies were grown overnight in selective medium containing 2% glucose. Cultures were diluted in fresh medium containing 2% galactose and 1% raffinose and grown until log phase (4 h). Cells were lysed and quantitative β-galactosidase assay was performed using ONPG substrate following standard protocols (Clontech Laboratories). For two-hybrid experiments in meiotic conditions, after overnight culture in selective medium with glucose, cultures were washed twice then incubated with 2% KOAc for 20 hours to induce meiosis.
Spo11-oligo sequencing and S1-seq
Processing of cell lysates for Spo11 oligo purification and sequencing library preparation were essentially as described76. Paired-end Illumina sequencing was performed by the Integrated Genomics Operation at MSKCC. Adapter clipping and mapping of reads was performed by the Bioinformatics Core Facility (MSKCC) as described33. Statistical analyses were performed using R (http://www.r-project.org/). Sequence read totals and mapping statistics are in Supplementary Table 6. Only uniquely mapping reads were analyzed. Each map was normalized to the total number of uniquely mapped reads, excluding mitochondrial DNA or the 2μ plasmid, then biological replicates were averaged. In analyses evaluating the fold change in DSB activity, the ratio was scaled according to the decrease in DSBs as measured through quantification of Spo11-oligo complexes (0.4 for F260A).
For S1-seq, yeast cultures in the sae2 background were harvested 4 hours after meiotic induction, washed with 50 mM EDTA pH 8.0 and stored at −80°C. DNA preparation in plugs and generation of sequencing libraries were done as described47. The rDNA locus was masked. In addition, to reduce background signal, a thresholding was applied, calculated from the frequency of reads in the coldest 10% of coding regions. A detailed description of the bioinformatic processing of S1-seq reads was previously provided47.
Reporting summary
Further information on experimental design is available in the Nature Research Reporting Summary linked to this article.
Code availability
Code for processing Spo11-oligo reads48,49 is available at http://cbio.mskcc.org/public/Thacker_ZMM_feedback/. Code for processing S1-seq reads47 is available at https://github.com/soccin/S1seq.
Data availability
Sequence reads and compiled Spo11-oligo and S1-seq maps were deposited at the Gene Expression Omnibus (GEO) (accession number GSE150315). Source data are available with the paper online.
Extended Data
Extended Data Fig. 1: Co-expression of core complex subunits, size exclusion chromatography and glycerol gradient sedimentation analyses of the core complex.
a, Silver-stained SDS-PAGE gels (top) and anti-Flag western blot (WB; center) of Spo11 complexes after purification on nickel resin. Absence of Rec102, Rec104, or Ski8 leads to poor solubility of Spo11. Bottom: anti-Flag western blot of lysed Sf9 cells showing Spo11 expression levels. Asterisks: C-terminal truncation of Spo11 that retains the affinity tag and interaction with Ski8. b, Size exclusion chromatography of purified core complex with and without MBP tag on Rec102. Silver-stained SDS-PAGE gels of eluted fractions are shown above, with chromatograms from absorption at 280 nm below. c, Glycerol gradient sedimentation of MBP-tagged Spo11 core complexes. The silver-stained SDS-PAGE gel shows fractions collected from the bottom of the gradient. Quantification of protein signal from two independent experiments is shown together with molecular weight markers run on a separate gradient and quantified by Bradford assay. Note: Material in the void volume (panel b) and at the bottom of the glycerol gradient (panel c) lacks Ski8, which is consistent with Ski8 being required for solubility.
Extended Data Fig. 2: 2D class averages of nsEM images with different versions of the core complex.
Core complexes without MBP or with MBP fused at the N-terminus of Rec102, Spo11 or Rec104 are shown. A cartoon of the presumed arrangement of the subunits and the position of the MBP electron density is shown. With the MBP-tagged Spo11 construct, the electron density of MBP is located at a similar position to the Rec102- or Rec104-tagged constructs. This is consistent with the observation that the N-terminus of Spo11 frequently crosslinks with Rec104 (pink lines in Fig. 2a), suggesting that the N-terminus of Spo11, absent from the structural model, is flexible and perhaps directly contacts Rec102/Rec104. The observation of a single MBP density for all three subunits tested provides further support for the 1:1:1:1 stoichiometry of the core complex. Complexes with MBP-tagged Ski8 were not well behaved and could not be purified.
Extended Data Fig. 3: The interaction between Ski8 and Spo11 is important for the integrity of the complex.
SDS-PAGE analysis of core complexes purified with wild-type Spo11 or the Ski8-interaction deficient Q376A mutant. Equivalent percentages of the total protein purified from similar amounts of Sf9 extract were loaded in each lane, demonstrating the poor yield when the Spo11–Ski8 interaction is compromised.
Extended Data Fig. 4: Intramolecular crosslinks within Ski8 validate the XL-MS results.
a, Ski8 intramolecular crosslinks modeled on the structure of Ski8. The histogram shows the frequency of XL-MS events as a function of distance between the α-carbons (Cα) of the crosslinked lysines (red spheres). The crosslinkable limit of DSS is 27.4 Å. b, Ski8 intramolecular crosslinks modeled on the core complex show that the crosslinked residues are away from the interaction surface with Spo11.
Extended Data Fig. 5: DNA-binding properties of the core complex.
a, Competition experiment using a labeled 25-bp hairpin substrate with 5′-TA overhang in the presence of unlabeled substrates with various overhang configurations. EMSA gel bands of bound labeled substrate are shown. Mean and ranges from two experiments are plotted. The substrate with a 2-nucleotide 5′ overhang is the most effective competitor. b, Competition experiment using a labeled 25-bp hairpin substrate with 5′-TA overhang in the presence of unlabeled competitor substrates with or without 5’ phosphate. Error bars represent ranges from two experiments. c, EMSA of core complex binding to 400-bp mini-circles in the presence or absence of Mg2+. For the top panel, binding reactions contained 5 mM Mg2+ and the gel and electrophoresis buffer contained 0.5 mM Mg2+. For the bottom panel, the binding reactions, gel, and buffer contained 1 mM EDTA.
Extended Data Fig. 6: Affinity purification of different combinations of tagged complexes and comparison of DNA-binding activities.
a, Purification of core complexes that carry combinations of HisFlag (H) and MBP (M) tags on different subunits. All combinations yielded soluble Spo11 (western blot, bottom panel). While the Coomassie-stained gel shown in Fig. 1a suggests that Rec104 may be sub-stoichiometric, the similar relative intensities between MBP-tagged Rec102 and Rec104 in the silver-stained gel (where the MBP tag makes up the majority of each tagged protein’s mass) and anti-MBP western blot indicate that the two subunits have the same stoichiometry (compare lanes 1 with 2, and 6 with 7). The difficulty in purifying soluble Spo11-containing complexes when Rec104 is absent (Extended Data Fig. 1a) further bolsters the inference that the purified core complexes (nearly) always include Rec104. b, Comparison of the DNA-binding activity of core complexes that carried affinity tags on different subunits. All tagged complexes assayed had similar DNA-binding activities.
Extended Data Fig. 7: In vivo analyses of Spo11 DNA-binding mutants.
a, Southern blot analysis of meiotic DSB formation at the CCT6 hotspot in strains expressing wild-type (WT) Spo11 or the K173A or R344A mutant proteins. b, Quantification of DSB formation at the CCT6 hotspot. Error bars represent the range from two experiments. c, Meiotic progression. MI + MII indicates the fraction of cells that have undergone the first or both meiotic divisions, as scored by DAPI staining.
Extended Data Fig. 8: Genome-wide analyses of DSB formation in the F260A mutant.
a, Relative enrichment of the short Spo11-oligo class in F260A. Deproteinized, labeled oligos were separated by denaturing gel electrophoresis. Lane profiles are shown on the right. A 10-nt ladder is plotted in grey. b, c. Reproducibility of DSB maps. Correlations of Spo11-oligo counts (b) and S1-seq counts (c) within hotspots between two biological replicates of Spo11 wild type and F260A are plotted. Pearson’s r between datasets is indicated. d, Changed DSB distribution in F260A is not correlated with hotspot strength. Spo11 hotspots were binned according to oligo counts in wild type. Boxplots show the distribution of Pearson’s r values comparing within-hotspot Spo11-oligo distributions between wild type and F260A, as in Fig. 8e. The thick horizontal bars are medians, box edges are upper and lower quartiles, whiskers indicate values within 1.5 fold of interquartile range, and points are outliers. e, Base composition in S1-seq maps. The big spike in the G map at +2 is partially because this is the complement of the preferred C 5′ of the scissile phosphate, but it is also the first base of the ligation junction (and end-most base after S1 digestion), so the degree to which there is enrichment to the right but not left of the dyad axis probably reflects a modest end-bias in library prep in S1-seq. f, Spo11 preference at the scissile phosphate (dinucleotide indicated by the red circle).
Extended Data Fig. 9: Possible relation of Rec104 to a GHKL fold.
a, Secondary structure predictions for Rec104 and the GHKL domain of Topo VIB were generated by PsiPred63. b, Rec104 model generated by iTasser (green) overlaid on Topo VI. The transducer domain of Topo VI is yellow, the GHKL domain is grey.
Extended Data Fig. 10: Model of Spo11-induced break formation.
a, AFM experiments suggest a model where the core complex binds a DNA duplex, bends it, then traps a second duplex. Perhaps DNA cleavage happens in the context of a trapped DNA junction, similar to Topo VI. After cleavage, Spo11 remains covalently attached to the DNA end through covalent and non-covalent interactions. b, Model of assembly of the DSB machinery. DNA-driven condensation by Rec114–Mei4–Mer2 is proposed to provide a platform that recruits the core complex, where it engages its DNA substrate58. A hypothetical arrangement is shown where each dimer of core complexes captures a pair of DNA duplexes, which, for example, could be sister chromatids. c, Depletion of long oligos in Spo11 mutants with reduced DNA-binding activity is consistent with a model57 where long oligos arise from occlusion of the DNA substrate by multiple Spo11 complexes that reduce access to MRX/Sae2.
Supplementary Material
Acknowledgements
We thank M. Brendel and the Molecular Cytology core facility at MSKCC for performing the AFM experiments. We thank R. Hendrickson, E. Chang and the Microchemistry and Proteomics core facility at MSKCC for assistance with the XL-MS experiments. We thank K. Liu (Keeney lab) for discussions. MSKCC core facilities are supported by NCI Cancer Center support grant P30 CA08748. We thank E. Folta-Stogniew and the Biophysics Resource of Keck Facility at Yale University for the SEC-MALS experiments. The SEC-LS/UV/RI instrumentation was supported by NIH Award Number 1S10RR023748–01. EPM was supported in part by a Helen Hay Whitney Foundation fellowship. Work in the SK lab was supported principally by the Howard Hughes Medical Institute and in part by NIH grant R35 GM118092 (S.K.). Work in the JMB lab was funded by NCI grant R01-CA0777373 (J.M.B.). CCB was supported in part by funding from the European Research Council under the European Union’s Horizon 2020 research and innovation program (ERC grant agreement 802525) and from the Fonds National de la Recherche Scientifique (FNRS MIS-Ulysse grant F.6002.20) (C.C.B.).
Footnotes
Competing Interests: The authors declare no competing interests.
References
- 1.Bergerat A et al. An atypical topoisomerase II from Archaea with implications for meiotic recombination. Nature 386, 414–7 (1997). [DOI] [PubMed] [Google Scholar]
- 2.Keeney S, Giroux CN & Kleckner N Meiosis-specific DNA double-strand breaks are catalyzed by Spo11, a member of a widely conserved protein family. Cell 88, 375–84 (1997). [DOI] [PubMed] [Google Scholar]
- 3.Corbett KD, Benedetti P & Berger JM Holoenzyme assembly and ATP-mediated conformational dynamics of topoisomerase VI. Nat Struct Mol Biol 14, 611–9 (2007). [DOI] [PubMed] [Google Scholar]
- 4.Graille M et al. Crystal structure of an intact type II DNA topoisomerase: insights into DNA transfer mechanisms. Structure 16, 360–70 (2008). [DOI] [PubMed] [Google Scholar]
- 5.Buhler C, Lebbink JH, Bocs C, Ladenstein R & Forterre P DNA topoisomerase VI generates ATP-dependent double-strand breaks with two-nucleotide overhangs. J Biol Chem 276, 37215–22 (2001). [DOI] [PubMed] [Google Scholar]
- 6.Lam I & Keeney S Mechanism and regulation of meiotic recombination initiation. Cold Spring Harb Perspect Biol 7, a016634 (2014). [DOI] [PMC free article] [PubMed] [Google Scholar]
- 7.Neale MJ, Pan J & Keeney S Endonucleolytic processing of covalent protein-linked DNA double-strand breaks. Nature 436, 1053–7 (2005). [DOI] [PMC free article] [PubMed] [Google Scholar]
- 8.Symington LS End resection at double-strand breaks: mechanism and regulation. Cold Spring Harb Perspect Biol 6(2014). [DOI] [PMC free article] [PubMed] [Google Scholar]
- 9.Miyoshi T et al. A central coupler for recombination initiation linking chromosome architecture to S phase checkpoint. Mol Cell 47, 722–33 (2012). [DOI] [PubMed] [Google Scholar]
- 10.Vrielynck N et al. A DNA topoisomerase VI-like complex initiates meiotic recombination. Science 351, 939–43 (2016). [DOI] [PubMed] [Google Scholar]
- 11.Kumar R, Bourbon HM & de Massy B Functional conservation of Mei4 for meiotic DNA double-strand break formation from yeasts to mice. Genes Dev 24, 1266–80 (2010). [DOI] [PMC free article] [PubMed] [Google Scholar]
- 12.Stanzione M et al. Meiotic DNA break formation requires the unsynapsed chromosome axis-binding protein IHO1 (CCDC36) in mice. Nat Cell Biol 18, 1208–1220 (2016). [DOI] [PMC free article] [PubMed] [Google Scholar]
- 13.Robert T et al. The TopoVIB-Like protein family is required for meiotic DNA double strand break formation. Science (2016). [DOI] [PubMed] [Google Scholar]
- 14.Tesse S et al. Asy2/Mer2: an evolutionarily conserved mediator of meiotic recombination, pairing, and global chromosome compaction. Genes Dev 31, 1880–1893 (2017). [DOI] [PMC free article] [PubMed] [Google Scholar]
- 15.Keeney S Spo11 and the formation of DNA double-strand breaks in meiosis. Genome Dyn Stab 2, 81–123 (2008). [DOI] [PMC free article] [PubMed] [Google Scholar]
- 16.Malone RE et al. Isolation of mutants defective in early steps of meiotic recombination in the yeast Saccharomyces cerevisiae. Genetics 128, 79–88 (1991). [DOI] [PMC free article] [PubMed] [Google Scholar]
- 17.Kee K & Keeney S Functional interactions between SPO11 and REC102 during initiation of meiotic recombination in Saccharomyces cerevisiae. Genetics 160, 111–22 (2002). [DOI] [PMC free article] [PubMed] [Google Scholar]
- 18.Jiao K, Salem L & Malone R Support for a meiotic recombination initiation complex: interactions among Rec102p, Rec104p, and Spo11p. Mol Cell Biol 23, 5928–38 (2003). [DOI] [PMC free article] [PubMed] [Google Scholar]
- 19.Arora C, Kee K, Maleki S & Keeney S Antiviral protein Ski8 is a direct partner of Spo11 in meiotic DNA break formation, independent of its cytoplasmic role in RNA metabolism. Mol Cell 13, 549–59 (2004). [DOI] [PubMed] [Google Scholar]
- 20.Kee K, Protacio RU, Arora C & Keeney S Spatial organization and dynamics of the association of Rec102 and Rec104 with meiotic chromosomes. EMBO J 23, 1815–24 (2004). [DOI] [PMC free article] [PubMed] [Google Scholar]
- 21.Prieler S, Penkner A, Borde V & Klein F The control of Spo11’s interaction with meiotic recombination hotspots. Genes Dev 19, 255–69 (2005). [DOI] [PMC free article] [PubMed] [Google Scholar]
- 22.Sasanuma H et al. Meiotic association between Spo11 regulated by Rec102, Rec104 and Rec114. Nucleic Acids Res 35, 1119–33 (2007). [DOI] [PMC free article] [PubMed] [Google Scholar]
- 23.Madrona AY & Wilson DK The structure of Ski8p, a protein regulating mRNA degradation: Implications for WD protein structure. Protein Sci 13, 1557–65 (2004). [DOI] [PMC free article] [PubMed] [Google Scholar]
- 24.Cheng Z, Liu Y, Wang C, Parker R & Song H Crystal structure of Ski8p, a WD-repeat protein with dual roles in mRNA metabolism and meiotic recombination. Protein Sci 13, 2673–84 (2004). [DOI] [PMC free article] [PubMed] [Google Scholar]
- 25.Halbach F, Reichelt P, Rode M & Conti E The yeast ski complex: crystal structure and RNA channeling to the exosome complex. Cell 154, 814–26 (2013). [DOI] [PubMed] [Google Scholar]
- 26.O’Reilly FJ & Rappsilber J Cross-linking mass spectrometry: methods and applications in structural, molecular and systems biology. Nat Struct Mol Biol 25, 1000–1008 (2018). [DOI] [PubMed] [Google Scholar]
- 27.Corbett KD, Schoeffler AJ, Thomsen ND & Berger JM The structural basis for substrate specificity in DNA topoisomerase IV. J Mol Biol 351, 545–61 (2005). [DOI] [PubMed] [Google Scholar]
- 28.Timsit Y Local sensing of global DNA topology: from crossover geometry to type II topoisomerase processivity. Nucleic Acids Res 39, 8665–76 (2011). [DOI] [PMC free article] [PubMed] [Google Scholar]
- 29.Alonso-Sarduy L, Roduit C, Dietler G & Kasas S Human topoisomerase II-DNA interaction study by using atomic force microscopy. FEBS Lett 585, 3139–45 (2011). [DOI] [PubMed] [Google Scholar]
- 30.Wendorff TJ & Berger JM Topoisomerase VI senses and exploits both DNA crossings and bends to facilitate strand passage. Elife 7(2018). [DOI] [PMC free article] [PubMed] [Google Scholar]
- 31.Liu J, Wu TC & Lichten M The location and structure of double-strand DNA breaks induced during yeast meiosis: evidence for a covalently linked DNA-protein intermediate. EMBO J 14, 4599–608 (1995). [DOI] [PMC free article] [PubMed] [Google Scholar]
- 32.Murakami H & Nicolas A Locally, meiotic double-strand breaks targeted by Gal4BD-Spo11 occur at discrete sites with a sequence preference. Mol Cell Biol 29, 3500–16 (2009). [DOI] [PMC free article] [PubMed] [Google Scholar]
- 33.Pan J et al. A hierarchical combination of factors shapes the genome-wide topography of yeast meiotic recombination initiation. Cell 144, 719–31 (2011). [DOI] [PMC free article] [PubMed] [Google Scholar]
- 34.Du Q, Kotlyar A & Vologodskii A Kinking the double helix by bending deformation. Nucleic Acids Res 36, 1120–8 (2008). [DOI] [PMC free article] [PubMed] [Google Scholar]
- 35.Diaz RL, Alcid AD, Berger JM & Keeney S Identification of residues in yeast Spo11p critical for meiotic DNA double-strand break formation. Mol Cell Biol 22, 1106–15 (2002). [DOI] [PMC free article] [PubMed] [Google Scholar]
- 36.Miller G & Hahn S A DNA-tethered cleavage probe reveals the path for promoter DNA in the yeast preinitiation complex. Nat Struct Mol Biol 13, 603–10 (2006). [DOI] [PMC free article] [PubMed] [Google Scholar]
- 37.Claeys Bouuaert C & Keeney S Distinct DNA-binding surfaces in the ATPase and linker domains of MutLgamma determine its substrate specificities and exert separable functions in meiotic recombination and mismatch repair. PLoS Genet 13, e1006722 (2017). [DOI] [PMC free article] [PubMed] [Google Scholar]
- 38.Marston AL & Wassmann K Multiple duties for spindle assembly checkpoint kinases in meiosis. Front Cell Dev Biol 5, 109 (2017). [DOI] [PMC free article] [PubMed] [Google Scholar]
- 39.Nichols MD, DeAngelis K, Keck JL & Berger JM Structure and function of an archaeal topoisomerase VI subunit with homology to the meiotic recombination factor Spo11. EMBO J 18, 6177–88 (1999). [DOI] [PMC free article] [PubMed] [Google Scholar]
- 40.Baudat F & Nicolas A Clustering of meiotic double-strand breaks on yeast chromosome III. Proc Natl Acad Sci U S A 94, 5213–8 (1997). [DOI] [PMC free article] [PubMed] [Google Scholar]
- 41.Gerton JL et al. Global mapping of meiotic recombination hotspots and coldspots in the yeast Saccharomyces cerevisiae. Proc Natl Acad Sci U S A 97, 11383–90 (2000). [DOI] [PMC free article] [PubMed] [Google Scholar]
- 42.Buhler C, Borde V & Lichten M Mapping meiotic single-strand DNA reveals a new landscape of DNA double-strand breaks in Saccharomyces cerevisiae. PLoS Biol 5, e324 (2007). [DOI] [PMC free article] [PubMed] [Google Scholar]
- 43.Blitzblau HG, Bell GW, Rodriguez J, Bell SP & Hochwagen A Mapping of meiotic single-stranded DNA reveals double-stranded-break hotspots near centromeres and telomeres. Curr Biol 17, 2003–12 (2007). [DOI] [PubMed] [Google Scholar]
- 44.Wu TC & Lichten M Meiosis-induced double-strand break sites determined by yeast chromatin structure. Science 263, 515–8 (1994). [DOI] [PubMed] [Google Scholar]
- 45.de Massy B Initiation of meiotic recombination: how and where? Conservation and specificities among eukaryotes. Annu Rev Genet 47, 563–99 (2013). [DOI] [PubMed] [Google Scholar]
- 46.Mimitou EP, Yamada S & Keeney S A global view of meiotic double-strand break end resection. Science 355, 40–45 (2017). [DOI] [PMC free article] [PubMed] [Google Scholar]
- 47.Mimitou EP & Keeney S S1-seq assay for mapping processed dna ends. Methods Enzymol 601, 309–330 (2018). [DOI] [PMC free article] [PubMed] [Google Scholar]
- 48.Thacker D, Mohibullah N, Zhu X & Keeney S Homologue engagement controls meiotic DNA break number and distribution. Nature 510, 241–6 (2014). [DOI] [PMC free article] [PubMed] [Google Scholar]
- 49.Mohibullah N & Keeney S Numerical and spatial patterning of yeast meiotic DNA breaks by Tel1. Genome Res 27, 278–288 (2017). [DOI] [PMC free article] [PubMed] [Google Scholar]
- 50.Claeys Bouuaert C & Keeney S DNA. Breaking DNA. Science 351, 916–7 (2016). [DOI] [PubMed] [Google Scholar]
- 51.Yang J & Zhang Y I-TASSER server: new development for protein structure and function predictions. Nucleic Acids Res 43, W174–81 (2015). [DOI] [PMC free article] [PubMed] [Google Scholar]
- 52.Bates AD, Berger JM & Maxwell A The ancestral role of ATP hydrolysis in type II topoisomerases: prevention of DNA double-strand breaks. Nucleic Acids Res 39, 6327–39 (2011). [DOI] [PMC free article] [PubMed] [Google Scholar]
- 53.Evans DH, Li YF, Fox ME & Smith GR A WD repeat protein, Rec14, essential for meiotic recombination in Schizosaccharomyces pombe. Genetics 146, 1253–64 (1997). [DOI] [PMC free article] [PubMed] [Google Scholar]
- 54.Tessé S, Storlazzi A, Kleckner N, Gargano S & Zickler D Localization and roles of Ski8p in Sordaria macrospora meiosis and delineation of three mechanistically distinct steps of meiotic homolog juxtaposition. Proceedings of the National Academy of Sciences U.S.A 100, 12865–12870 (2003). [DOI] [PMC free article] [PubMed] [Google Scholar]
- 55.Jolivet S, Vezon D, Froger N & Mercier R Non conservation of the meiotic function of the Ski8/Rec103 homolog in Arabidopsis . Genes Cells 11, 615–22 (2006). [DOI] [PubMed] [Google Scholar]
- 56.Neale MJ & Keeney S End-labeling and analysis of Spo11-oligonucleotide complexes in Saccharomyces cerevisiae. Methods Mol Biol 557, 183–95 (2009). [DOI] [PMC free article] [PubMed] [Google Scholar]
- 57.Johnson D et al. Concerted cutting by Spo11 illuminates DNA break mechanisms and initiates gap repair during meiosis. bioRxiv, 2019.12.18.881268 (2019). [Google Scholar]
- 58.Claeys Bouuaert C, Pu S, Wang J, Patel DJ & Keeney S DNA-dependent macromolecular condensation drives self-assembly of the meiotic DNA break machinery. bioRxiv (2020). [Google Scholar]
- 59.Paiano J et al. ATM and PRDM9 regulate SPO11-bound recombination intermediates during meiosis. Nat Commun 11, 857 (2020). [DOI] [PMC free article] [PubMed] [Google Scholar]
- 60.Yamada S et al. Molecular structures and mechanisms of DNA break processing in mouse meiosis. Genes Dev 34, 806–818 (2020). [DOI] [PMC free article] [PubMed] [Google Scholar]
Methods-only References
- 61.Kugou K et al. Rec8 guides canonical Spo11 distribution along yeast meiotic chromosomes. Mol Biol Cell 20, 3064–76 (2009). [DOI] [PMC free article] [PubMed] [Google Scholar]
- 62.Maleki S, Neale MJ, Arora C, Henderson KA & Keeney S Interactions between Mei4, Rec114, and other proteins required for meiotic DNA double-strand break formation in Saccharomyces cerevisiae. Chromosoma 116, 471–86 (2007). [DOI] [PMC free article] [PubMed] [Google Scholar]
- 63.McGuffin LJ, Bryson K & Jones DT The PSIPRED protein structure prediction server. Bioinformatics 16, 404–5 (2000). [DOI] [PubMed] [Google Scholar]
- 64.Richards FM Calculation of molecular volumes and areas for structures of known geometry. Methods Enzymol 115, 440–64 (1985). [DOI] [PubMed] [Google Scholar]
- 65.Sebastiaan Winkler G et al. Isolation and mass spectrometry of transcription factor complexes. Methods 26, 260–9 (2002). [DOI] [PubMed] [Google Scholar]
- 66.Erdjument-Bromage H et al. Examination of micro-tip reversed-phase liquid chromatographic extraction of peptide pools for mass spectrometric analysis. J Chromatogr A 826, 167–81 (1998). [DOI] [PubMed] [Google Scholar]
- 67.Yang B et al. Identification of cross-linked peptides from complex samples. Nat Methods 9, 904–6 (2012). [DOI] [PubMed] [Google Scholar]
- 68.Combe CW, Fischer L & Rappsilber J xiNET: cross-link network maps with residue resolution. Mol Cell Proteomics 14, 1137–47 (2015). [DOI] [PMC free article] [PubMed] [Google Scholar]
- 69.Folta-Stogniew E & Williams KR Determination of molecular masses of proteins in solution: Implementation of an HPLC size exclusion chromatography and laser light scattering service in a core laboratory. J Biomol Tech 10, 51–63 (1999). [PMC free article] [PubMed] [Google Scholar]
- 70.Suloway C et al. Automated molecular microscopy: the new Leginon system. J Struct Biol 151, 41–60 (2005). [DOI] [PubMed] [Google Scholar]
- 71.Ludtke SJ, Baldwin PR & Chiu W EMAN: semiautomated software for high-resolution single-particle reconstructions. J Struct Biol 128, 82–97 (1999). [DOI] [PubMed] [Google Scholar]
- 72.Tang G et al. EMAN2: an extensible image processing suite for electron microscopy. J Struct Biol 157, 38–46 (2007). [DOI] [PubMed] [Google Scholar]
- 73.Scheres SH RELION: implementation of a Bayesian approach to cryo-EM structure determination. J Struct Biol 180, 519–30 (2012). [DOI] [PMC free article] [PubMed] [Google Scholar]
- 74.Murakami H, Borde V, Nicolas A & Keeney S Gel electrophoresis assays for analyzing DNA double-strand breaks in Saccharomyces cerevisiae at various spatial resolutions. Methods Mol Biol 557, 117–42 (2009). [DOI] [PMC free article] [PubMed] [Google Scholar]
- 75.Nicolas A, Treco D, Schultes NP & Szostak JW An initiation site for meiotic gene conversion in the yeast Saccharomyces cerevisiae. Nature 338, 35–9 (1989). [DOI] [PubMed] [Google Scholar]
- 76.Lam I, Mohibullah N & Keeney S Sequencing Spo11 oligonucleotides for mapping meiotic DNA double-strand breaks in yeast. Methods Mol Biol 1471, 51–98 (2017). [DOI] [PubMed] [Google Scholar]
Associated Data
This section collects any data citations, data availability statements, or supplementary materials included in this article.
Supplementary Materials
Data Availability Statement
Sequence reads and compiled Spo11-oligo and S1-seq maps were deposited at the Gene Expression Omnibus (GEO) (accession number GSE150315). Source data are available with the paper online.


