

Abstract
Diversity of neural crest derivatives has been studied with a variety of approaches during embryonic development. In mammals Cre-LoxP lineage tracing is a robust means to fate map neural crest relying on cre driven from regulatory elements of early neural crest genes. Sox10 is an essential transcription factor for normal neural crest development. A variety of efforts have been made to label neural crest derivatives using partial Sox10 regulatory elements to drive cre expression. To date published Sox10-cre lines have focused primarily on lineage tracing in specific tissues or during early fetal development. We describe two new Sox10-cre BAC transgenes, constitutive (cre) and inducible (cre/ERT2), that contain the complete repertoire of Sox10 regulatory elements. We present a thorough expression profile of each, identifying a few novel sites of Sox10 expression not captured by other neural crest cre drivers. Comparative mapping of expression patterns between the Sox10-cre and Sox10-cre/ERT2 transgenes identified a narrow temporal window in which Sox10 expression is present in mesenchymal derivatives prior to becoming restricted to neural elements during embryogenesis. In more caudal structures, such as the intestine and lower urinary tract, our Sox10-cre BAC transgene appears to be more efficient in labeling neural crest-derived cell types than Wnt1-cre. The analysis reveals consistent expression of Sox10 in non-neural crest derived glandular epithelium, including salivary, mammary, and urethral glands of adult mice. These Sox10-cre and Sox10-cre/ERT2 transgenic lines are verified tools that will enable refined temporal and cell-type specific lineage analysis of neural crest derivatives as well as glandular tissues that rely on Sox10 for proper development and function.
Keywords: Neural crest, Sox10, BAC transgene, Enteric nervous system, Lower urinary tract, Glandular epithelium, Cre
1. Introduction
Our understanding of the enormous diversity of cell types that derive from the neural crest has arisen from multiple complementary approaches applied during study of developing embryos. These efforts have led to the realization that the neural crest generates craniofacial bones and cartilage, melanocytes, peripheral neurons, and glia, as well as a few instances of pericytes in some organs. Diverse neural crest derivatives were initially recognized by transplantation studies performed between quail donors and chick hosts (Le Douarin, 1973; Le Douarin and Dupin, 2018). These early studies were followed by dye labeling and in ovo electroporation in chicks that have generated extensive information on early neural crest migration (Kulesa and Fraser, 1998; McLennan and Kulesa, 2019; Stark et al., 2008). Similarly, real time imaging of transgene expression in zebrafish has been used to monitor and interrogate gene function during development of neural crest lineages (Ballim et al., 2019). However, analysis of neural crest derivatives in the mouse has relied primarily on fate mapping Reviewed by (Debbache et al., 2018) because intrauterine development makes manipulation of embryos for study of neural crest challenging.
The combinatorial genetic system of Cre-LoxP has been used to circumvent challenges associated with intrauterine development and map cell types resulting from neural crest lineages in the mouse. In this approach, expression of Cre protein from a “driver” transgene or knock-in allele results in recombination between two LoxP sites at a separate locus that commonly leads to excision of a stop cassette and thus expression of a “reporter” gene such as LacZ or a fluorescent molecule (e.g., YFP or tdTomato; (Madisen et al., 2015; Madisen et al., 2010)). The permanent conversion of the reporter from the non-expressed to the expressed state indelibly marks cells expressing the driver allele and subsequently labels all the progeny of that cell even after the original driver gene is silenced and Cre protein is no longer present. Strategies that have harnessed the regulatory regions of genes that are expressed either in pre-migratory or migratory neural crest to drive expression of Cre protein have been essential to the success of these approaches in the mouse.
Sox10 is one gene that has been harnessed for cre-LoxP lineage tracing of neural crest based on its high expression in early stages of neural crest migration and sustained expression in migrating progenitors as they disperse throughout the embryo (Kuhlbrodt et al., 1998). Sox10 expression is first detected in neural crest at 8 days post coitus (dpc) in fetal mice and is maintained at high levels in peripheral glia and oligodendrocytes, with lower levels in adult melanocytes (Wong et al., 2006). Several strategies have previously integrated cre within small driver constructs that contain portions of Sox10 regulatory regions (He and Soriano, 2015; Simon et al., 2012; Stine et al., 2009) or that have integrated cre within larger constructs spanning the Sox10 locus in an effort to capture long range regulatory regions (Laranjeira et al., 2011; Matsuoka et al., 2005; McKenzie et al., 2014). While many of these lines produce labeling of early neural crest, as would be expected, their analysis was restricted to fetal stages or focused on Sox10-derivatives in specific tissues.
In the present study, we report a rigorous analysis of novel constitutive-expressing Sox10-cre and inducible Sox10-cre/ERT2 lines across many tissues and developmental stages. We assess resulting reporter expression in fetal, early postnatal, and adult mice through crosses with ROSA reporter lines and detection of cre via immunohistochemistry. We find these cre lines faithfully mirror Sox10 expression in numerous known neural crest derivatives and identify novel neural crest labeling of the thymic fat pad. Our comparative analysis between Sox10-cre and Sox10-cre/ERT2 lines in fetal stages indicates that Sox10 expression in neural crest progenitors destined to become mesenchymal tissue is extinguished relatively rapidly while expression of Sox10 is maintained over a longer developmental interval in neuronal-glial lineages. The inducible Sox10-cre/ERT2 line described here results in tightly regulated nuclear expression of Cre, with maximal nuclear localization at 18–24 h post induction. We show that this cre/ERT2 transgenic line can be applied to specifically label enteric glia independent of enteric neurons in adult animals. During our analysis of transgene expression, we fortuitously observed that crossing cre lines with a R26RLacZ reporter provided easier visualization in whole embryos, whereas a tdTomato reporter was far superior in providing fine cellular detail within tissues at multiple stages. When comparing Sox10 cre lines to other neural crest specific cre drivers like Wnt1-Cre reporter (Danielian et al., 1998), we observed that our Sox10-cre reporter appears to be more efficient in labeling cells of the enteric ganglia and pelvic ganglia of the lower urinary tract. We also present a thorough analysis of Sox10 expression in non-neural crest derived glandular structures and offer that these cre driver lines can be applied for cell-type specific and temporal manipulation of these tissues.
In summary, the complementary genetic tools, Sox10-cre and Sox10-cre/ERT2 transgenic lines, presented here can be used early in development for tracing derivatives of the neural crest and manipulating these progenitors. Our analysis across multiple stages and into adulthood reveals that these lines can be used for manipulation and lineage labeling of neural crest lineages in the developing embryo as well as for manipulation of mature glia and some glandular cell types in adult tissues.
2. Material and methods
2.1. Animal husbandry
The Institutional Animal Care and Use Committee at Vanderbilt University Medical Center approved all animal procedures. Mice carrying the Tg(Sox10-cre)1Sout (RRID: MGI:5897484) and Tg(Sox10-cre/ERT2)1Sout (RRID: MGI:6201041) transgenic alleles, hereafter referred to as Sox10-cre and Sox10-cre/ERT2BAC transgenics, respectively, were derived by microinjection of (C57BL/6J X SJL) F2 eggs and subsequently maintained by backcrosses to C3HeB/FeJ stocks (Jackson Laboratory Stock#658) for more than 20 generations. For lineage analyses, mice carrying cre activity reporter alleles B6.129S-Gt(ROSA)26Sortm1Sor (Jackson Stock# 2073; RRID: MGI:1890203) or B6.Cg-Gt(ROSA)26Sortm9(CAG-tdTomato/Hze/J (Jackson Stock# 7914; RRID: MGI:3809523), hereafter referred to as R26RlacZ and ROSATom, respectively, were crossed with the Sox10-cre and Sox10-cre/ERT2 lines. Crosses of ROSA reporters with the Wnt1-cre transgenic line (RRID: MGI:2386570, Danielian et al., 1998) were used for comparison with known neural crest derivatives. Timed matings were set to obtain staged mouse fetuses, designating the morning of plug formation as 0.5 days post coitum (dpc). The staging of fetuses was confirmed by examination of fore and hind limbs in comparison to published standards (Kaufman, 1995). All animals had access to Rodent Diet 5LOD-irradiated chow (Purina) ad libitum. Genotyping was performed using primers indicated in Table 1.
Table 1.
Genotyping primers used for mouse lines in this study.
| Genotype | 5′ to 3′ Sequence | PCR Parameters | Expected Product |
|---|---|---|---|
| Sox10-cre and Sox10-cre/ERT2 |
Sp6 Forward: GTTTTTTGCGATCTGCCGTTTC Sp6 Reverse: GGCACTTTCATGTTATCTGAGG |
94°C, 5 min; 35 cycles of: (94°C, 30 s; 55°C, 30s, ramp 0.5C/s to 72°C; 72°C, 30 s, ramp 0.5°C/s to 94°C); 72°C, 10 min as above | 227bp |
|
T7 Forward: TCGAGCTTGACATTGTAGGAC T7 Reverse: AAGAGCAAGCCTTGGAACTG |
as above | 202bp | |
| Sox10-cre |
Internal Forward: GCGGCATGGTGCAAGTTGAAT Internal Reverse: CGTTCACCGGCATCAACGTTT |
as above | 400bp |
| Sox10-cre/ERT2 |
Internal Forward: ATTCTCCCACCGTCAGTACG Internal Reverse: CGTTTTCTGAGCATACCTGGA |
94°C, 5 min; 35 cycles of: (92°C, 30 s; 55°C, 30s, ramp 0.5C/s to 72°C; 72°C, 30 s, ramp 0.5°C/s to 92°C); 72°C, 10 min | 472bp |
| Wnt1-cre |
WNT-CRE F: ATT CTC CCA CCG TCA GTA CG WNT1-CRE R: CGT TTT CTG AGC ATA CCT GGA |
94°C, 5 min; 35 cycles of: (94°C, 30 s; 55°C, 1 m, ramp 0.5C/s to 72°C; 72°C, 1 m, ramp 0.5°C/s to 94°C); 72°C, 5 min | 475bp |
2.2. Generation of the Sox10-cre and Sox10-cre/ERT2 constructs, identification of founders, and genotyping
The Sox10-cre and Sox10-cre/ERT2 BAC targeting constructs were made as diagrammed in Fig. 1A, using established procedures (Boyle et al., 2008; Deal et al., 2006). Briefly, EL250 Escherichia coli (Lee et al., 2001) were transformed with a modified Sox10WT28O11 BAC (Sox10WT28O11 BAC + Zeo + Kan) from which the LoxP sites had been removed. The LoxP and LoxP511 sites in the Sox10WT28O11 BAC were replaced with kanamycin and zeocin cassettes, respectively, to avoid self-excision of the construct during cre expression. Subsequently, a cre sequence derived from pBS/RIP-cre-hGH (gift of Dr. Mark Magnuson) was inserted to generate 5′Sox10-cre FRT-tet-FRT3′Sox10 pCRII, a targeting vector containing homologous arms and the cre FRT-tet-FRT3′Sox10 targeting sequence, that was then linearized and electroporated into EL250 bacteria containing the modified Sox10WT28O11 BAC. This targeting construct does not remove any regions of the Sox10 locus upon integration and thus maintains all Sox10 exons, introns, and regulatory regions (Deal et al., 2006). Successful targeted homologous recombination was first identified by screening for tetracycline resistant colonies, confirmed by PCR of individual clones, and verified by sequencing across integration junctions. Removal of the tetracycline cassette was achieved by L-arabinose induction of Flp recombinase, and restoration of tetracycline sensitivity was confirmed by replica plating.
Fig. 1. BAC modification strategy to accomplish Cre lineage labeling of derivatives from Sox10+ progenitors.

(A) Schematic diagram of Sox10-cre generic targeting vector and homologous recombination into a wild-type Sox10 BAC depicts Sox10 exons (black rectangles), initiator ATG (green), and Cre driver (blue) followed by stop codon and polyA signal (red). Sox10 homology arms (each approximately 500 bp) are shown on either side of the targeting cassette. Excision of the tetracycline resistance cassette (TetR; yellow), which was flanked by FRT sites (gray ovals), was accomplished by transient expression of Flp recombinase in bacteria to derive the final Sox10-cre BAC transgene shown. Homologous integration of kanamycin and zeocin cassettes were used to ablate the LoxP and LoxP511 sites, respectively (pink triangles), that flanked the BAC genomic insert to prevent deletion of the integrated transgene array upon expression of Cre in vivo. (B) Lateral images of 14.5 dpc whole-mount β-galactosidase-stained embryos with the recombined R26RLacZ allele reveal the overall distribution of Cre expression. Sox10-cre transgenics constitutively express Cre and require no induction, while tamoxifen administration at 9.5 dpc in Sox10-cre/ERT2 transgenics is used to induce Cre/ERT2 translocation to the nucleus. Abbreviations: drg, dorsal root ganglia; f, face; i, intestine; lb, limb; s, stomach; scc, semicircular canal; tg, trigeminal ganglia.
Construction of the Sox10-cre/ERT2 BAC targeting sequence employed an analogous procedure utilizing the pcre/ERT2 plasmid (6089 bp (Feil et al., 1997; Indra et al., 1999);). The resultant 5′Sox10-cre/ERT2 FRT-tet-FRT3′Sox10 targeting sequence (~5.4 kb) was linearized, electroporated, subjected to flp recombinase, and validated as detailed above.
The Sox10-cre and Sox10-cre/ERT2 BAC DNAs were prepared by CsCl banding and injected separately into fertilized (C57BL/6 X SJL) F2 mouse eggs by the Transgenic Animal Model Core at the University of Michigan using standard protocols (Camper et al., 1995). Genomic DNA was isolated from postnatal day 10 (P10) founder tail snips and screened for detection of the BAC transgene using PCR amplification of three independent sequences. Primers used for screening founders spanned from the vector backbone into the BAC insert for both the SP6 and T7 vector arms and included an internal fragment from each of the Sox10-cre- and Sox10-cre/ERT2 vectors.
Seven BAC transgene positive pups were obtained following injection of the Sox10-cre construct with six of these founders subsequently transmitting the BAC transgene to progeny (Lines A, B, D, E, F, and G). Sox10-cre lines A, F, and G were found to carry a full complement of simple tandem repeat markers spaced across the full BAC genomic interval as previously described (Deal et al., 2006) and were carried forward for further analysis of expression. Of these lines F and G were found to exhibit appropriate expression in enteric nervous system, adrenal, dorsal root ganglia, and pelvic ganglia. Sox10-cre Line F was selected for the analysis presented here based on slightly higher transgene copy number. Similarly, six transgene positive founders were generated for the Sox10-cre/ERT2 construct that were subsequently bred out to establish five lines (Lines A, B, C, D, and E). Sox10-cre/ERT2 lines A and B carried all expected internal simple tandem repeat markers within the BAC and exhibited comparable expression patterns consistent with labeling of neural crest lineages. Data presented here originates from Sox10--cre/ERT2 Line A. Transgene copy numbers were determined to be in the range of two to four copies/genome based on a semi-quantitative PCR assay (data not shown).
2.3. Activation of Sox 10-cre/ERT2 reporter expression by tamoxifen gavage
R26RlacZ/R26RlacZ and ROSATom/ROSATom female mice were mated with Sox10-cre/ERT2 males overnight and the presence of a vaginal plug the following morning was designated 0.5 dpc. Tamoxifen (Sigma) was dissolved in 10% ethanol, 90% sunflower oil, emulsified by sonication, and administered by gavage (125 μg tamoxifen/g body weight) to pregnant females at 9.5 dpc. Postnatal mice were gavaged at day 21 with 125 μg tamoxifen/g body weight and euthanized at day 24. An ethanol/sunflower oil emulsion alone was used for gavage of sham-induced animals. Sham control mice were always gavaged prior to those receiving tamoxifen and housed separately to avoid any potential for tamoxifen contamination.
2.4. Detection of cre reporter expression and immunohistochemistry
Sox10-cre:R26RlacZ and Sox10-cre/ERT2:R26RlacZ embryos were dissected at 14.5 dpc and fixed in ice-cold neutral buffered formalin (NBF, Sigma) for 1 h. Embryos were then either washed and immediately placed intact into β-gal staining solution or subjected to vibratome sectioning (300 μm) before staining. β-gal staining of embryos and sections was performed for 48–72 h at 4°C and stored according to established protocols (Chandler et al., 2007; Deal et al., 2006). Sox10-cre:ROSATom and Sox10-cre/ERT2:ROSATom embryos were fixed in ice-cold NBF overnight, then washed prior to sectioning and/or imaging. Male mice from which the lower urinary tract and prostate tissue were harvested were perfused with fixative.
Harvested tissues were processed for immunohistochemical detection on cryosections using routine methods as previously described (Wiese et al., 2017). Tissue used for detection of serotonin (5HT) was fixed and/or perfused with normotonic phosphate-buffered saline (PBS) consisting of 4% paraformaldehyde with 3% sucrose to reduce loss of 5HT from tissues during processing (Gershon and Ross, 1966). Antibodies used for immunohistochemical detection are summarized in Table 2.
Table 2.
Primary and secondary antibodies used in immunohistochemical analysis.
| Antigen | Host | Supplier | Catalog No.; RRID | Dilution | Incubation Conditions |
|---|---|---|---|---|---|
| Hu C/D | Human | Gift of V. Lennon | N/A; AB_2813895 | 1:10,000 | O/N at 4°C |
| Cre Recombinase | Rabbit | Millipore | 69050–3 AB_10806983 | 1:1000 | O/N at 4°C |
| S100β | Rabbit | Dako | Z0311;AB_10013383 | 1:500 | 3 h at RT |
| Phox2b | Rabbit | Gift of A. Pattyn | N/A; AB_2313690 | 1:750 | O/N at 4°C |
| PGP9.5 | Rabbit | Biogen (antibody no longer sold) | 7863–0504 | 1:4000 | O/N at 4°C |
| PDGFRβ | Rabbit | Cell Signaling Technologies | 3169S;AB_2162497 | 1:100 | O/N at 4°C |
| Serotonin (5HT) | Goat | Immunostar | 20079;AB_572262 | 1:1000 | O/N at 4°C |
| Secondary Antibody | Fluorophore | Supplier | Catalog No.; RRID | Dilution | Incubation Conditions |
| Donkey anti-Human | Cy3 | Jackson ImmunoResearch | 709-165-149; AB_2340535 | 1:1600 | 1 h at RT |
| Donkey anti-Human | Cy5 | Jackson ImmunoResearch | 709-605-149; AB_2340578 | 1:250 | 1 h at RT |
| Donkey anti-Rabbit | Alexa 488 | Jackson ImmunoResearch | 711-545-152; AB_2313584 | 1:400 | 1 h at RT |
| Donkey anti-Rabbit | Cy5 | Jackson ImmunoResearch | 711-175-152 | ||
| AB_2340607 | 1:250 | 1 h at RT | |||
| Donkey anti-Goat | Cy5 | Jackson ImmunoResearch | 705-175-147 | ||
| AB_2340415 | 1:250 | 1 h at RT | |||
Abbreviations: N/A, not applicable; PFA, paraformaldehyde; RRID, Research Resource Identifier; O/N, overnight; RT, room temperature.
For visualization of cell types in myenteric ganglia of the intestine, segments of the duodenum, ileum, and colon were dissected, flushed with 1x PBS and fixed in 10% NBF with 0.5% Triton-X 100 for 20 min. The combined longitudinal and circular muscle layers were separated from the mucosa by microdissection after fixation to derive laminar preparations of the myenteric plexus (LMP). These strips were rinsed sequentially in 1x PBS and 1xPBS with 0.1% Triton-X 100, then blocked in 5% normal donkey serum (NDS, Jackson ImmunoResearch, RRID: AB_2337258) containing 0.3% Triton-X 100 and 1% bovine serum albumin for at least 1 h at room temperature. Tissue sections and LMP strips were exposed to primary and secondary antibodies as indicated in Table 1. After washing in 1x PBS with 0.3% Triton-X 100 both muscle strips and cryosections were mounted in Poly Aquamount (PolySciences Inc.) and coverslipped. When visualization of nuclei was desired, tissue was stained with 4’,6-diamidino-2-phenylindole (DAPI) prior to mounting.
2.5. Fluorescence in situ hybridization
In situ hybridization chain reaction (HCR) version 3 was applied to visualize Sox10 mRNA in 10 μm cryosections of embryonic mouse tissue previously fixed overnight in 4% paraformaldehyde (PFA, Electron Microscopy Services, Hatfield, PA) rinsed in 1xPBS, and stored in 30% sucrose as a cryopreservative. The Sox10 probe was purchased from Molecular Instruments (https://www.molecularinstruments.com) and HCR performed according to (Choi et al., 2018). Fluorescence detection was at 647 nm with confocal microscopy.
2.6. Bright field and fluorescent microscopy
Bright field imaging of embryos and vibratome sections was performed with a DAGE DC330 Camera mounted on a Leica MZ12.5 stereomicroscope. Tissue dissection and initial imaging was performed on a Zeiss M2Bio microscope with a Retiga 4000R-F-M-C camera (QImaging) and accompanying software. Initial fluorescent imaging of cryosections and analysis of DAPI staining was performed on a Leica DMI6000 B microscope using SimplePCI version 6.6.0.16 imaging software (Hamamatsu). Confocal microscopy was performed on a Zeiss Scanning Microscope LSM510 using a 633 nm laser for imaging Cy5 (649–745 bandpass filter), 543 nm laser for imaging Tomato and Cy3 (560–615 bandpass filter), and a 488 nm laser for imaging Alexa 488 (505–550 bandpass filter) to visualize transgene expression and secondary antibody fluorophores. Images were captured with the Zeiss LSM Image Browser Software and exported as.tiff files then assembled in Adobe Photoshop.
3. Results
3.1. Sox10-cre and Sox10-cre/ERT2 transgenic mice recapitulate endogenous Sox10 expression and mark a variety of neural crest derivatives
To generate Cre transgenic lines that recapitulate cell type specific expression of Sox10 throughout development and into adulthood, we incorporated cre expression constructs into a Bacterial Artificial Chromosomes (BAC) (Fig. 1A). Our strategy relied on the presence of large genomic intervals surrounding the Sox10 locus carried by the BAC and specifically avoided deletion of any sequences during construct generation. Expression of Sox10 in the enteric nervous system (ENS) and in other neural crest-derived cell types requires long range regulatory elements that are accommodated by such constructs (Antonellis et al., 2006; Deal et al., 2006). Prior work by our group has demonstrated that the ~140 kb of upstream and ~70 kb of downstream sequences present in the 218 kb 28O11 BAC clone are sufficient to drive expression in all sites known to express Sox10 (Corpening et al., 2011; Deal et al., 2006). Constitutive (cre) and inducible cre (cre/ERT2) constructs were separately integrated into the Sox10 BAC clone using an in vitro modification strategy similar to that taken for prior Sox10 transgenic lines (Corpening et al., 2011; Deal et al., 2006). Our constitutive cre cassette included a human growth hormone (hGH) minigene downstream of the cre coding sequence that has previously been shown to facilitate splicing and significantly increase constitutive expression (Crabtree et al., 2003; Postic et al., 1999; Vassar and Fuchs, 1991; Wysolmerski et al., 1994). In parallel, a cre/ERT2 cassette (Feil et al., 1997) was utilized, in which the recombinase coding sequence is fused to a modified ligand binding domain of the human estrogen receptor that is highly sensitive to nanomolar concentrations of tamoxifen (Tam) to permit spatiotemporal control of Cre activity. Prior to introduction of the individual cre cassettes into the Sox10 BAC, modifications of the 28O11 BAC vector backbone were performed to remove the LoxP and LoxP511 sites flanking the BAC genomic insert. These modifications circumvented any potential effects on transgene expression that might occur due to deletion of the integrated transgene array upon expression of Cre in vivo. Standard in vitro modification techniques (Lee et al., 2001) were used to integrate each cre cassette independently in frame with the ATG of Sox10 in exon 3 to ensure that all regulatory elements were maintained (Fig. 1A). The integration sites were confirmed by sequencing, and the Sox10-cre and Sox10-cre/ERT2 constructs were injected into fertilized eggs to generate transgenic lines. This transgene approach ensures that normal levels of Sox10 message transcribed from the endogenous locus are maintained and avoids any issues of Sox10 haploinsufficiency that can subsequently alter neural crest development (Britsch et al., 2001; Paratore et al., 2002).
Expression of Sox10-cre and Sox10-cre/ERT2 transgenic lines was initially documented in crosses with R26RlacZ reporter mice by staining for β-galactosidase (βGal) activity. Offspring from Sox10-cre crosses exhibited wide-spread expression at 14.5 dpc in tissues known to arise from neural crest progenitors, including craniofacial structures, cranial nerves, semicircular canals of the developing ear, the peripheral nervous system as well as the ENS, and cartilage (Fig. 1B, top panel). Embryos from crosses of Sox10-cre/ERT2 transgenic lines that were administered a single dose of Tam at 9.5 dpc and processed for βGal activity at 14.5 dpc exhibited much more refined expression that was limited to the peripheral and enteric nervous systems as well as the semicircular canals of the ear (Fig. 1B, lower panel). Efforts to induce with tamoxifen prior to 9 dpc were problematic due to increased embryonic demise and resorption (data not shown) as previously reported (Hayashi and McMahon, 2002; Mangale et al., 2008; Peter Lopez and Fan, 2012). The differences in expression patterns between the Sox10-cre and Sox10-cre/ERT2 transgenic lines, particularly in the rostral embryo, are consistent with temporal and spatial shifts in Sox10 expression reported by Soo et al. (2002), who documented loss of Sox10 expression in the branchial arches by late 9.5 dpc. These temporal changes in Sox10 expression patterns imply that neural crest cells undergo a marked restriction in developmental potential with loss of mesenchymal lineage labeling shortly after initiation of Sox10 expression in rostral regions of the embryo at 8.0 dpc and prior to 9.5 dpc when Tam was administered (Soo et al., 2002; Zohn et al., 2007). This is particularly apparent in whole mount images at 14.5 dpc (Fig. 1B), where the craniofacial region and bones of the shoulder and forelimbs are prominently labeled in the Sox10-cre progeny but are no longer visible in the Sox10-cre/ERT2 offspring induced at 9.5 dpc.
Given the marked difference between expression patterns of cre reporter observed by whole mount LacZ staining for multiple embryos compared between the Sox10-cre and Sox10-cre/ERT2 lines (Fig. 1B), we undertook a temporal study of Cre/ERT2 localization within cells of the Sox10-cre/ERT2 line to determine the time period during which the cre recombinase enzyme was present within the nucleus of cells in vivo. Adult Sox10-cre/ERT2:R26RlacZ mice received a single gavage dose of Tam, and ileum LMP preparations were collected at 18, 24, and 48 h (Fig. 2) post-gavage to visualize nuclei within enteric ganglia. Immunohistochemistry for S100β identified the plane of the myenteric plexus where glial nuclei expressing Sox10-cre/ERT2 were present. In myenteric plexi of diluent-only Sox10-cre/ERT2 mice, Cre/ERT2 recombinase protein is detected diffusely throughout the cytoplasm and not in nuclei (Fig. 2, top row, arrowheads). In contrast, 18 h post-gavage, Cre/ERT2 recombinase is localized only within nuclei of S100β+ glial cells (arrowheads) admixed with S100β negative neurons (dotted outline). The absence of Cre signal from enteric neurons is expected based on the restriction of Sox10 protein to mature glia in the adult ENS (Fig. 2, second row, arrows). By 24 h post induction, nuclear Cre/ERT2 recombinase is diminishing (third row, arrowheads) and has returned to diffuse cytoplasmic staining by 48 h post induction (bottom row). This tight temporal and spatial regulation in which Cre/ERT2 recombinase is initially excluded from nuclei, maximally present within the nucleus at 18–24 h post-gavage, and then excluded again by 48 h post-induction likely accounts for the restricted labeling of neural crest-derived structures in Sox10-cre/ERT2 embryos (Fig. 1B).
Fig. 2. Sox10-cre/ERT2 permits tight temporal and cell type specific expression of Cre/ERT2.
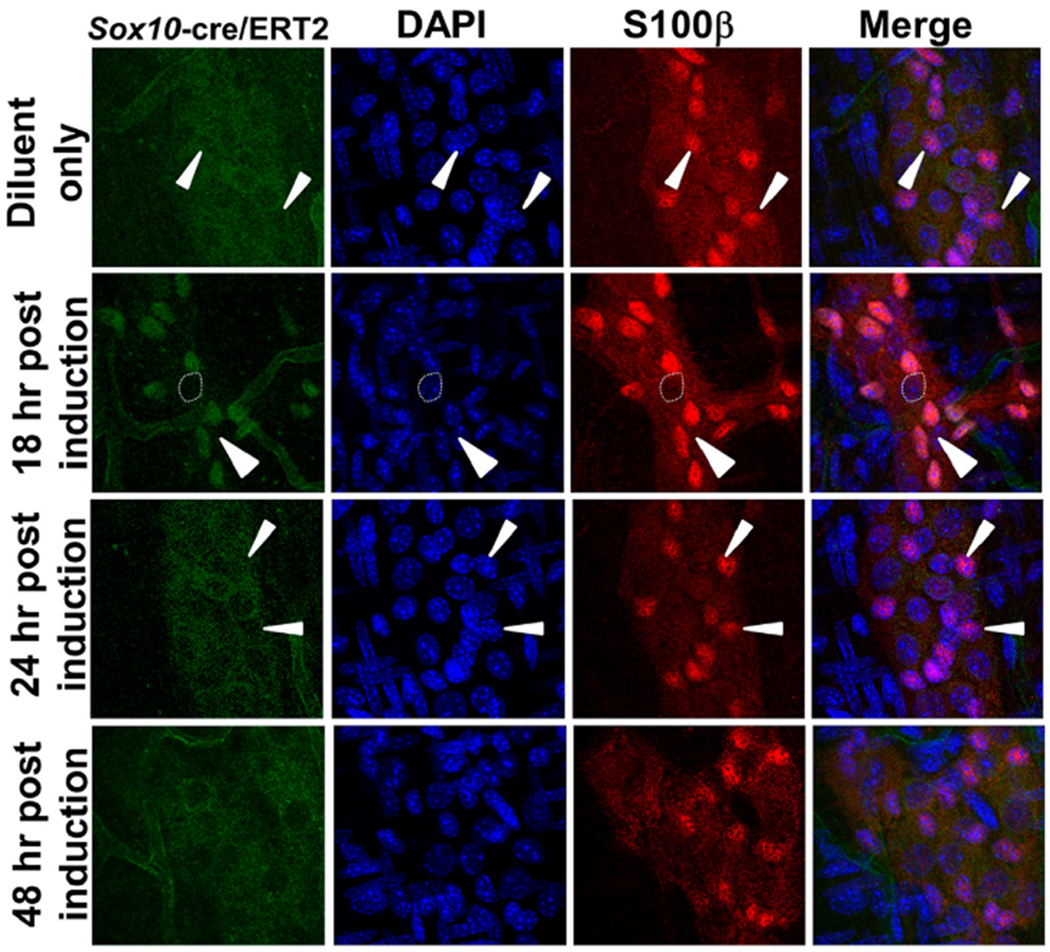
Intestinal laminar muscle preparations containing myenteric plexi were harvested from adult Sox10-cre/ERT2 mice at 18, 24, and 48 h following a single TAM induction via oral gavage. Myenteric plexi harvested from an uninduced adult Sox10-cre/ERT2 mouse served as a control (top row). Myenteric plexi were fixed, subjected to immunohistochemistry with Cre-recombinase antibody (green) and a glial antibody S100β (red), incubated with DAPI nuclear stain (blue), and imaged at 600× magnification via confocal microscopy. In uninduced myenteric ganglia, Cre recombinase was restricted to the cytoplasm of glial cells and not present within nuclei (arrowheads, top row). At 18 h post induction, Cre recombinase was readily observed in glial cells (5 cells surrounding arrowhead) and absent in non-glial cells (cell with dotted outline). At 24 h post induction, Cre recombinase levels were diminished within nuclei (arrowheads) and excluded from nuclei by 48 h.
3.2. The Sox10-cre/ERT2 inducible reporter exhibits restricted labeling of enteric glia in myenteric ganglia of postnatal mice with minimal background
To confirm specificity of the Sox10-cre/ERT2 labeling, we evaluated labeling of myenteric ganglia cells (glia and neurons) with a single bolus of tamoxifen. Three days post-Tam induction, LMP preparations were harvested from the colon and subject to immunohistochemistry with S100β, a glial marker, and Hu C/D, an early pan-neuronal marker. There was near total colocalization of S100 β with Sox10-cre/ERT2-positive cells, but no colocalization with the neuronal marker HuC/D (Fig. 3A). These results are consistent with maintenance of Sox10 expression in mature glia and downregulation of the gene in developing and mature neurons. The low percentage of S100β+ cells that were not labeled by the Sox10-Cre/ERT2 driver are consistent with prior reports of glia cell heterogeneity (Boesmans et al., 2015). Myenteric plexi from duodenum and ileum were processed in parallel with those of colon, and similar results were obtained (data not shown).
Fig. 3. Induction of postnatal Sox10-cre/ERT2;ROSATom mice with tamoxifen labels glial, but not neuronal, cells in the myenteric plexi.

Confocal images from LMP of Sox10-cre/ERT2;RosaTom mice show the cell type specificity and minimal background expression of this construct. (A) Confocal images of myenteric ganglia in LMP from Tam-induced mice euthanized three days post gavage labeled with the glial antibody S100β (green) and pan-neuronal antibody Hu C/D (blue). The area encompassed by the dashed boxes is enlarged in the insets. Sox10-cre/ERT2;ROSATom-positive cells co-label with the glial marker, S100β (arrowheads), but not with the pan-neural Hu C/D marker. Neuronal cells labeling with Hu C/D are not Sox10-cre/ERT2;ROSATom-positive (arrow). (B) Colonic myenteric plexi from P21 tamoxifen-induced (top) and diluent-only (bottom) mice were harvested at P24 after gavage at P21, imaged with confocal microscopy, and compared side by side. An example of maximal baseline activation of the Cre recombinase enzyme observed in colon of diluent-only treated animals is shown. Diluent-only mice were gavaged first and housed separately to avoid any tamoxifen cross-contamination.
With any inducible reporter construct like cre/ERT2, it is imperative to confirm stringent regulation and assess the potential for reporter expression in the absence of the inducing agent. To assess regulation of Cre/ERT2 in the absence of Tam administration, myenteric plexi were harvested from P24 mice that had received a dose of only diluent at P21 and compared with tissues from littermates that had received a single oral bolus of tamoxifen at P21 (Fig. 3B, top and bottom panels). Diluent-only animals were gavaged first and housed separately to avoid potential cross-contamination of these control animals via coprophagia. In LMP preparations from diluent-only treated mice we observed sporadic cells labeled by tdTomato expression (Fig. 3B) that suggested a low level of cre activity in the absence of Tam activation. The frequency of these sporadically labeled cells was highest in the colon with decreasing frequency in the ileum and very rare labeling in the duodenum (data not shown). In the colons of diluent-only treated mice the frequency of ROSATom expression was ≤4.4% of total cells labeled by DAPI compared to Tam induced Sox10-cre/ERT2:ROSATom littermates (data not shown). Similar observations were made across multiple litters, between independent batches of sunflower oil used as diluent, and when the mice were maintained on a phytoestrogen free diet, thus indicating, based on reporter activation, a low level of cre/ERT2 expression inherent to the Sox10-cre/ERT2 transgene independent of any extrinsic factors. Interestingly, when ROSATom-positive cells were observed in diluent-only preparations, they were often in small clusters of two to four cells, suggesting that these cells may have arisen from a single progenitor in the three-day interval between diluent administration and tissue harvest.
3.3. Differences in Sox10-cre and Sox10-cre/ERT2 expression during development identify early Sox10 expression in cranial neural-crest progenitors destined to contribute to mesenchymal derivatives
Given the notable differences in expression observed between Sox10-cre and Sox10-cre/ERT2 transgenics in whole mount staining (Fig. 1B), we undertook a refined analysis of gene expression between the two lines using vibratome sections. Thick sections of embryos from Cre lines crossed with R26RlacZ reporters followed by staining of 14.5 dpc embryos for βGal activity allowed ready visualization and comparison of structures (Fig. 4). When comparing transverse sections through the cranial aspect of Sox10-cre (Fig. 4A–C) and Sox10-cre/ERT2 (Fig. 4, A′–C′) 14.5 dpc embryos, neuronal/ganglion structures, such as the glossopharyngeal nerve, trigeminal ganglia, and dorsal root ganglia are clearly visible in both the constitutively expressing Cre and Cre/ERT2 induced embryos. Our observations demonstrate that the Sox10-cre/ERT2 BAC recapitulates previously reported transcription of Sox10 in these structures during the Tam induction period (Anderson et al., 2006; Soo et al., 2002; Southard-Smith et al., 1998). The differences in reporter expression are most notable in the developing craniofacial skeletal structures. Strong Sox10-cre expression is visible in the developing auditory ossicles (malleus, incus, stapes), cochlea, sphenoid bone, baso-occiptal bone, frontal bone, Meckel’s cartilage, nasal septum, and tongue (Fig. 4A–C), but the same structures in the Sox10-cre/ERT2 embryo (Fig. 4,A′–C′) have little or absent expression. Sagittal vibratome sections also highlight the differential staining of craniofacial structures (compare Fig. 4, F vs. F′). Differences in reporter expression in several soft tissue structures are also apparent. The posterior aspect of the spinal cord (likely oligodendrocytes), cardiac outflow tract, and thymus exhibit expression in the Sox10-cre embryo, whereas those structures are devoid of staining in the Sox10-cre/ERT2 embryo (compare Fig. 4 B vs. B′ and C vs. C′ (Stolt et al., 2002);). In higher magnification images of transverse vibratome sections through the thoraces, the dorsal root ganglia, sympathetic ganglia, vagal trunk and enteric ganglia in the esophagus show expression with both reporters (compare Fig. 4, D and D′, E and E′). However, non-neuronal structures, such as the vertebral bodies, ribs, nucleus pulposus, tracheal cartilage, and descending aorta are only labeled by the constitutive Sox10-cre transgene at 14.5 dpc.
Fig. 4. Differences in Sox10-cre and Sox10-cre/ERT2 R26RLacZ expression during development highlight the importance of early Sox10 expression in neural-crest derived structures.

Sox10-cre; R26RLacZ embryos (A-F, constitutive expression) and Sox10-cre/ERT2;R26RLacZ embryos (A′-F′, tamoxifen induction at 9.5 dpc) were harvested at 14.5 dpc, fixed, and subject to vibratome sectioning (300 μm thickness) either in the transverse plane [A,A’ (most rostral) – E,E’ (most caudal)] or sagittal plane (F and F′). Vibratome sections at comparable anatomic levels, as indicated in mouse schematic (bottom), were then stained for β—galactosidase activity and imaged at the following magnifications: A,A′, 21 and 26x, respectively; B,B′ 21x; C,C′ 21x; D,D′ 38x; E,E′ 63x; F,F′ 14x. The approximate planes in which sections were taken are indicated on the drawing of the age-appropriate embryo (modified from Kaufmann, 2001). G and H. Fluorescent microscopy images of Hybridization Chain Reaction using Sox10 probe on transverse cryosections through the head (10 μm thickness) of 9.5 dpc (G) and 11 dpc (H) Sox10-cre:ROSATom embryos. Arrow indicates nerve bundle behind optic cup (oc), and arrowheads indicate the initiation of Tomato expression in neuroepithelium. Scale bar in G = 50 μm, H = 200 μm. Abbreviations: ao, auditory ossicles, bo, baso-occipital bone; c, cochlea; cc, cricoid cartilage (central canal in H); ca, carotid artery; D, dorsal; da, dorsal aorta; drg, dorsal root ganglion; e, esophagus; fb, frontal bone; gp, glossopharyngeal (IX) nerve; hh, humeral head; lnp, lateral nasal process; Mc, Meckel’s cartilage; mnp, medial nasal process; np, nucleus pulposus (nasal pit in H); ns, nasal septum; oc, optic cup; oft, outflow tract of heart; op, otic pit; r, rib; sc, scapula; scsg, superior cervical sympathetic ganglion; sg, sympathetic ganglion; smg, submandibular gland; sph, sphenoid bone; t, tongue; tc, tracheal cartilage; tg, trigeminal ganglion; thy, thymus; V, ventral; vb, vertebral body; va, vertebral artery, vt, vagal trunk.
To better understand the differences in transgene labeling and assess the timing of Sox10 transcription relative to Sox10-cre expression, we performed Hybridization Chain Reaction in situ (HCR) on Sox10-cre:ROSATom embryos (Fig. 4G and H). At 9.5 dpc endogenous Sox10 mRNA expression is present in the second branchial arch although it has already been extinguished in the first branchial arch, consistent with prior reports by Soo et al. (2002) (Fig. 4G). At this stage, the neuroepithelium lining of the otic pit exhibits Sox10 mRNA although Tomato reporter expression is not yet evident, as would be expected for a lag in generation of Tomato fluorescence by cre activity. By 11 dpc (Fig. 4H), the various facial mesenchymal structures, including those derived from the branchial arches, are devoid of Sox10 mRNA, while Tomato reporter fluorescence remains to confirm prior Sox10 expression. At this stage Sox10 mRNA is present within the trigeminal ganglia and nerve fibers extending behind the optic cup.
Taken together, the data of Figs. 1, 2 and 4 indicate neural crest progenitor cells that contribute to cranial mesenchymal tissues downregulate Sox10 expression as they initiate differentiation prior to 10.5 dpc, within 24 h of Sox10 first being expressed at 8.5 dpc (Anderson et al., 2006; Soo et al., 2002). This temporal shift in Sox10 expression as the gene becomes restricted to progenitors that form the neurons and glia of cranial ganglia is consistent with prior in situ hybridization data for Sox10 reported by (Anderson et al., 2006; Soo et al., 2002). Neural crest progenitor cells that give rise to glia and neurons maintain Sox10 expression for a longer period of time and are thus labeled by Tam induction in Sox10-cre/ERT2 transgenic tissues.
3.4. Sox10-cre:ROSATom expression labels numerous neural crest derivatives
Sox10-cre x R26RlacZ crosses with subsequent colorimetric detection of β-gal activity in fetuses at 14.5 dpc adequately stained neural crest-derived structures for purposes of whole-mount imaging. However, penetration of the reagents into internal organs was suboptimal unless vibratome sections were obtained first and subsequently stained for β-gal activity (Figs. 4 and 5A). In addition, βgal-stained structures could be easily identified, but cellular detail was lacking. To improve visualization of tissues and cells labeled by Sox10-cre expression, we performed Sox10-cre x ROSATom crosses and analyzed constitutive reporter expression in vibratome sections (Fig. 5B, D and 5D”), wholemount (Fig. 5D), and cryosections (Fig. 5 C, E, and F–F”). We carefully evaluated reporter expression activated by the constitutive Sox10-cre throughout embryonic development into adulthood and found that every prior reported tissue that is known to express Sox10 can be visualized with the Sox10-cre transgene when crossed with this reporter, including testicular Sertoli cells and adrenal medullary cells (data not shown (Cory et al., 2007); and (Reiprich et al., 2008), respectively), as well as central nervous system pericytes (see Fig. 8 below; (Simon et al., 2012; Trost et al., 2013)).
Fig. 5. Sox10-cre:ROSATom expression is present in all neural crest–derived mesenchymal and peripheral nervous system tissues known to express Sox10.

A Sox10-cre:R26RLacZ embryo (A) and a Sox10-cre:ROSATom embryo (B) were harvested at 14.5 dpc, fixed, and subject to vibratome sectioning (300 μm thickness) in the sagittal plane. Images of vibratome sections either stained for β—galactosidase activity or viewed for tdTomato fluorescence are shown (A, light microscopy, 17× magnification; B, fluorescent microscopy, 11× magnification). The larger insets in both A (whole mount, 63× magnification) and B (cryosection, 100× magnification) shows Sox10 reporter expression in the non-ossified metacarpals of 14.5 dpc forepaws. Sectioning was required to reveal Tomato signal within individual chondrocytes in cartilage (inset B; 320× magnification). Images of Sox10-cre:ROSATom tissues are shown in the other figure panels. (C) Transverse cryosection (20 μm) through the spinal cord of a 17.5 dpc embryo, 100x magnification. (D -D″) Images of heart from vibratome sections (300 μm, D and D′) through a 14.5 dpc embryo (27x and 33× magnifications) or whole mount (D”; 67× magnification) of the great vessels at P2. (E, E′) Coronal sections (20 μm) through P2 cerebral ventricles and choroid plexi of Sox10-cre:ROSATom and Wnt1-cre:ROSATom mice, respectively (100× magnification; insets 320× magnification). (F–F″) Images of skin from a 17.5 dpc embryo, cryosectioned (20 μm) parallel to the hair follicles, perpendicular to the skin, shown with DAPI (E) and Tomato reporter expression (E′), prior to rendering a merged image (E″, 320× magnification). Abbreviations: a, aortic valve; aa, ascending aorta; bc, brachiocephalic artery; cp, choroid plexus; cv, cerebral ventricle; d, dermis; dao, descending aorta; dar, ductus arteriosus; dc, dorsal column; drg, dorsal root ganglion e, epidermis; eso, esophagus; f, follicles; lc, laryngeal cartilage; lcc, left common carotid artery; lv, left ventricle; m, mitral valve; me, melanocytes; oft, outflow tract; p, palate; pa, pulmonary artery; ra, right atrium; rv, right ventricle; smg, submandibular gland; snf, sensory nerve fibers; t, tongue; thy, thymus; tr, tricuspid valve; vb, vertebral body; vt, vagal trunk.
Fig. 8. Pericytes within the lower urinary tract of Sox10-cre:ROSATom mice do not originate from neural crest.

Immunohistochemical labeling of pericytes with PDGFRβ antibody did not identify any co-localization with pericytes in the bladder wall (top panel) or the pelvic ganglia (middle panel) of Sox10-cre:ROSATom mice. Coincidence of PDGFRβ expression in perictyes (green) with tdTomato (red) signal was not ever detected despite imaging multiple sections of bladder and pelvic ganglia by confocal microscopy. To confirm that the PDGFRβ antibody (green) used actually labeled pericytes, it was applied to the retinal tissue of a P45 Sox10-cre:ROSATom (red) mouse bottom panel. Ocular pericytes have been previously confirmed to be of neural crest origin. Confocal image shows complete colocalization of PDGFRβ expression and dtTomato signal (red) in retinal sections. Scale bar for all insets in are 20 μm. Abbreviations: bv, blood vessel; bw, bladder wall; n + g, neurons and glia; pg, pelvic ganglia; sm, submucosa; vit, vitreous humor.
In comparison with β-gal staining (Figs. 4 and 5A), Sox10-cre activated ROSATom reporter permits comprehensive labeling of the facial bones and improved resolution of fine details, including striations within the tongue musculature (Fig. 5B). Similarly, individual oligodendrocytes, that prominently express Sox10 during development, were readily visualized in the spinal cord (Fig. 5C). Such detail is lacking in the images that relied on the R26RlacZ reporter (compare Figs. 4 and 5). As expected, based on known roles for neural crest in cardiac development, Sox10-cre activated tdTomato reporter expression was apparent in the valve leaflets and outflow tract of the heart was (Fig. 5D and D′). In addition, postnatal constriction of the ductus arteriosus results in particularly concentrated bright Sox10-cre reporter expression in this structure (Fig. 5D’) where Wnt1-cre labeling of ductus arteriosus has previously been reported (Huang et al., 2008; Pfaltzgraff et al., 2014). Interestingly, we observed discrete labeling of individual Sox10-cre labeled cells in a punctate distribution over the epicardium, primarily over the right ventricle (Fig. 5D”), that to our knowledge has not previously been described. Labeling of the hindbrain choroid plexus by Sox10-cre (Fig. 5E) and Wnt1-cre (Fig. 5E’) was also observed and is consistent with prior reports of choroid plexus labeling by other neural crest cell specific Cre lines including Wnt1-Cre (Dietrich et al., 2009; Huang et al., 2010), Mef2c-F10E-Cre (Aoto et al., 2015), and PLAT-Cre (Pietri et al., 2003). Finally, in fetal skin (17.5 dpc), neural-crest derived melanocytes are apparent in the base and scattered throughout the length of hair follicles, accompanied by sensory nerve fibers throughout the upper dermis (Fig. 5F–F”).
Thus, the majority of the expression patterns we detect by Sox10-cre:ROSATom labeling are all consistent with prior reports of neural crest derivatives throughout the developing embryo. The only potentially ectopic expression we observed was in the form of very rare clustered foci of hepatocytes and clusters of prostatic glandular epithelium (data not shown) for which we were unable to find any prior literature or biological basis.
3.5. Sox10-cre:ROSATom lineage labeling identifies novel sites of Sox10 expression
Interestingly, our analysis of Sox10-cre:ROSATom reporter patterns identified a few novel sites of Sox10 expression. Consistent with prior knowledge that perivascular mesenchymal cells in the thymus and thymus capsule are neural-crest derived (Muller et al., 2008), we observed prominent dtTomato + cells within the thymus and along the thymus capsule using both Sox10-cre:ROSATom and Wnt1-cre:ROSATom reporters (Fig. 6A and A”). However, we also observed prominent labeling of thymic adipose tissue in Sox10-cre:ROSATom embryos at P2 (Fig. 6A) that has not previously been reported. Comparison of Wnt1-cre:ROSATom expression at the same age showed similar labeling indicating that the thymic fat pad is neural crest-derived (Fig. 6A’).
Fig. 6. Sox10-cre:ROSATom and Wnt1-cre:ROSATom expression identify thymic adipose as neural crest in origin although not nucleus pulposus.

(A, A′) Images of cryosections (20 μm) through the thymic lobes and attached adipose tissue of P2 Sox10-cre:ROSATom and Wnt1-cre:ROSATom embryos, respectively (100× magnification). (B, B′) Images of transverse cryosections (20 μm) through the intervertebral discs of 17.5 dpc Sox10-cre:ROSATom and Wnt1-cre:ROSATom embryos, respectively (160× magnification). An enlarged view of the nucleus pulposus cells within the dashed box is shown in the figure inset. No Wnt1-cre:ROSATom signal is observed in this tissue. Abbreviations: ad, adipose; bv, blood vessel,; da, disc annulus; npc, nucleous pulposus cells; pe, pericytes.
During our survey of Sox10-cre:ROSATom tissues, we also detected novel reporter labeling seen as delicate subcellular detail among nucleus pulposus cells of the intervertebral disc at 17.5 dpc (Fig. 6B) in tissue sections. Unlike the thymic fat pad, this location did not exhibit comparable Wnt1-cre:ROSATom expression (Fig. 6B’) indicating that this site of Sox10 expression does not originate from neural crest.
Sensory and autonomic bladder nerve terminals in the bladder wall as well as pelvic ganglia originate from Sox10+ neural crest derived progenitors during development (Wang et al., 2011; Wiese et al., 2017). Consistent with this we readily observed prominent labeling of bladder nerve terminals and pelvic ganglia in whole mount views (Fig. 7A) and coronal cryosections (Fig. 7C) of the bladder and proximal urethra in young adult Sox10-cre:ROSATom mice. Unexpectedly, our examination of Sox10-cre:ROSATom expression also identified prominent labeling of urethral glands that completely encircle the pelvic urethra (Fig. 7A, inset). This extraordinarily bright tdTomato signal was consistently observed in the periurethral glands of both male (see Fig. 7A, left panel) and female Sox10-cre:ROSATom mice (data not shown). To investigate whether these urethral glands are derived from neural crest, we analyzed longitudinal cryosections of pelvic urethral tissue from Sox10-cre:ROSATom; Sox10-H2BVenus (Corpening et al., 2011), and Wnt1-cre;ROSATom young adult males (Fig. 7D). The urethral glands are fluorescently labeled in the Sox10-cre:ROSATom and Sox10-H2BVenus tissues, but glandular Wnt1-cre signal is absent. Immunohistochemistry with S100β shows total colocalization with neural crest-derived glia in all three reporters (Fig. 7D), and glia are clearly a distinct population from the glandular cells. This data supports two conclusions: Urethral glandular cells are not derived from neural crest, and the expression of Sox10 is maintained in adult glands (Sox10-H2BVenus) and not simply transient during development.
Fig. 7. Urethral glands labeled by Sox10-cre:ROSATom expression are independent of neural crest.

A. Lateral whole mount image of a male Sox10-cre:ROSATom bladder and proximal urethra following removal of the prostate (15.2× magnification) is shown. Pelvic ganglia (pg) are visible with neuronal fibers extending into the bladder wall in the upper portion. Due to the brightness of the urethral glands, the lower portion of the image was captured with a shorter exposure (370 msec), while the upper portion required a longer exposure (1.46 s) to reveal nerve fibers. A transverse cryosection through the proximal urethra (inset, scale bar 400 μm) shows the circumferential nature of these glands. B. Wholemount image of a male Sox10-cre:ROSATom bladder viewed from the anterior perspective is shown. Two distinct exposures (920 msec left and 270 msec right) are juxtaposed at the dotted white line. C. Image of tdTomato fluorescence in longitudinal cryosection through male Sox10-cre:ROSATom bladder to show the relationship of the bilateral pelvic ganglia to the bladder wall neck (scale bar is 1 mm). D. Images of cryosections through pelvic urethra of male Sox10-cre:ROSATom and Sox10-H2BVenus tissues exhibit labeling of urethral glands from sustained Sox10 expression as indicated by the high levels of Venus (green) present in glandular cells. Comparable sections through Wnt1-cre:ROSATom pelvic urethra reveal labeling of only S100β+ neural crest-peripheral glia. Abbreviations: b, bladder; pg, pelvic ganglia; u, urethra; pu, pelvic urethra; ug, urethral glands; l, lumen; et, erectile tissue. Raw images of the genitourinary system presented in this manuscript are accessible at GUDMAP.org GUDMAP Consortium https://doi.org/10.25548/17-BS66 (Southard-Smith, 2020).
3.6. Extensive labeling of neural crest in bladder and pelvic ganglia of Sox10-cre:ROSATom mice does not include pericytes
Pericytes are known to originate from neural crest in multiple tissues, including the thymus (Foster et al., 2008; Muller et al., 2008), retina and choroid (Trost et al., 2013), and central nervous system (Etchevers et al., 2001; Korn et al., 2002). Pericytes are embedded in the basement membrane, are in intimate communication with endothelial cells lining capillaries and venules throughout the body, and contribute to vascular homeostasis (Bergers and Song, 2005; Birbrair et al., 2015). Given prior reports of renal pericytes that originate from outside the kidney (Asada et al., 2011), we examined the co-localization of Sox10-cre:ROSATom lineage-traced cells with the commonly used pericyte marker PDGFRβ at P38 to assess whether pericytes in the lower urinary tract might originate from neural crest. We found no co-localization of tdTomato signal with PDGFRβ expression in sections of bladder wall (Fig. 8, top panel) or pelvic ganglia (Fig. 8, middle panel) despite examining numerous sections and testing several PDGFRβ antibodies. As a positive control, there was complete colocalization of PDGFRβ expression and RosaTom signal in neural-crest derived retinal pericytes of Sox10-cre:ROSATom mice at P45 (Fig. 8, bottom panel (Trost et al., 2013);). Our results are consistent with the previously proposed principle that in normal development, ectoderm-derived neural crest give rise to pericytes in anterior regions of the embryo including the brain and thymus, while pericytes in coleomic organs such as the bladder and bowel are mesoderm-derived (Armulik et al., 2011).
3.7. Sox10 expression in multiple other glandular tissues extends into adulthood but is not an indicator of neural crest origin
Given the ongoing expression of Sox10 in urethral glands, we undertook a survey of lacrimal, parotid, submandibular, and mammary glands from Sox10-cre:ROSATom; Sox10-H2BVenus, and Wnt1-cre;ROSATom young adults. Fetal Sox10 expression in mammary glands has previously been shown with the Sox10-H2BVenus line (Dravis et al., 2015). The lacrimal gland and parotid glands, both of which contain only serous acini, express Sox10 (Sox10-H2BVenus signal is restricted to the nucleus), but do not show Wnt1-cre labeling. It appears that a small portion of cells in Wnt1-cre:ROSATom glandular tissues label, but the nature of these cells is uncertain. Interestingly, we noted occasional tdTomato signal in the acinar cells of the Wnt1-cre:ROSATom lacrimal and parotid tissue (Fig. 9, top two right panels) that may be ectopic expression.
Fig. 9. Sox10 is expressed in the secretory units of adult lacrimal, salivary, and mammary glands independent of neural crest lineage.

Comparison of images from cryosectioned tissues from Sox10-cre:ROSATom, Sox10-H2BVenus, and Wnt1-cre:ROSATom mice shows ongoing expression of Sox10 based on presence of tdTomato and H2BVenus in secretory cells in contrast to limited neural crest lineage labeling by Wnt1-cre:ROSATom. Confocal images of cryosections (lacrimal and salivary) and “squash” preps (mammary) of glandular tissues dissected from young adult mice reveal that Sox10-cre:ROSATom reporter expression is present in serous acini of the lacrimal gland (serous only), parotid (serous only), and submandibular (mixed serous/mucous), as well in the exocrine ducts within the mammary gland (left column). Sox10-H2BVenus reporter expression (Corpening et al., 2011) indicates that Sox10 expression is maintained in these glands into adulthood (middle column). Wnt1-cre:ROSATom reporter expression (right column) is absent in these glands except in rare, focal epithelial cells in the lacrimal and parotid glands. Ectopic Wnt1-cre:RosaTom expression is not observed in the submandibular and mammary glands. Abbreviations: d, duct; id, intercalated duct; s, serous acini; m, mucous acini.
The submandibular gland is a mixed serous/mucous gland. We observe that Sox10 appears to be expressed in serous acini (nuclei located more centrally, narrow lumen) but not in mucous acini (nuclei flattened at base of cells, wider lumen). Expression of Wnt1-cre is again present in the surrounding mesenchymal tissue likely as a result of glial cells that accompany nerve terminals in these glands, with no potentially ectopic expression in the acini.
In a similar fashion, the lobular and ductular epithelium of the mammary gland both express Sox10, but Wnt1-cre labeling is only in cells of the surrounding mesenchymal tissue. No potential ectopic Wnt1-cre:ROSATom signal was observed.
3.8. The Wnt1-cre reporter is less efficient than the Sox10-cre reporter in detecting neural crest derived cells within enteric ganglia of the intestine and pelvic ganglia of the lower urinary tract
Since the Wnt1-cre transgene is a well-established standard line for labeling neural crest derived lineages, we undertook a comparison of the efficiency of our Sox10-cre transgene and the Wnt1-cre transgene for labeling cells of neural crest origin. First, laminar muscle preparations were isolated from the duodenum, ileum, and colon of P17 Wnt1-cre:ROSATom and Sox10-cre:ROSATom mice and subjected to immunohistochemistry for Phox2b, which is expressed at high levels in enteric neuronal nuclei (Corpening et al., 2008). We observed that Wnt1-cre reporter expression did not always colocalize with Phox2b labeling (Fig. 10B–B″). Representative images provide magnified views of Phox2b-positive cells (Fig. 10B”, arrowheads) that are not Wnt1-cre:ROSATom positive. The duodenal, ileal, and colonic myenteric plexi from three Sox10-cre:ROSATom and three Wnt1-cre:ROSATom animals were subjected to Phox2b immunohistochemistry, imaged, and quantified manually from Z-stack images. For each genotype, neural-crest derived cells were counted, with over 680 duodenal, 1000 ileal, and 2000 colonic cells per genotype scored. Statistical analysis (t-test, assuming unequal variance) revealed that the Wnt1-cre reporter labeled significantly fewer neural crest derived cells in the ileum and colon than did the Sox10-cre transgene line. No significant difference between the labeling efficiency of the two reporters was observed in duodenal segments (Fig. 10C).
Fig. 10. Sox10-cre is more efficient than Wnt1-cre at labeling enteric neurons in myenteric ganglia.

Confocal images of laminar preparations of intestinal muscle containing myenteric ganglia from P17 pups exhibit RosaTom expression driven by the Sox10-cre (A) and Wnt1-cre (B) transgenes. Phox2b immuno-detection brightly labels neural crest-derived neurons (A′ and B′). A’‘) Sox10-cre driven reporter expression consistently colocalizes with Phox2b immunolabeling as evidenced by cells indicated with arrowheads (A”, inset). We observed that Wnt1-cre reporter expression does not detect all neurons within enteric ganglia based on colocalization with Phox2b immunolabeling (arrowheads panel B″, inset). Confocal images were taken at 400× magnification (200x plus 2x software zoom). (C) To quantitate cells within myenteric plexi, three confocal images at 200× magnification were taken from each region of the intestine (duodenum, ileum, colon) per animal (9 images per animal). Intestines from three Sox10-cre:ROSATom and three Wnt1-cre;ROSATom animals were analyzed. Cells were quantified manually from Z-stack images. For each genotype, neural-crest derived cells were counted (glia and neurons), with over 680 duodenal, 1000 ileal, and 2000 colonic cells per genotype being scored. A t-test (assuming unequal variance) was performed, and the data are presented as percentage ± standard deviation, together with resulting p values.
To examine whether expression differences occurred between the Wnt1-cre and Sox10-cre transgene lines in other neural crest-derived ganglia, we evaluated transgene expression in pelvic ganglia, which lie on either side of the bladder neck and send neural projections into the bladder wall, urethra, and genitalia. When cryosections of the pelvic ganglia are subject to immunohistochemistry with PGP9.5, a neuronal marker that labels neuronal soma and fibers, PGP9.5-positive cells and fibers associate intimately with the neurons identified by the Sox10-cre:ROSATom reporter, with only a rare PGP9.5-positive cell that does not colocalize (Fig. 11, top row, arrowhead). However, within the pelvic ganglia from Wnt1-cre reporter mice, multiple PGP9.5-positive cells and fibers do not colocalize with reporter-positive cells (Fig. 11, bottom row, multiple arrowheads). These data suggest that the Sox10-cre transgenic line also more efficiently labels pelvic ganglia neurons.
Fig. 11. Wnt1-cre labels fewer neurons within pelvic ganglia of the lower urinary tract.

Confocal images of pelvic ganglia cryosections from Sox10-cre:RosaTom (top row panels) and Wnt1-cre:RosaTom (bottom row panels) from 17.5 dpc embryos labeled with PGP9.5 (green). In Sox10-cre:RosaTom pelvic ganglia, with only rarely exception (top panels, arrowhead), PGP9.5 is localized in the cytoplasm of all neurons expressing Sox10-cre activated RosaTom. Glial cells are indicated with arrows and do not intimately associate with PGP9.5 staining. However, in Wnt1-cre:ROSATom pelvic ganglia, PGP9.5 clearly labels frequent neuronal cells that do not exhibit RosaTom-positive cell bodies (bottom row panels, arrowheads).
4. Discussion
Manipulation of neural crest cells is of interest both to gain an understanding of the diverse effects of these progenitor cells in normal development and disease as well as to determine the lineage specific effects of particular genes in discrete neural crest-derived cell types. To facilitate the manipulation of Sox10+ neural crest lineages, we generated two complementary transgenic tools that avoid disruption of the endogenous Sox10 locus and, in contrast to prior Sox10-cre transgenic lines (summarized in Table 3), have retained all regulatory regions that are known to recapitulate endogenous gene expression. The Sox10-cre line presented here provides constitutive (non-inducible) comprehensive labeling of Sox10+ lineages, identifies novel Sox10+ derivatives, and indicates a previously unrecognized anterior-posterior gradient of Wnt1-cre transgene expression that could complicate studies of neural crest lineages in caudal regions of the embryo. The Sox10-cre/ERT2 line permits tamoxifen inducible control of Cre action in all lineages known to express Sox10, demonstrates tight nuclear-exclusion of Cre in the absence of tamoxifen, and, by comparison to Sox10-cre, identifies the timing of Sox10 restriction from mesenchymal versus other lineages.
Table 3.
Sox10-cre and Sox10-cre/ERT2 transgene lines.
| Sox10-cre | Reference | Brief Description of Construct |
|---|---|---|
| Tg(Sox10-cre)1Wdr | Matsuoka et al., 2005 | Entire coding region of Sox10 within PAC RP21-529-I6 replaced by nuclear-targeted cre recombinase sequence with loss of intronic sequences. |
| Tg(Sox10-cre)507Mcln | Stine et al. (2009) | Upstream Sox10 MCS 4 enhancer sequence placed in front of c-fos minimal promoter to drive cre ORF and polyA sequence |
| Tg(Sox10-cre)1Sout | Musser et al., 2015 | Line presented in detail in this manuscript. In frame fusion of cre cassette with Sox10 endogenous ATG avoided deletion of any exonic or intronic sequences. |
| Tg(Sox10-cre/ERT2)26Vpa and Tg(Sox10-cre/ERT2)93Vpa | Laranjeira et al. (2011) | Inducible CreERT2 ORF placed under control of Sox10 regulatory sequences in PAC RP21-529-I6, resulting in replacement of Sox10 coding sequences and loss of introns 2 and 3. |
| Tg(Sox10-icre/ERT2)1Ldim and Tg(Sox10-icre/ERT2)2Ldim | Simon et al. (2012) | Exon 3 of the Sox10 gene replaced by sequence for a codon-improved cre recombinase (icre) fused to mutated estrogen receptor (ERT2) and SV40 polyA sequence |
| Tg(Sox10-icre/ERT2)388Wdr | McKenzie et al. (2014) | Entire coding region of Sox10 within PAC RP21-427-F18 replaced by inducible improved cre recombinase (icre/ERT2) sequence with loss of intronic sequences. |
| Tg(Sox10-ERT2/cre/ERT2)17Sor | Soriano et al., 2015 | Sox10 MCS 4 distal enhancer with a c-fos minimal promoter drives inducible cre recombinase gene flanked by two modified estrogen receptors (ERT2/cre/ERT2) followed by rabbit globin polyA sequence |
Abbreviations: MCS, multiple species conserved sequence; ORF, open reading frame; polyA, polyadenylation.
Studies focused on mapping the migration and derivatives of neural crest precursor cells throughout embryonic development have led to the construction of several constitutive and inducible Sox10 transgenic lines (Table 3 (Debbache et al., 2018);), for prior overview of neural crest driver lines). Although many of these constructs drive expression of Cre in tissues that express endogenous Sox10 expression, none of these prior constructs contain both the well-established long-range regulatory regions of Sox10 and the conserved first intron, which contains binding sites for multiple transcription factors known to be essential in early neural crest induction and critical for spatial patterning of Sox10 transcription (Antonellis et al., 2006; Dutton et al., 2008). Both constructs reported here utilized the same strategy as our previously reported Sox10-βGeo and Sox10-H2BVenus BAC constructs, in that the all exonic and intronic Sox10 sequences were preserved and distant cis-acting regulatory elements (including the MCS4 enhancer sequence) were present within the 28O11 BAC (Fig. 1; (Corpening et al., 2011; Deal et al., 2006). In the Sox10-cre construct, we inserted the human growth hormone (hGH) minigene downstream of the Cre recombinase sequence to maximize efficiency of expression (Orban et al., 1992; Postic et al., 1999). It has recently been reported that hGH protein can in some cases be expressed from the hGH minigene (Brouwers et al., 2014; de Faudeur et al., 2018). However, careful analysis of our Sox10-cre mouse line has not identified any abnormalities in either body size or tissue morphology compared to non-transgenic littermates that would be consistent with hGH protein expression from our transgene construct (data not shown). For both the Sox10-cre and the Sox10-cre/ERT2 constructs, ablation of the LoxP and LoxP511 sites within the 28O11 BAC backbone was performed to preclude excision of the transgene upon Cre recombinase activation and ensure expression was maintained in Sox10+ expressing cells over time.
Crossing Sox10-cre mice with either R26RLacZ or ROSATom reporter strains yielded expression patterns that, based on extensive review of the literature and our own experience, recapitulate endogenous Sox10 and label structures derived from neural crest progenitors arising from all axial levels: cranial, cardiac, vagal, and sacral. Our survey of Sox10-cre expression patterns in whole mount and sectioned tissues confirmed the identification of neural crest-derived cells within tissue of non-neural crest origin. Specifically, in the thymus and choroid layer of the eye, which is a mesodermal derivative, perivascular pericytes are known to be of neural crest origin (Trost et al., 2013). Co-localization of signal in Sox10-cre;ROSATom tissues with PDGFRp antibody is consistent with a neural crest origin of ocular pericytes (Fig. 8). Neural crest cells also are known to contribute significantly to cardiac structures, in particular, the proximal aortic arch, ductus arteriosis, proximal origins of the coronary arteries, and to the semilunar and atrioventricular valves (Jiang et al., 2000; Pietri et al., 2003; Poelmann et al., 1998). Our Sox10-cre reporter line labels all of these cardiac structures (Fig. 5D and D’). Within the skin, Sox10-cre expression labels melanocytes residing in the base of hair follicles as well as sensory nerve fibers forming networks through the dermis (Fig. 5F–F”). We do not observe the aberrant labeling of keratinocytes lining the hair follicles, as others have reported (Debbache et al., 2018) who utilized the Sox10-cre transgenic line of (Matsuoka et al., 2005). It is notable that this latter construct replaced the entire coding region of Sox10. Thus, it is possible that aberrant keratinocyte labeling may result from the deletion of intronic Sox10 regulatory regions that normally repress expression in keratinocytes.
A thorough survey of tissues examined for Sox10-cre lineage labeling identified a few novel sites of Sox10 expression. In our analysis, we established that the adipose tissue surrounding the thymus is of neural crest origin (Fig. 6A–A″). The contribution of cranial neural crest to adipose tissue of the head and face is known (Billon et al., 2007; Deal et al., 2006), and given that the thymus forms from the second pharyngeal pouch, detaches, and then descends during embryological development, it is not surprising that this thymus-associated adipose tissue is derived from neural crest. Consistent with this, we did not observe any other labeling of adipose tissue in other anatomic locations by the Sox10-cre expression. Another site where we detected previously unappreciated Sox10-cre lineage labeling, became apparent while imaging the developing heart. At 14.5 dpc we document individual Sox10+ neural crest cells migrating over the epicardial surface of the heart concentrated over the right ventricle, that to our knowledge, has not previously been reported (Fig. 5D”). These cells are not appreciated in images from Wnt1-cre hearts of similar developmental ages presented in the literature (Nakamura et al., 2003; Poelmann et al., 2004). We were able to resolve these cells with the ROSATom reporter, although they were not evident with R26RlacZ reporter expression (Fig. 4 and data not shown). At this point, it is unclear what contributions these neural crest cells make to the heart. Future studies with this Sox10-cre line should prove informative as to whether these epicardial Sox10+ cells play a role in autonomic innervation, conduction system, or coronary vasculature. We also report here for the first time the presence of Sox10-positive cells within the center of intervertebral discs, surrounded by the disc annulus (Fig. 6B). These cells are large and vacuolated, fitting the description of nucleus pulposus cells, which are remnants of the embryological notochord (Ramesh et al., 2017). Others have reported that the migratory neural crest cell driver, P0-Cre, specifically labels the notochord at the 7-somite stage, whereas the premigratory neural crest driver, Wnt1-Cre, does not (Chen et al., 2017; Danielian et al., 1998; Yamauchi et al., 1999). We did not observe any labeling of nucleus pulposus cells by the Wnt1-cre reporter, despite finding that ~30% of cells within the nucleus pulposus are labeled by Sox10-cre activity at 17.5dpc (Fig. 6B’). Isolated nucleus pulposus progenitor cells can be differentiated into Schwann-like cells and neuronal cells and are strong candidates for peripheral nerve regeneration therapy (Ishii et al., 2017). Prior work by (Peck et al., 2017) identified a variety of transcription factors within the nucleus pulposus at 12.5 dpc by deploying a Shh-cre:ROSAYFF labeling strategy for RNASeq. This dataset did not report expression of Sox10 among the sampling of transcription factors detected at 12.5 dpc. However, the substantial interval between the analysis by Peck et al. at 12.5 dpc and our imaging of Sox10-cre labeling at 17.5 dpc likely accounts for this difference. Finally, we identify previously unappreciated expression of Sox10 in periurethal glands (Fig. 7). Comparison with Wnt1-cre labeling indicates that this domain of Sox10 expression is not derived from neural crest. The role of Sox10 in the male and female urethral glands remains to be determined in future studies.
While Sox10 is known primarily as a regulator of neural crest, the gene’s expression is not exclusive to neural crest and has previously been documented in populations of cells within the salivary and lacrimal glands (Deal et al., 2006). Myoepithelial cells of mammary glands also have the same expression of Sox10, and Sox10 is preferentially expressed in stem- and mesenchymal-like breast cancers (Dravis et al., 2015). We noted expression of our Sox10-cre line (but not Wnt1-cre) in mammary glands, as well as in urethral, lacrimal, parotid, and submandibular glands (Figs. 7 and 9). It has been reported that Sox10 is essential for the maintenance and differentiation of epithelial progenitors into the secretory units of mammary, lacrimal, and salivary glands (Athwal et al., 2019; Lombaert et al., 2013). Interestingly, Waardenburg syndrome patients with an underlying Sox10 mutation (Types 2 and 4) exhibit a high incidence of hypoplastic or absent lacrimal glands (78%) as well as hypoplastic parotid glands (85% (Elmaleh-Berges et al., 2013);). This suggests that Sox10 haploinsufficiency may have detrimental effects in Sox10+ structures, whether they are neural crest-derived or not. The Wnt1-cre:ROSATom reporter did not label any glandular structures (Figs. 7 and 9, except for occasional potential ectopic expression), making these Sox10+ tissues unlikely to be derived from neural crest. However, mesenchymal cells surrounding glandular tissue (Fig. 9) routinely express Wnt1, which is consistent with a previous report that submandibular gland mesenchyme is derived exclusively from cranial neural crest (Jaskoll et al., 2002).
Comparative mapping of expression patterns between the Sox10-cre and Sox10-cre/ERT2 transgenes led to the identification of a narrow temporal window in which Sox10 expression labels mesenchymal derivatives. We specifically observed expression in non-neuronal structures, such as the craniofacial bones and soft tissue, vertebral bodies, ribs, nucleus pulposus, tracheal cartilage, great vessels of the heart, digits, long bones of the limbs, and scapula. These sites are not labeled by Sox10-cre/ERT2:R26RlacZ or Sox10-cre/ERT2:ROSATom expression induced by tamoxifen administration at 9.5 dpc, indicating that they originate from Sox10 expression prior to the 9.5 dpc window when tamoxifen was administered and the subsequent brief interval over which Cre would be nuclear within Sox10+ cells (see Fig. 2). This result identifies a narrow window within which Sox10 is briefly on in mesenchymal progenitors and then down-regulates. Our observations are consistent with the temporal changes in Sox10 expression patterns reported by Soo et al., 2002, that documented Sox10 expression throughout the frontal nasal processes and maxillary regions (14 somite stage, 9.0 dpc) with gradual restriction to the cranial ganglia at slightly older stages (22 somite stage, 9.5 dpc). Matsuoka et al. (2005) also previously reported labeling of mesenchymal derivatives in the neck and shoulder using a Sox10-cre transgene that is consistent with the labeling of scapula we observed. We further document Sox10-cre lineage labeling in metacarpals and long bones for several transgenic founders (data not shown) and have reported similar labeling of digits by the Sox10-H2BVenus transgenic line (Corpening et al., 2011). Thus, it is not likely that this pattern is due to an integration site effect of a single transgene. The mesenchymal labeling produced by Sox10-cre that we document is more extensive than that reported by Matsouka et al., with clear labeling of digits, limb long bones, and the pelvis (Fig. 1B), and it appears similar to labeling of long bones evident in images of Sox10-LacZ knock-in embryos published by Britsch et al., 2001. The identification of Sox10 expression in these structures illustrates the advantages of comparing expression patterns between constitutive and inducible Cre lines, while our initial characterization of the Sox10-cre line sets the stage for future work analyzing the effects of Sox10 expression in long bones throughout development.
Our comparison of the traditional neural crest lineage tracer Wnt1-cre (Danielian et al., 1998) and our new Sox10-cre line indicates that careful attention must be paid to subtle differences in NC lineage tracers along the anterior-posterior axis. Prior work has found that Wnt1-Cre is highly efficient in anterior regions of the embryo with ~96% of all NCC labeled by Wnt1-cre:R26R in the head/trunk (Debbache et al., 2018; Hari et al., 2012). Despite this high efficiency, other groups have shown that even in trunk regions of the embryo, Wnt1-Cre does not comprehensively delete floxed alleles in cardiac neural crest (Olaopa et al., 2011) raising the possibility that Wnt1-Cre is not a comprehensive reporter of NC lineages. We observed that Wnt1-cre:ROSATom labeling in caudal regions of the embryo is much less efficient compared to our new Sox10-cre:ROSATom line. We specifically assessed the efficiency of each cre driver in labeling enteric neurons and glia (Fig. 10) and neurons within the pelvic ganglia of the lower urinary tract (Fig. 11). While there was no significant difference in the myenteric plexi of the duodenum, the Wnt1-cre driver labeled significantly fewer neurons and glia in the ileum and colon (Fig. 10). In the pelvic ganglia of Sox10-cre mice there was intimate association of the neural PGP9.5 marker with neuronal cells with rare exception, whereas in Wnt1-cre pelvic ganglia, there is clearly PGP9.5 labeling that is not associated with Wnt1-cre reporter expression (Fig. 11). These data indicate that Sox10-cre is more efficient than Wnt1-cre at labeling neural crest cells in sacral structures. These observations, together with a report that some phenotypes can be attributed to the ectopic expression of Wnt1 from the Wnt1-cre transgene (Lewis et al., 2013) , make our Sox10-cre line a good alternative with which to study neural crest cell fate mapping, particularly in caudal regions of the embryo.
Careful examination of lineage labeling by the Sox10-cre driver was essential to our effort to examine a neural crest origin for perivascular pericytes within the lower urinary tract. Prior studies have shown that pericytes arise from an extra-renal origin in the kidney (Asada et al., 2011), thus we considered the possibility that pericytes in the bladder might originate from neural crest. Despite extensive efforts using multiple antibodies for NG2 (data not shown) and PDGFRβ, we were unable to detect co-localization of these markers with Sox10-cre/ERT2:ROSATom labeling anywhere in the bladder body or pelvic ganglia (Fig. 8). As a result of our analysis, we conclude that perivascular pericytes within the bladder wall and pelvic ganglia are not derived from neural crest. It has been proposed that the embryonic origin of pericytes differs based on their anatomic location. Pericytes within the central nervous system and thymus arise from neural crest (Muller et al., 2008; Zachariah and Cyster, 2010), whereas pericytes in coelomic organs arise from mesothelial cells that delaminate and undergo epithelial-to-mesenchymal transformation and produce pericytes (Armulik et al., 2011). Our data support this hypothesis.
Our Sox10-cre/ERT2 mouse line aided by the tight temporal responsiveness of CreERT2 allows for future manipulation of Sox10+ lineages. Temporal approaches using carefully timed dosing of tamoxifen have been successfully used by others to control transgene expression in subsets of neural crest progenitor cells (Hatzistergos et al., 2015; He and Soriano, 2015). Strict expression of Sox10-cre/ERT2:ROSATom within enteric glial cells of myenteric plexi during the window of a single tamoxifen dose illustrates one population that could be manipulated for analyses of gene function. It is of specific interest that our induction experiments with Sox10-cre/ERT2:ROSATom using intestinal laminar muscle preparations did not detect any neuronal labeling since recent studies have reported ongoing generation of new enteric neurons within myenteric ganglia of adult animals (Kulkarni et al., 2017). While our data are consistent with prior literature demonstrating immunohistochemical evidence of restricted expression of Sox10 within enteric glia, they also imply that if new neurons are being generated in adult animals, they do not originate from cells are expressing Sox10 postnatally.
In summary, we present two thoroughly characterized Sox10-cre lines, one constitutive and the other inducible, that are ready tools with which to conduct temporal or cell type specific lineage tracing and manipulation. In addition to labeling all anticipated neural crest lineages, the new Sox10 lines offer a means to trace, isolate, and manipulate cells expressing Sox10 in developing epicardium, nucleus pulposus, choroid plexus, and glandular adult tissues that were previously unrecognized for Sox10 expression and that are now accessible as a result of these new tools. The superiority of Sox10-cre labeling over that of Wnt1-cre for sacral neural crest derivatives is an additional advantage we demonstrate. We believe the compilation of diverse expression sites documented here is the result of retaining regulatory regions that have been shown by others to be essential for Sox10 expression and we offer a summation of prior Sox10-cre driver lines with specifics of regulatory regions used for each to enable future comparative studies.
Key Resources Table
| Reagent or resource | Source | Identifier |
|---|---|---|
| Antibodies | ||
| Hu C/D | Gift of V. Lennon | HuC/D_Lennon; AB_2813895 |
| Phox2b | Gift of A. Patton | Cat# Phox2b, RRID:AB_2313690 |
| S100β | Dako | Z0311; AB_10013383 |
| Donkey anti-Human Cy3 | Jackson ImmunoResearch | 709-165-149; AB_2340535 |
| Donkey anti-Human Cy5 | Jackson ImmunoResearch | 709-605-149; AB_2340578 |
| Donkey anti-Rabbit Alexa 488 | Jackson ImmunoResearch | 711-545-152; AB_2313584 |
| Bacterial and Virus Strains | ||
| E. coli strain EL250 | Gift of N. Copeland | N/A |
| Sox10WT28O11 BAC | https://bacpacresources.org | RP23-28O11 |
| Chemicals, Peptides, and Recombinant Proteins | ||
| Tamoxifen (use within two years of receipt) | Sigma | Cat. #T5648 |
| Rodent Diet 5LOD-irradiated chow (Purina) | www.labdiet.com | Cat. #5L0D |
| Envigo Global Diet | www.envigo.com | Teklad 2919 |
| Experimental Models: Organisms/Strains | ||
| Mouse: Tg(Sox10-cre)1Sout | This paper | RRID: MGI:5897484 |
| Mouse: Tg(Sox10-cre/ERT2)1Sout | This paper | RRID: MGI:6201041 |
| Mouse: B6.129S-Gt(ROSA)26Sortm1Sor | The Jackson Laboratory | Stock #2073; RRID: MGI:1890203 |
| Mouse: B6.Cg-Gt(ROSA)26Sortm9(CAG-tdTomato/Hze/J | The Jackson Laboratory | Stock #7914; RRID: MGI:3809523 |
| Mouse: B6.Cg-H2az2Tg(Wnt1-cre)11Rth | The Jackson Laboratory | Stock #9107; RRID: MGI:2386570 |
| Mouse: C3HeB/FeJ strain | The Jackson Laboratory | Stock #000658 |
| Oligonucleotides | ||
| Sox10-cre and Sox10-cre/ERT2 Sp6 Forward: GTTTTTTGCGATCTGCCGTTTC | This paper | N/A |
| Sox10-cre and Sox10-cre/ERT2 Sp6 Reverse: GGCACTTTCATGTTATCTGAGG | This paper | N/A |
| Sox10-cre and Sox10-cre/ERT2 T7 Forward: TCGAGCTTGACATTGTAGGAC | This paper | N/A |
| Sox10-cre and Sox10-cre/ERT2 T7 Reverse: AAGAGCAAGCCTTGGAACTG | This paper | N/A |
| Sox10-cre Internal Forward: GCGGCATGGTGCAAGTTGAAT | This paper | N/A |
| Sox10-cre Internal Reverse: CGTTCACCGGCATCAACGTTT | This paper | N/A |
| Sox10-cre/ERT2 Internal Forward: ATTCTCCCACCGTCAGTACG | This paper | N/A |
| Sox10-cre/ERT2 Internal Reverse: CGTTTTCTGAGCATACCTGGA | This paper | N/A |
| Wnt1-cre Forward: ATTCTCCCACCGTCAGTACG | This paper | N/A |
| Wnt1-cre Reverse: CGTTTTCTGAGCATACCTGGA | This paper | N/A |
| Recombinant DNA | ||
| pBS/RIP-cre-hGH | Gift of M. Magnuson | N/A |
| pcre/ERT2 plasmid | Gift of P. Chambon | N/A |
| Software and Algorithms | ||
| QImaging software | Zeiss | |
| SimplePCI version 6.6.0.16 imaging software | Hamamatsu | |
| LSM Image Browser Software | Zeiss | |
| Other | ||
| Transgenic Animal Model Core | University of Michigan | Dr. T. Saunders |
| Cell Imaging Shared Resource Core | Vanderbilt University | Dr. M. Tyska |
Acknowledgements
We thank Dr. Pierre Chambon for the pGS-Cre-ERT2 plasmid; Dr. Mark Magnuson for providing the pBS/RIP-Cre-hGH plasmid; Dr. Neil Copeland for the EL250 E. coli strain and BAC recombineering methods; Dr. Vanda Lennon for generously providing HuC/D antibody; and Dr. Alexandre Pattyn for generously providing Phox2b antibody. We would also like to thank Dr. Thomas Saunders for outstanding support in generation of BAC transgenics at the University of Michigan Transgenic Animal Model Core. We gratefully acknowledge and thank Dr. Sam Wells and the support staff of the Cell Imaging Shared Resource Core at Vanderbilt for advice and assistance in confocal imaging. The Cell Imaging Shared Resource Core is supported by NIH grants CA68485, DK20593, P30DK058404, DK59637 and EY08126. This work was supported by funding from a US National Institutes of Health grants from NIDDK (R01-DK078158; U01-DK110804) and March of Dimes Research Award (FY-12-450) as well Core scholarship funds provided by the Vanderbilt University Medical Center’s Digestive Disease Research Center supported by NIH grant P30DK058404 to E.M.S2. J.C.R. was supported by a Vanderbilt Brain Institute Scholar’s Award and A.E.M. was supported by the Program in Neurogenomics (T32 MH065215).
References
- Anderson RM, Stottmann RW, Choi M, Klingensmith J, 2006. Endogenous bone morphogenetic protein antagonists regulate mammalian neural crest generation and survival. Dev. Dynam 235, 2507–2520. [DOI] [PMC free article] [PubMed] [Google Scholar]
- Antonellis A, Bennett WR, Menheniott TR, Prasad AB, Lee-Lin SQ, Program NCS, Green ED, Paisley D, Kelsh RN, Pavan WJ, Ward A, 2006. Deletion of long-range sequences at Sox10 compromises developmental expression in a mouse model of Waardenburg-Shah (WS4) syndrome. Hum. Mol. Genet 15, 259–271. [DOI] [PubMed] [Google Scholar]
- Aoto K, Sandell LL, Butler Tjaden NE, Yuen KC, Watt KE, Black BL, Durnin M, Trainor PA, 2015. Mef2c-F10N enhancer driven beta-galactosidase (LacZ) and Cre recombinase mice facilitate analyses of gene function and lineage fate in neural crest cells. Dev. Biol 402, 3–16. [DOI] [PMC free article] [PubMed] [Google Scholar]
- Armulik A, Genove G, Betsholtz C, 2011. Pericytes: developmental, physiological, and pathological perspectives, problems, and promises. Dev. Cell 21, 193–215. [DOI] [PubMed] [Google Scholar]
- Asada N, Takase M, Nakamura J, Oguchi A, Asada M, Suzuki N, Yamamura K, Nagoshi N, Shibata S, Rao TN, Fehling HJ, Fukatsu A, Minegishi N, Kita T, Kimura T, Okano H, Yamamoto M, Yanagita M, 2011. Dysfunction of fibroblasts of extrarenal origin underlies renal fibrosis and renal anemia in mice. J. Clin. Invest 121, 3981–3990. [DOI] [PMC free article] [PubMed] [Google Scholar]
- Athwal HK, Murphy G 3rd, Tibbs E, Cornett A, Hill E, Yeoh K, Berenstein E, Hoffman MP, Lombaert IMA, 2019. Sox10 regulates plasticity of epithelial progenitors toward secretory units of exocrine glands. Stem Cell Reports 12, 366–380. [DOI] [PMC free article] [PubMed] [Google Scholar]
- Ballim RD, Nagao Y, Kelsh RN, 2019. Live imaging of neural crest and pigment cells and transient transgenic manipulation of gene activity. Methods Mol Biol 1976 195–206. [DOI] [PubMed] [Google Scholar]
- Bergers G, Song S, 2005. The role of pericytes in blood-vessel formation and maintenance. Neuro Oncol. 7, 452–464. [DOI] [PMC free article] [PubMed] [Google Scholar]
- Billon N, Iannarelli P, Monteiro MC, Glavieux-Pardanaud C, Richardson WD, Kessaris N, Dani C, Dupin E, 2007. The generation of adipocytes by the neural crest. Development 134, 2283–2292. [DOI] [PMC free article] [PubMed] [Google Scholar]
- Birbrair A, Zhang T, Wang ZM, Messi ML, Mintz A, Delbono O, 2015. Pericytes at the intersection between tissue regeneration and pathology. Clin. Sci. (Lond.) 128, 81–93. [DOI] [PMC free article] [PubMed] [Google Scholar]
- Boesmans W, Lasrado R, Vanden Berghe P, Pachnis V, 2015. Heterogeneity and phenotypic plasticity of glial cells in the mammalian enteric nervous system. Glia 63, 229–241. [DOI] [PubMed] [Google Scholar]
- Boyle S, Misfeldt A, Chandler KJ, Deal KK, Southard-Smith EM, Mortlock DP, Baldwin HS, de Caestecker M, 2008. Fate mapping using Cited1-CreERT2 mice demonstrates that the cap mesenchyme contains self-renewing progenitor cells and gives rise exclusively to nephronic epithelia. Dev. Biol 313, 234–245. [DOI] [PMC free article] [PubMed] [Google Scholar]
- Britsch S, Goerich DE, Riethmacher D, Peirano RI, Rossner M, Nave KA, Birchmeier C, Wegner M, 2001. The transcription factor Sox10 is a key regulator of peripheral glial development. Genes Dev. 15, 66–78. [DOI] [PMC free article] [PubMed] [Google Scholar]
- Brouwers B, de Faudeur G, Osipovich AB, Goyvaerts L, Lemaire K, Boesmans L, Cauwelier EJ, Granvik M, Pruniau VP, Van Lommel L, Van Schoors J, Stancill JS, Smolders I, Goffin V, Binart N, in’t Veld P, Declercq J, Magnuson MA, Creemers JW, Schuit F, Schraenen A, 2014. Impaired islet function in commonly used transgenic mouse lines due to human growth hormone minigene expression. Cell Metabol. 20, 979–990. [DOI] [PMC free article] [PubMed] [Google Scholar]
- Camper SA, Saunders TL, Kendall SK, Keri RA, Seasholtz AF, Gordon DF, Birkmeier TS, Keegan CE, Karolyi IJ, Roller ML, et al. , 1995. Implementing transgenic and embryonic stem cell technology to study gene expression, cell-cell interactions and gene function. Biol. Reprod 52, 246–257. [DOI] [PubMed] [Google Scholar]
- Chandler RL, Chandler KJ, McFarland KA, Mortlock DP, 2007. Bmp2 transcription in osteoblast progenitors is regulated by a distant 3’ enhancer located 156.3 kilobases from the promoter. Mol. Cell Biol 27, 2934–2951. [DOI] [PMC free article] [PubMed] [Google Scholar]
- Chen G, Ishan M, Yang J, Kishigami S, Fukuda T, Scott G, Ray MK, Sun C, Chen SY, Komatsu Y, Mishina Y, Liu HX, 2017. Specific and spatial labeling of P0-Cre versus Wnt1-Cre in cranial neural crest in early mouse embryos. Genesis 55. [DOI] [PMC free article] [PubMed] [Google Scholar]
- Choi HMT, Schwarzkopf M, Fornace ME, Acharya A, Artavanis G, Stegmaier J, Cunha A, Pierce NA, 2018. Third-generation in situ hybridization chain reaction: multiplexed, quantitative, sensitive, versatile, robust. Development 145. [DOI] [PMC free article] [PubMed] [Google Scholar]
- Corpening JC, Cantrell VA, Deal KK, Southard-Smith EM, 2008. A Histone2BCerulean BAC transgene identifies differential expression of Phox2b in migrating enteric neural crest derivatives and enteric glia. Dev. Dynam 237, 1119–1132. [DOI] [PMC free article] [PubMed] [Google Scholar]
- Corpening JC, Deal KK, Cantrell VA, Skelton SB, Buehler DP, Southard-Smith EM, 2011. Isolation and live imaging of enteric progenitors based on Sox10-Histone2BVenus transgene expression. Genesis 49, 599–618. [DOI] [PMC free article] [PubMed] [Google Scholar]
- Cory AT, Boyer A, Pilon N, Lussier JG, Silversides DW, 2007. Presumptive pre-Sertoli cells express genes involved in cell proliferation and cell signalling during a critical window in early testis differentiation. Mol. Reprod. Dev 74, 1491–1504. [DOI] [PubMed] [Google Scholar]
- Crabtree JS, Scacheri PC, Ward JM, McNally SR, Swain GP, Montagna C, Hager JH, Hanahan D, Edlund H, Magnuson MA, Garrett-Beal L, Burns AL, Ried T, Chandrasekharappa SC, Marx SJ, Spiegel AM, Collins FS, 2003. Of mice and MEN1: insulinomas in a conditional mouse knockout. Mol. Cell Biol 23, 6075–6085. [DOI] [PMC free article] [PubMed] [Google Scholar]
- Danielian PS, Muccino D, Rowitch DH, Michael SK, McMahon AP, 1998. Modification of gene activity in mouse embryos in utero by a tamoxifen-inducible form of Cre recombinase. Curr. Biol 8, 1323–1326. [DOI] [PubMed] [Google Scholar]
- de Faudeur G, Brouwers B, Schuit F, Creemers JWM, Ramos-Molina B, 2018. Transgenic artifacts caused by passenger human growth hormone. Trends Endocrinol Metab 29, 670–674. [DOI] [PubMed] [Google Scholar]
- Deal KK, Cantrell VA, Chandler RL, Saunders TL, Mortlock DP, Southard-Smith EM, 2006. Distant regulatory elements in a Sox10-beta GEO BAC transgene are required for expression of Sox10 in the enteric nervous system and other neural crest-derived tissues. Dev. Dynam 235, 1413–1432. [DOI] [PubMed] [Google Scholar]
- Debbache J, Parfejevs V, Sommer L, 2018. Cre-driver lines used for genetic fate mapping of neural crest cells in the mouse: an overview. Genesis 56, e23105. [DOI] [PMC free article] [PubMed] [Google Scholar]
- Dietrich P, Shanmugasundaram R, Shuyu E, Dragatsis I, 2009. Congenital hydrocephalus associated with abnormal subcommissural organ in mice lacking huntingtin in Wnt1 cell lineages. Hum. Mol. Genet 18, 142–150. [DOI] [PMC free article] [PubMed] [Google Scholar]
- Dravis C, Spike BT, Harrell JC, Johns C, Trejo CL, Southard-Smith EM, Perou CM, Wahl GM, 2015. Sox10 regulates stem/progenitor and mesenchymal cell states in mammary epithelial cells. Cell Rep. 12, 2035–2048. [DOI] [PMC free article] [PubMed] [Google Scholar]
- Dutton JR, Antonellis A, Carney TJ, Rodrigues FS, Pavan WJ, Ward A, Kelsh RN, 2008. An evolutionarily conserved intronic region controls the spatiotemporal expression of the transcription factor Sox10. BMC Dev. Biol 8, 105. [DOI] [PMC free article] [PubMed] [Google Scholar]
- Elmaleh-Berges M, Baumann C, Noel-Petroff N, Sekkal A, Couloigner V, Devriendt K, Wilson M, Marlin S, Sebag G, Pingault V, 2013. Spectrum of temporal bone abnormalities in patients with Waardenburg syndrome and SOX10 mutations. AJNR Am J Neuroradiol 34, 1257–1263. [DOI] [PMC free article] [PubMed] [Google Scholar]
- Etchevers HC, Vincent C, Le Douarin NM, Couly GF, 2001. The cephalic neural crest provides pericytes and smooth muscle cells to all blood vessels of the face and forebrain. Development 128, 1059–1068. [DOI] [PubMed] [Google Scholar]
- Feil R, Wagner J, Metzger D, Chambon P, 1997. Regulation of Cre recombinase activity by mutated estrogen receptor ligand-binding domains. Biochem. Biophys. Res. Commun 237, 752–757. [DOI] [PubMed] [Google Scholar]
- Foster K, Sheridan J, Veiga-Fernandes H, Roderick K, Pachnis V, Adams R, Blackburn C, Kioussis D, Coles M, 2008. Contribution of neural crest-derived cells in the embryonic and adult thymus. J. Immunol 180, 3183–3189. [DOI] [PubMed] [Google Scholar]
- Gershon MD, Ross LL, 1966. Radioisotopic studies of the binding, exchange, and distribution of 5-hydroxytryptamine synthesized from its radioactive precursor. J Physiol 186, 451–476. [DOI] [PMC free article] [PubMed] [Google Scholar]
- Hari L, Miescher I, Shakhova O, Suter U, Chin L, Taketo M, Richardson WD, Kessaris N, Sommer L, 2012. Temporal control of neural crest lineage generation by Wnt/beta-catenin signaling. Development 139, 2107–2117. [DOI] [PubMed] [Google Scholar]
- Hatzistergos KE, Takeuchi LM, Saur D, Seidler B, Dymecki SM, Mai JJ, White IA, Balkan W, Kanashiro-Takeuchi RM, Schally AV, Hare JM, 2015. cKit+ cardiac progenitors of neural crest origin. Proc. Natl. Acad. Sci. U. S. A 112, 13051–13056. [DOI] [PMC free article] [PubMed] [Google Scholar]
- Hayashi S, McMahon AP, 2002. Efficient recombination in diverse tissues by a tamoxifen-inducible form of Cre: a tool for temporally regulated gene activation/inactivation in the mouse. Dev. Biol 244, 305–318. [DOI] [PubMed] [Google Scholar]
- He F, Soriano P, 2015. Sox10ER(T2) CreER(T2) mice enable tracing of distinct neural crest cell populations. Dev. Dynam 244, 1394–1403. [DOI] [PMC free article] [PubMed] [Google Scholar]
- Huang J, Cheng L, Li J, Chen M, Zhou D, Lu MM, Proweller A, Epstein JA, Parmacek MS, 2008. Myocardin regulates expression of contractile genes in smooth muscle cells and is required for closure of the ductus arteriosus in mice. J. Clin. Invest 118, 515–525. [DOI] [PMC free article] [PubMed] [Google Scholar]
- Huang T, Liu Y, Huang M, Zhao X, Cheng L, 2010. Wnt1-cre-mediated conditional loss of Dicer results in malformation of the midbrain and cerebellum and failure of neural crest and dopaminergic differentiation in mice. J. Mol. Cell Biol 2, 152–163. [DOI] [PubMed] [Google Scholar]
- Indra AK, Warot X, Brocard J, Bornert JM, Xiao JH, Chambon P, Metzger D, 1999. Temporally-controlled site-specific mutagenesis in the basal layer of the epidermis: comparison of the recombinase activity of the tamoxifen-inducible Cre-ER(T) and Cre-ER(T2) recombinases. Nucleic Acids Res. 27, 4324–4327. [DOI] [PMC free article] [PubMed] [Google Scholar]
- Ishii T, Sakai D, Schol J, Nakai T, Suyama K, Watanabe M, 2017. Sciatic nerve regeneration by transplantation of in vitro differentiated nucleus pulposus progenitor cells. Regen. Med 12, 365–376. [DOI] [PubMed] [Google Scholar]
- Jaskoll T, Zhou YM, Chai Y, Makarenkova HP, Collinson JM, West JD, Hajihosseini MK, Lee J, Melnick M, 2002. Embryonic submandibular gland morphogenesis: stage-specific protein localization of FGFs, BMPs, Pax6 and Pax9 in normal mice and abnormal SMG phenotypes in FgfR2-IIIc(+/Delta), BMP7(−/−) and Pax6(−/−) mice. Cells Tissues Organs 170, 83–98. [DOI] [PubMed] [Google Scholar]
- Jiang X, Rowitch DH, Soriano P, McMahon AP, Sucov HM, 2000. Fate of the mammalian cardiac neural crest. Development 127, 1607–1616. [DOI] [PubMed] [Google Scholar]
- Kaufman MH, 1995. The Atlas of Mouse Development. Academic Press, San Diego. [Google Scholar]
- Korn J, Christ B, Kurz H, 2002. Neuroectodermal origin of brain pericytes and vascular smooth muscle cells. J. Comp. Neurol 442, 78–88. [DOI] [PubMed] [Google Scholar]
- Kuhlbrodt K, Herbarth B, Sock E, Hermans-Borgmeyer I, Wegner M, 1998. Sox10, a novel transcriptional modulator in glial cells. J. Neurosci 18, 237–250. [DOI] [PMC free article] [PubMed] [Google Scholar]
- Kulesa PM, Fraser SE, 1998. Neural crest cell dynamics revealed by time-lapse video microscopy of whole embryo chick explant cultures. Dev. Biol 204, 327–344. [DOI] [PubMed] [Google Scholar]
- Kulkarni S, Micci MA, Leser J, Shin C, Tang SC, Fu YY, Liu L, Li Q, Saha M, Li C, Enikolopov G, Becker L, Rakhilin N, Anderson M, Shen X, Dong X, Butte MJ, Song H, Southard-Smith EM, Kapur RP, Bogunovic M, Pasricha PJ, 2017. Adult enteric nervous system in health is maintained by a dynamic balance between neuronal apoptosis and neurogenesis. Proc. Natl. Acad. Sci. U. S. A 114, E3709–E3718. [DOI] [PMC free article] [PubMed] [Google Scholar]
- Laranjeira C, Sandgren K, Kessaris N, Richardson W, Potocnik A, Vanden Berghe P, Pachnis V, 2011. Glial cells in the mouse enteric nervous system can undergo neurogenesis in response to injury. J. Clin. Invest 121, 3412–3424. [DOI] [PMC free article] [PubMed] [Google Scholar]
- Le Douarin N, 1973. A biological cell labeling technique and its use in experimental embryology. Dev. Biol 30, 217–222. [DOI] [PubMed] [Google Scholar]
- Le Douarin NM, Dupin E, 2018. The beginnings of the neural crest. Dev. Biol 444 (Suppl. 1), S3–S13. [DOI] [PubMed] [Google Scholar]
- Lee EC, Yu D, Martinez de Velasco J, Tessarollo L, Swing DA, Court DL, Jenkins NA, Copeland NG, 2001. A highly efficient Escherichia coli-based chromosome engineering system adapted for recombinogenic targeting and subcloning of BAC DNA. Genomics 73, 56–65. [DOI] [PubMed] [Google Scholar]
- Lewis AE, Vasudevan HN, O’Neill AK, Soriano P, Bush JO, 2013. The widely used Wnt1-Cre transgene causes developmental phenotypes by ectopic activation of Wnt signaling. Dev. Biol 379, 229–234. [DOI] [PMC free article] [PubMed] [Google Scholar]
- Lombaert IM, Abrams SR, Li L, Eswarakumar VP, Sethi AJ, Witt RL,Hoffman MP, 2013. Combined KIT and FGFR2b signaling regulates epithelial progenitor expansion during organogenesis. Stem Cell Reports 1, 604–619. [DOI] [PMC free article] [PubMed] [Google Scholar]
- Madisen L, Garner AR, Shimaoka D, Chuong AS, Klapoetke NC, Li L, van der Bourg A, Niino Y, Egolf L, Monetti C, Gu H, Mills M, Cheng A, Tasic B, Nguyen TN, Sunkin SM, Benucci A, Nagy A, Miyawaki A, Helmchen F, Empson RM, Knopfel T, Boyden ES, Reid RC, Carandini M, Zeng H, 2015. Transgenic mice for intersectional targeting of neural sensors and effectors with high specificity and performance. Neuron 85, 942–958. [DOI] [PMC free article] [PubMed] [Google Scholar]
- Madisen L, Zwingman TA, Sunkin SM, Oh SW, Zariwala HA, Gu H, Ng LL, Palmiter RD, Hawrylycz MJ, Jones AR, Lein ES, Zeng H, 2010. A robust and high-throughput Cre reporting and characterization system for the whole mouse brain. Nat. Neurosci 13, 133–140. [DOI] [PMC free article] [PubMed] [Google Scholar]
- Mangale VS, Hirokawa KE, Satyaki PR, Gokulchandran N, Chikbire S, Subramanian L, Shetty AS, Martynoga B, Paul J, Mai MV, Li Y, Flanagan LA, Tole S, Monuki ES, 2008. Lhx2 selector activity specifies cortical identity and suppresses hippocampal organizer fate. Science 319, 304–309. [DOI] [PMC free article] [PubMed] [Google Scholar]
- Matsuoka T, Ahlberg PE, Kessaris N, Iannarelli P, Dennehy U, Richardson WD, McMahon AP, Koentges G, 2005. Neural crest origins of the neck and shoulder. Nature 436, 347–355. [DOI] [PMC free article] [PubMed] [Google Scholar]
- McKenzie IA, Ohayon D, Li H, de Faria JP, Emery B, Tohyama K, Richardson WD, 2014. Motor skill learning requires active central myelination. Science 346, 318–322. [DOI] [PMC free article] [PubMed] [Google Scholar]
- McLennan R, Kulesa PM, 2019. In ovo electroporation of plasmid DNA and morpholinos into specific tissues during early embryogenesis. Methods Mol Biol 1976 71–82. [DOI] [PMC free article] [PubMed] [Google Scholar]
- Muller SM, Stolt CC, Terszowski G, Blum C, Amagai T, Kessaris N, Iannarelli P, Richardson WD, Wegner M, Rodewald HR, 2008. Neural crest origin of perivascular mesenchyme in the adult thymus. J. Immunol 180, 5344–5351. [DOI] [PubMed] [Google Scholar]
- Nakamura T, Sano M, Songyang Z, Schneider MD, 2003. A Wnt- and beta -catenin-dependent pathway for mammalian cardiac myogenesis. Proc. Natl. Acad. Sci. U. S. A 100, 5834–5839. [DOI] [PMC free article] [PubMed] [Google Scholar]
- Olaopa M, Zhou HM, Snider P, Wang J, Schwartz RJ, Moon AM, Conway SJ, 2011. Pax3 is essential for normal cardiac neural crest morphogenesis but is not required during migration nor outflow tract septation. Dev. Biol 356, 308–322. [DOI] [PMC free article] [PubMed] [Google Scholar]
- Orban PC, Chui D, Marth JD, 1992. Tissue- and site-specific DNA recombination in transgenic mice. Proc. Natl. Acad. Sci. U. S. A 89, 6861–6865. [DOI] [PMC free article] [PubMed] [Google Scholar]
- Paratore C, Eichenberger C, Suter U, Sommer L, 2002. Sox10 haploinsufficiency affects maintenance of progenitor cells in a mouse model of Hirschsprung disease. Hum. Mol. Genet 11, 3075–3085. [DOI] [PubMed] [Google Scholar]
- Peck SH, McKee KK, Tobias JW, Malhotra NR, Harfe BD, Smith LJ, 2017. Whole transcriptome analysis of notochord-derived cells during embryonic formation of the nucleus pulposus. Sci. Rep 7, 10504. [DOI] [PMC free article] [PubMed] [Google Scholar]
- Peter Lopez T, Fan CM, 2012. A transgenic Tbx6;CreERT2 line for inducible gene manipulation in the presomitic mesoderm. Genesis 50, 490–495. [DOI] [PMC free article] [PubMed] [Google Scholar]
- Pfaltzgraff ER, Shelton EL, Galindo CL, Nelms BL, Hooper CW, Poole SD, Labosky PA, Bader DM, Reese J, 2014. Embryonic domains of the aorta derived from diverse origins exhibit distinct properties that converge into a common phenotype in the adult. J. Mol. Cell. Cardiol 69, 88–96. [DOI] [PMC free article] [PubMed] [Google Scholar]
- Pietri T, Eder O, Blanche M, Thiery JP, Dufour S, 2003. The human tissue plasminogen activator-Cre mouse: a new tool for targeting specifically neural crest cells and their derivatives in vivo. Dev. Biol 259, 176–187. [DOI] [PubMed] [Google Scholar]
- Poelmann RE, Jongbloed MR, Molin DG, Fekkes ML, Wang Z, Fishman GI, Doetschman T, Azhar M, Gittenberger-de Groot AC, 2004. The neural crest is contiguous with the cardiac conduction system in the mouse embryo: a role in induction? Anat. Embryol 208, 389–393. [DOI] [PubMed] [Google Scholar]
- Poelmann RE, Mikawa T, Gittenberger-de Groot AC, 1998. Neural crest cells in outflow tract septation of the embryonic chicken heart: differentiation and apoptosis. Dev. Dynam 212, 373–384. [DOI] [PubMed] [Google Scholar]
- Postic C, Shiota M, Niswender KD, Jetton TL, Chen Y, Moates JM, Shelton KD, Lindner J, Cherrington AD, Magnuson MA, 1999. Dual roles for glucokinase in glucose homeostasis as determined by liver and pancreatic beta cell-specific gene knock-outs using Cre recombinase. J. Biol. Chem 274, 305–315. [DOI] [PubMed] [Google Scholar]
- Ramesh T, Nagula SV, Tardieu GG, Saker E, Shoja M, Loukas M, Oskoulan RJ, Tubbs RS, 2017. Update on the notochord including its embryology, molecular development, and pathology: a primer for the clinician. Cureus 9 (4), e1137 10.7759/cureus.1137. [DOI] [PMC free article] [PubMed] [Google Scholar]
- Reiprich S, Stolt CC, Schreiner S, Parlato R, Wegner M, 2008. SoxE proteins are differentially required in mouse adrenal gland development. Mol. Biol. Cell 19, 1575–1586. [DOI] [PMC free article] [PubMed] [Google Scholar]
- Simon C, Lickert H, Gotz M, Dimou L, 2012. Sox10-iCreERT2 : a mouse line to inducibly trace the neural crest and oligodendrocyte lineage. Genesis 50, 506–515. [DOI] [PubMed] [Google Scholar]
- Soo K, O’Rourke MP, Khoo PL, Steiner KA, Wong N, Behringer RR, Tam PP, 2002. Twist function is required for the morphogenesis of the cephalic neural tube and the differentiation of the cranial neural crest cells in the mouse embryo. Dev. Biol 247, 251–270. [DOI] [PubMed] [Google Scholar]
- Southard-Smith EM, 2020. Expression of Sox10-cre transgenes in the lower urinary tract. GUDMAP Consortium; 10.25548/17-BS66. [DOI] [Google Scholar]
- Southard-Smith EM, Kos L, Pavan WJ, 1998. Sox10 mutation disrupts neural crest development in Dom Hirschsprung mouse model. Nat. Genet 18, 60–64. [DOI] [PubMed] [Google Scholar]
- Stark DA, Kasemeier-Kulesa JC, Kulesa PM, 2008. Photoactivation cell labeling for cell tracing in avian development. Cold Spring Harb. Protoc 10.1101/pdb.prot4975. [DOI] [PubMed] [Google Scholar]
- Stine ZE, Huynh JL, Loftus SK, Gorkin DU, Salmasi AH, Novak T, Purves T, Miller RA, Antonellis A, Gearhart JP, Pavan WJ, McCallion AS, 2009. Oligodendroglial and pan-neural crest expression of Cre recombinase directed by Sox10 enhancer. Genesis 47, 765–770. [DOI] [PMC free article] [PubMed] [Google Scholar]
- Stolt CC, Rehberg S, Ader M, Lommes P, Riethmacher D, Schachner M, Bartsch U, Wegner M, 2002. Terminal differentiation of myelin-forming oligodendrocytes depends on the transcription factor Sox10. Genes Dev. 16, 165–170. [DOI] [PMC free article] [PubMed] [Google Scholar]
- Trost A, Schroedl F, Lange S, Rivera FJ, Tempfer H, Korntner S, Stolt CC, Wegner M, Bogner B, Kaser-Eichberger A, Krefft K, Runge C, Aigner L, Reitsamer HA, 2013. Neural crest origin of retinal and choroidal pericytes. Invest. Ophthalmol. Vis. Sci 54, 7910–7921. [DOI] [PubMed] [Google Scholar]
- Vassar R, Fuchs E, 1991. Transgenic mice provide new insights into the role of TGF-alpha during epidermal development and differentiation. Genes Dev. 5, 714–727. [DOI] [PubMed] [Google Scholar]
- Wang X, Chan AK, Sham MH, Burns AJ, Chan WY, 2011. Analysis of the sacral neural crest cell contribution to the hindgut enteric nervous system in the mouse embryo. Gastroenterology 141, 992–1002 e1001–1006. [DOI] [PubMed] [Google Scholar]
- Wiese CB, Deal KK, Ireland SJ, Cantrell VA, Southard-Smith EM, 2017Migration pathways of sacral neural crest during development of lower urogenital tract innervation. Dev. Biol 429, 356–369. [DOI] [PMC free article] [PubMed] [Google Scholar]
- Wong CE, Paratore C, Dours-Zimmermann MT, Rochat A, Pietri T, Suter U, Zimmermann DR, Dufour S, Thiery JP, Meijer D, Beermann F, Barrandon Y, Sommer L, 2006. Neural crest-derived cells with stem cell features can be traced back to multiple lineages in the adult skin. J. Cell Biol 175, 1005–1015. [DOI] [PMC free article] [PubMed] [Google Scholar]
- Wysolmerski JJ, Broadus AE, Zhou J, Fuchs E, Milstone LM, Philbrick WM, 1994. Overexpression of parathyroid hormone-related protein in the skin of transgenic mice interferes with hair follicle development. Proc. Natl. Acad. Sci. U. S. A 91, 1133–1137. [DOI] [PMC free article] [PubMed] [Google Scholar]
- Yamauchi Y, Abe K, Mantani A, Hitoshi Y, Suzuki M, Osuzu F, Kuratani S, Yamamura K, 1999. A novel transgenic technique that allows specific marking of the neural crest cell lineage in mice. Dev. Biol 212, 191–203. [DOI] [PubMed] [Google Scholar]
- Zachariah MA, Cyster JG, 2010. Neural crest-derived pericytes promote egress of mature thymocytes at the corticomedullary junction. Science 328, 1129–1135. [DOI] [PMC free article] [PubMed] [Google Scholar]
- Zohn IE, Anderson KV, Niswander L, 2007. The Hectd1 ubiquitin ligase is required for development of the head mesenchyme and neural tube closure. Dev. Biol 306, 208–221. [DOI] [PMC free article] [PubMed] [Google Scholar]