

SUMMARY
Endogenous sleep and general anesthesia are distinct states that share similar traits. Of particular interest to neuroscience is the loss of consciousness that accompanies both states. Multiple lines of evidence demonstrate that general anesthetics can coopt the neural circuits regulating arousal to produce unconsciousness. However, controversy remains as to whether the neural circuits, and more specifically, the same neurons shaping sleep and wakefulness actually do influence the anesthetic state in vivo. Hypothalamic preoptic area (POA) neurons are intimately involved in modulating spontaneous and anesthetic-induced changes in arousal. Nevertheless, recent work suggests that POA GABAergic or glutamatergic neurons capable of regulating endogenous sleep fail to influence the onset or dissipation of anesthesia. We hypothesized that the POA’s broad neuronal diversity could mask convergent roles of a subset of neurons in regulating both arousal and anesthesia. Contrary to a previously published report, we show that chemogenetic activation of POA Tac1 neurons obliterates both NREM and REM sleep, strongly consolidating the waking state for hours, even during a period of elevated sleep drive. Moreover, chemogenetic activation of Tac1 POA neurons stabilizes the wake state against both isoflurane- and sevoflurane-induced unconsciousness. Tac1 activated mice display a partial resistance to entering isoflurane anesthesia and a more pronounced ability to exit both isoflurane and sevoflurane induced-unconscious states. We conclude that POA Tac1 neurons can potently reinforce arousal both against endogenous and drug-induced unconscious states. POA Tac1 neurons thus add causal support for the involvement of arousal-regulating systems in the state of general anesthesia.
Keywords: Arousal, wakefulness, consciousness, sleep, anesthesia, isoflurane, sevoflurane, preoptic area, DREADD, tachykinin
eTOC Blurb
The degree to which the same neurons modulate arousal in both sleep and anesthesia is unclear. Reitz et al. describe a population of Tac1-expressing POA neurons that when activated, reinforce arousal against both natural sleep and anesthetic-induced unconsciousness; confirming that neurons modulating endogenous arousal shape states of anesthesia.
INTRODUCTION
Behavioral states of arousal are controlled by a network of nuclei spread throughout the brain. One of the earliest studied regions was the hypothalamus, whose role in sleep and wake regulation was first uncovered by Constantin von Economo during a viral pandemic in the early 20th century [1]. Since then, the hypothalamus is increasingly recognized as a loose confederation of autonomous neurons that regulate many essential social and homeostatic functions [2–7], including sleep and wake [8]. Specifically, the preoptic area of the hypothalamus (POA) is known to modulate arousal in both natural (sleep and wake) [9–14] as well as drug-induced (anesthetic-induced unconsciousness) states [15–22]. However, the degree to which the same population of neurons modulates arousal in both sleep and anesthesia is unclear.
A major obstacle to understanding arousal state regulation by the POA is the inherent heterogeneity of the region, with sleep-active neurons existing alongside wake-active and arousal state-indifferent neurons [23–26]. Previous work examining arousal state regulation in natural and anesthetic-induced states has largely focused on the role of two broad classes of neurons: the inhibitory GABAergic/galaninergic and excitatory glutamatergic neurons. However, single-cell RNA-sequencing of GABAergic and glutamatergic neurons within the POA has revealed an enormous level of molecular diversity within these two groups, consisting of nearly 70 subpopulations clustered based on gene expression [27]. Perhaps because of this heterogeneity, investigations of arousal regulation, particularly anesthetic-induced unconsciousness, focusing on GABAergic and glutamatergic neuronal subtypes have produced sometimes-opposing results. For instance, isoflurane-induced unconsciousness increases expression of c-Fos in and directly depolarizes putative sleep-active GABAergic neurons within the ventrolateral preoptic area (VLPO) [17], yet broad activation of this GABAergic population alters sleep-wake architecture [28,42] without affecting anesthetic induction or recovery time [29]. Together, this suggests a more refined targeting of POA cell types is needed.
Recently, tachykinin 1 (Tac1) was found to be enriched in POA neurons involved in sleep and wake regulation [9], yet the role of these POA Tac1 neurons in anesthetic-induced unconsciousness has not yet been examined. Thus, in this study we tested the hypothesis that POA Tac1 neurons involved in regulating natural states of unconsciousness would also regulate anesthetic-induced unconsciousness. We show that, contrary to previously published results, activation of POA Tac1 neurons strongly stabilizes the wake state. We demonstrate Tac1 activation consolidates wakefulness, virtually eliminates natural sleep, and confers partial resistance to both isoflurane- and sevoflurane-induced unconsciousness. POA Tac1 neurons thus function to reinforce arousal and provide additional evidence for shared circuits that regulate arousal in both natural sleep/wake and general anesthesia
RESULTS
Chemogenetic activation of POA Tac1 neurons increases wakefulness as measured both by ambulatory actigraphy and electroencephalography/electromyography
To reversibly activate Tac1 neurons in the POA, we bilaterally expressed Cre-dependent excitatory hM3DG(q)-mCherry designer receptors (hereafter referred to as hM3Dq) in the POA of Tac1-Cre mice (Figure 1A and 1B, Figure S1). Fluorescent in situ hybridization demonstrates that all of the transfected neurons expressing mCherry mRNA also express endogenous tac1 mRNA (893 cells from n=3 mice, Figure 1C), thus confirming that DREADD expression was limited to the intended targeted population. Relative to vehicle, intraperitoneal (i.p.) administration of 3mg/kg clozapine-N-oxide (CNO) significantly increased expression of c-Fos, a marker of antecedent neuronal activity, in POA hM3Dq-positive neurons (p=0.0059, Figure 1D and 1E), confirming that the targeted neuronal population was successfully activated. In a separate cohort of Tac1-Cre mice, Cre-dependent inhibitory hM4DG(i)-mCherry designer receptors (hereafter referred to as hM4Di) were bilaterally expressed to examine the effects of reversible inhibition. Examination of c-Fos expression confirmed that i.p. CNO significantly decreased c-Fos in POA hM4Di-positive neurons (p=0.0311, Figure 1F and 1G), verifying that the targeted neurons were inhibited compared to vehicle.
Figure 1: Chemogenetic Activation of POA Tac1 Neurons Increases Ambulatory Activity.
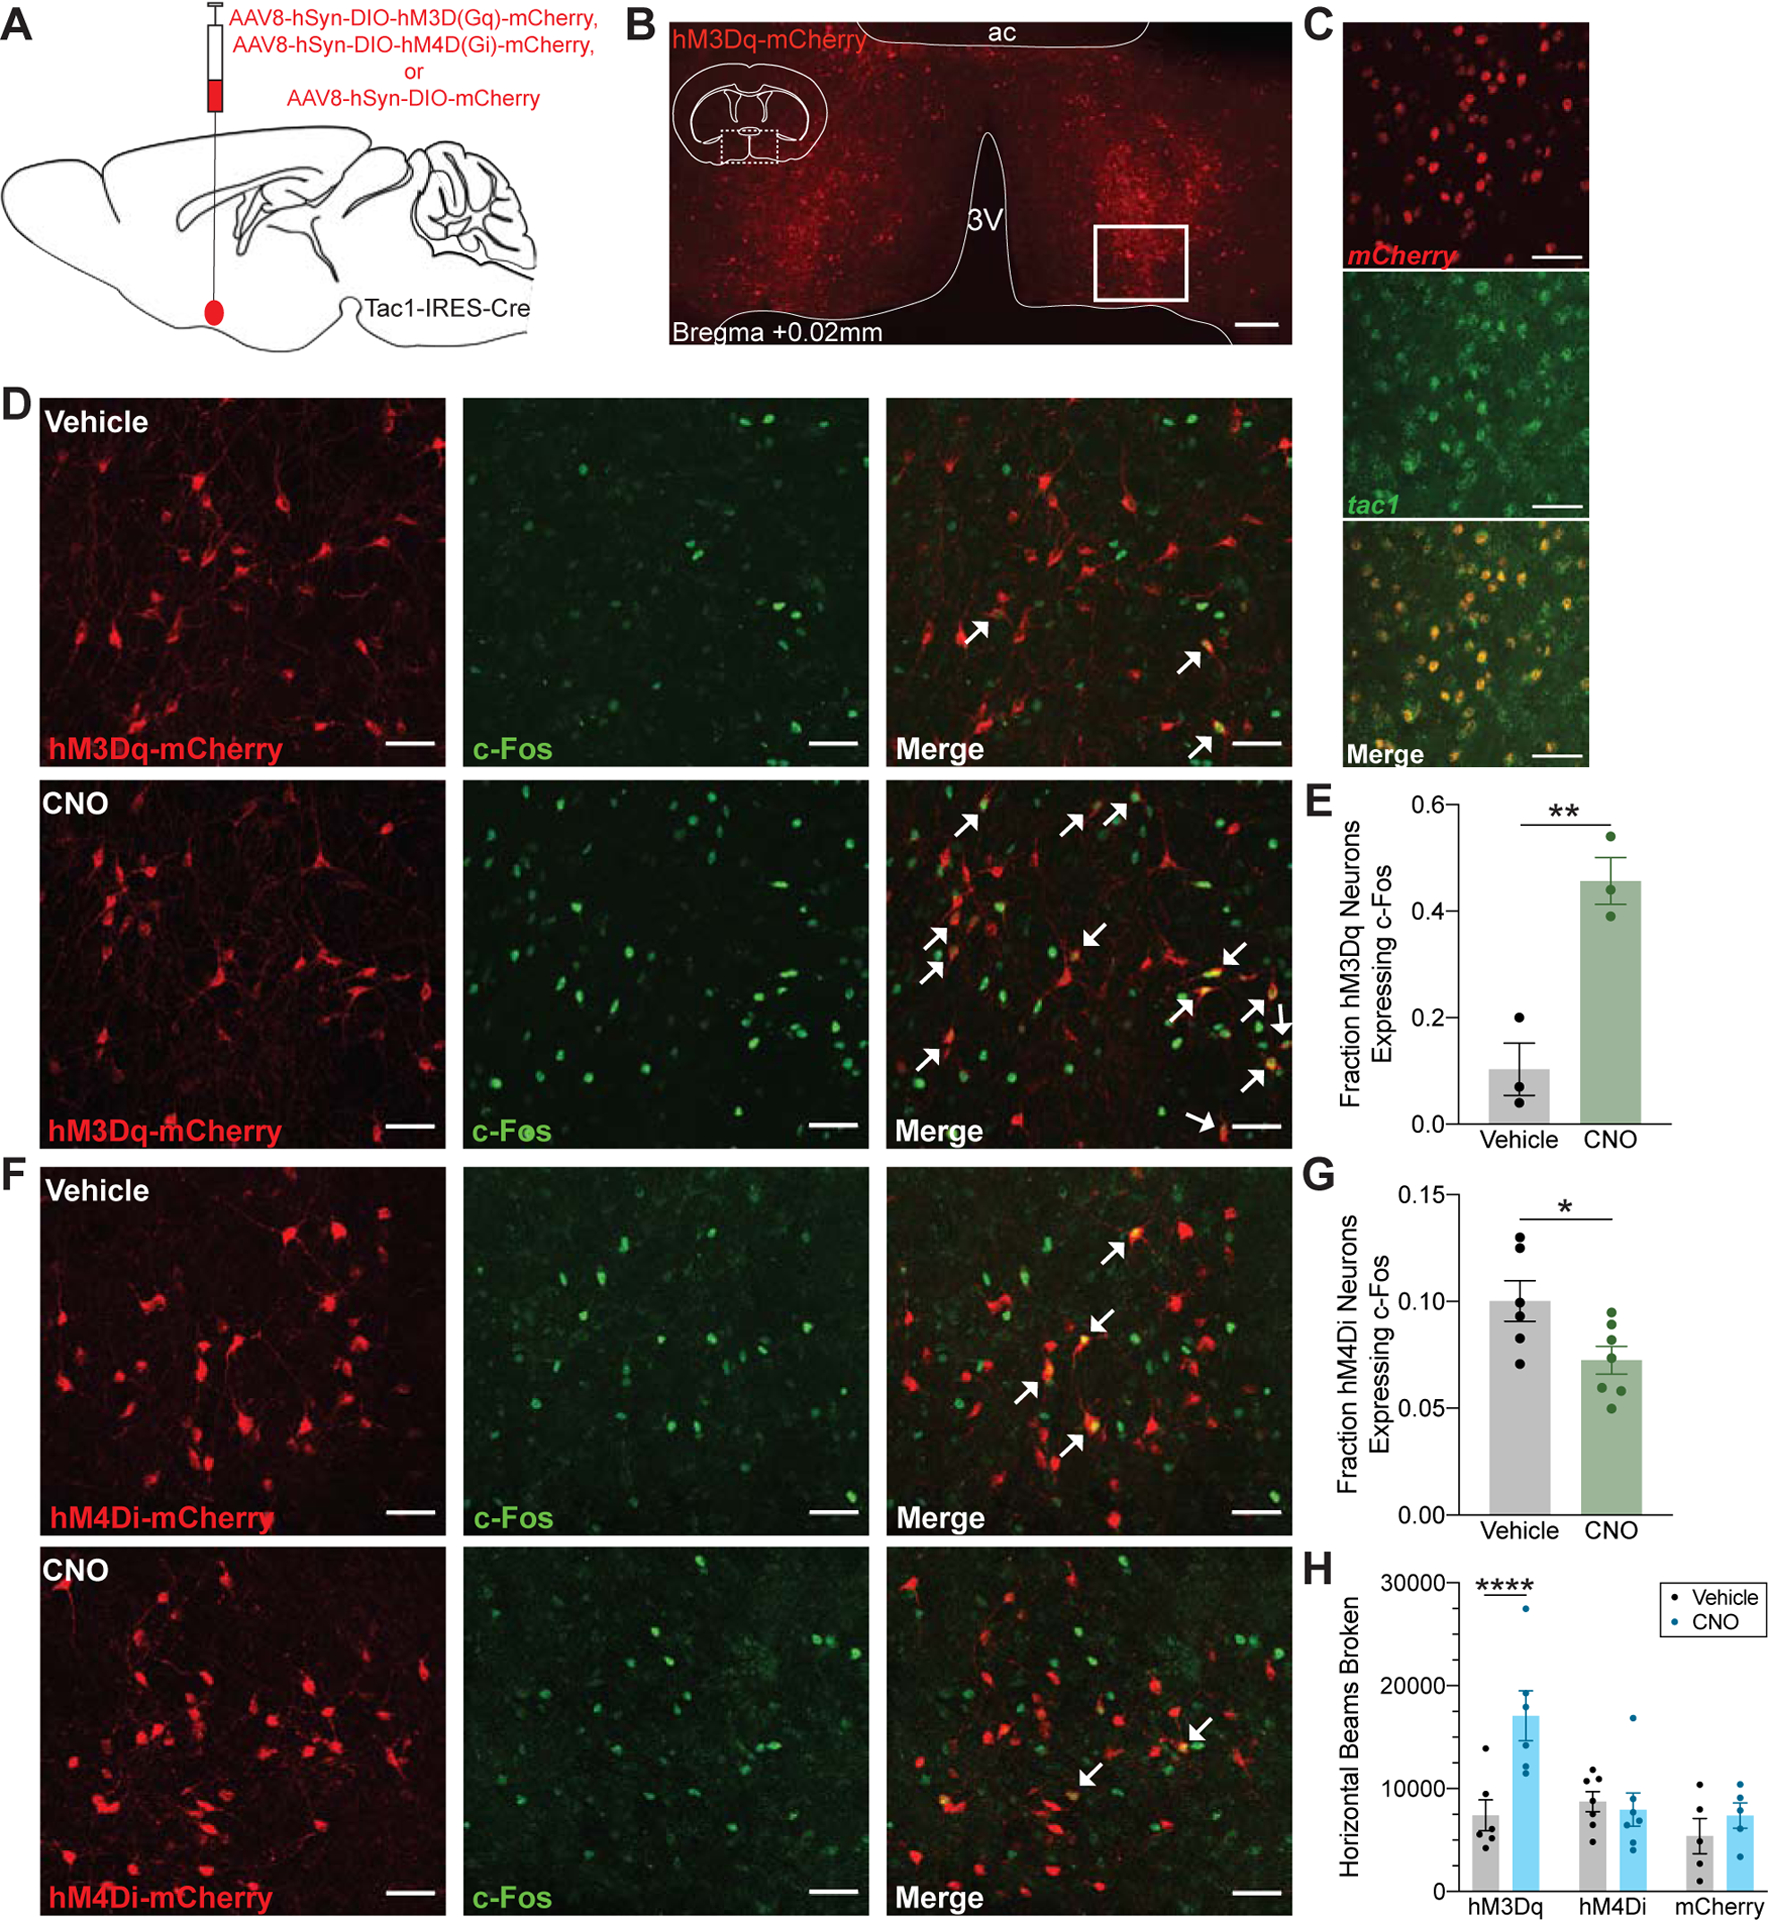
(A) Schematic representation of AAV injection into the POA of Tac1-IRES-Cre mice for expression of the excitatory DREADD receptor hM3Dq-mCherry, inhibitory DREADD receptor hM4Di-mCherry, or control mCherry fluorophore. (B) Representative expression of the hM3Dq-mCherry receptor localized to the POA. Enlarged views in (D) and (F) are taken from region outlined by solid white box. (C) Fluorescent in situ hybridization for mCherry (red) and tac1 (green) confirmed viral expression limited to the targeted neuronal population. (D) Proportion of hM3Dq-expressing neurons (red) that also express c-Fos (green) is increased after administration of 3mg/kg CNO, quantified in (E). (F) 3mg/kg CNO decreased c-Fos expression in hM4Di-expressing neurons compared to vehicle, quantified in (G). White arrows in (D) and (F) indicate double positive neurons. Asterisk indicates a significant difference (*p<0.05, **p<0.01) using a two-tailed unpaired t test. (H) CNO significantly increased ambulatory activity in hM3Dq-expressing animals as measured by the number of beams broken in an infrared beam actigraphy system. Asterisk indicates a significant difference (****p<0.0001) using a two-way repeated-measures ANOVA with Bonferroni’s correction for multiple comparisons. Scale bar represents 200um in (B) and 50um in (C), (D), and (F). Data are shown as mean ± SEM. See also Figure S1.
To determine how modulating POA Tac1 neuronal activity alters rest and activity patterns, locomotion was assessed using an infrared beam break system. Compared to vehicle, activation of POA Tac1 neurons with 3mg/kg CNO at ZT0 (n=6 mice) more than doubled the number of infrared beams broken over the 4 hour recording (p<0.0001; 7,416.3 ± 1,493.6 after vehicle compared to 17,091.0 ± 2,433.8 after CNO, Figure 1H). POA Tac1 inhibition (n=7 mice) did not alter the number of beams broken (p>0.9999; 8,740.3 ± 979.9 after vehicle compared to 7,963.9 ± 1,612.5 after CNO, Figure 1H). To rule out potential confounding effects of viral injection and non-specific CNO actions, beam break actigraphy was recorded in a separate group of Tac1-Cre mice expressing only mCherry in the POA (n=5 mice) run concurrently with the hM3Dq group. Relative to vehicle, administration of CNO did not alter the number of beams broken (p=0.8152; Figure 1H).
Given these unexpected results, the effects of POA Tac1 neuronal activation on sleep and arousal was measured using the polysomnographic gold standard for sleep scoring based upon electroencephalography (EEG) and electromyography (EMG). Not only can these two measures distinguish quiet wakefulness from sleep, they also allow for an examination of non-rapid eye movement (NREM) and rapid eye movement (REM) sleep (Figure 2A). Tac1-Cre mice expressing either hM3Dq (n=5 mice), hM4Di (n=8 mice), or mCherry (n=5 mice) in the POA were implanted with EEG/EMG leads. EEG and EMG waveforms were recorded for 1 hour prior to and 4 hours following administration of 3mg/kg CNO or vehicle. No differences were observed between groups in the hour preceding treatment (Figure S2 & S3). Over the 4 hours following injection, however, CNO significantly increased wakefulness compared to vehicle in hM3Dq mice, as illustrated in the example spectrograms (Figure 2B & 2D) and corresponding hypnograms (Figure 2C & 2E). In aggregate, hM3Dq mice showed a 60% increase in wakefulness (p<0.0001; 60.8% ± 7.5% after vehicle compared to 97.2% ± 1.7% after CNO, Figure 2F) and a 93% decrease in NREM sleep following CNO administration (p<0.0001; 38.8% ± 7.4% after vehicle compared to 2.8% ± 1.7% after CNO, Figure 2G). Likely due to the sparsity of REM sleep at the beginning of the rest phase, significant differences in REM sleep times were not observed (p=0.1366). Most notably, CNO also drastically increased the latency to the first episode of NREM sleep following injection (p<0.0001; 342.1 ± 152.7s after vehicle compared to 4,084.6 ± 792.8s after CNO, Figure 2I). While chemogenetic activation of POA Tac1 neurons nearly abolished sleep in hM3Dq mice, inhibition of this population did not alter time spent in each state or latency to first NREM period (Figure 2F–2I). CNO did not affect any of the parameters measured in control mCherry mice (Figure 2F–2I), eliminating the possibility of non-specific drug effects. Collectively, these results show that chemogenetic activation of POA Tac1 neurons strongly promotes wakefulness, while inhibition does not significantly alter sleep or wakefulness.
Figure 2: Chemogenetic Activation of POA Tac1 Neurons Increases Time Spent Awake as Measured by EEG/EMG.

(A) Representative EEG and EMG traces during wakefulness, non-rapid eye movement (NREM) sleep, and rapid eye movement (REM) sleep. EKG signal at approximately 10Hz corresponds to a mouse heart rate of roughly 600 bpm and is also distinguishable in the EMG traces. (B and D) Representative spectrograms displaying changes in EEG power density from the same hM3Dq-expressing mouse during the hour prior to, and 4 hours following injection of vehicle (B) or 3mg/kg CNO (D). The white dashed line indicates timing of intraperitoneal injection. (C and E) Hypnograms showing sleep and wake state assignments corresponding to each recording session. Insets show expanded view of frequent state transitions occurring over a 5 minute period in the vehicle-treated, but not CNO-treated mouse. (F-H) Quantification of time spent in wakefulness (F), NREM sleep (G), and REM sleep (H) during the 4 hours following injection of vehicle or CNO. Administration of CNO increased time spent awake at the expense of NREM sleep in hM3Dq-expressing mice but not in hM4Di-expressing mice or controls. (I) Latency to the first NREM period was also increased following injection of CNO in hM3Dq-expressing mice only. Asterisks indicate a significant difference (****p<0.0001) from vehicle using a two-way repeated measures ANOVA with Bonferroni’s correction for multiple comparisons. Data in (F-I) are shown as mean ± SEM. See also Figure S2 and Video S1.
Chemogenetic activation of POA Tac1 neurons stabilizes and consolidates wakefulness
In addition to increasing time spent awake at the expense of sleep, activation of POA Tac1 neurons substantially altered the architecture of both states. Administration of CNO stabilized and consolidated the waking state, increasing the average wake bout duration 78-fold (p<0.0001; 22.2 ± 6.1s after vehicle compared to 1,738.6 ± 837.1s after CNO, Figure 3A), while also dramatically decreasing the number of wake bouts (p<0.0001; 528.4 ± 70.9 after vehicle compared to 34.6 ± 20.8 after CNO, Figure 3D). Accordingly, activation of Tac1 neurons destabilized NREM sleep, decreasing both the average bout duration (p=0.0006; 12.6 ± 0.9s after vehicle compared to 6.8 ±1.5s after CNO, Figure 3B) and number of bouts (p<0.0001; 529.6 ± 71.5 after vehicle compared to 33.8 ± 20.9 after CNO, Figure 3E). Neither the average bout duration nor the number of REM bouts was significantly affected by POA Tac1 activation (p=0.5054 and p=0.1189, respectively, Figure 3C & 3F). POA Tac1 inhibition had no effect on sleep and wake architecture (Figure 3). CNO itself failed to alter sleep architecture in control mCherry mice relative to vehicle (Figure 3).
Figure 3: Chemogenetic Activation of POA Tac1 Neurons Stabilizes and Consolidates Wakefulness.
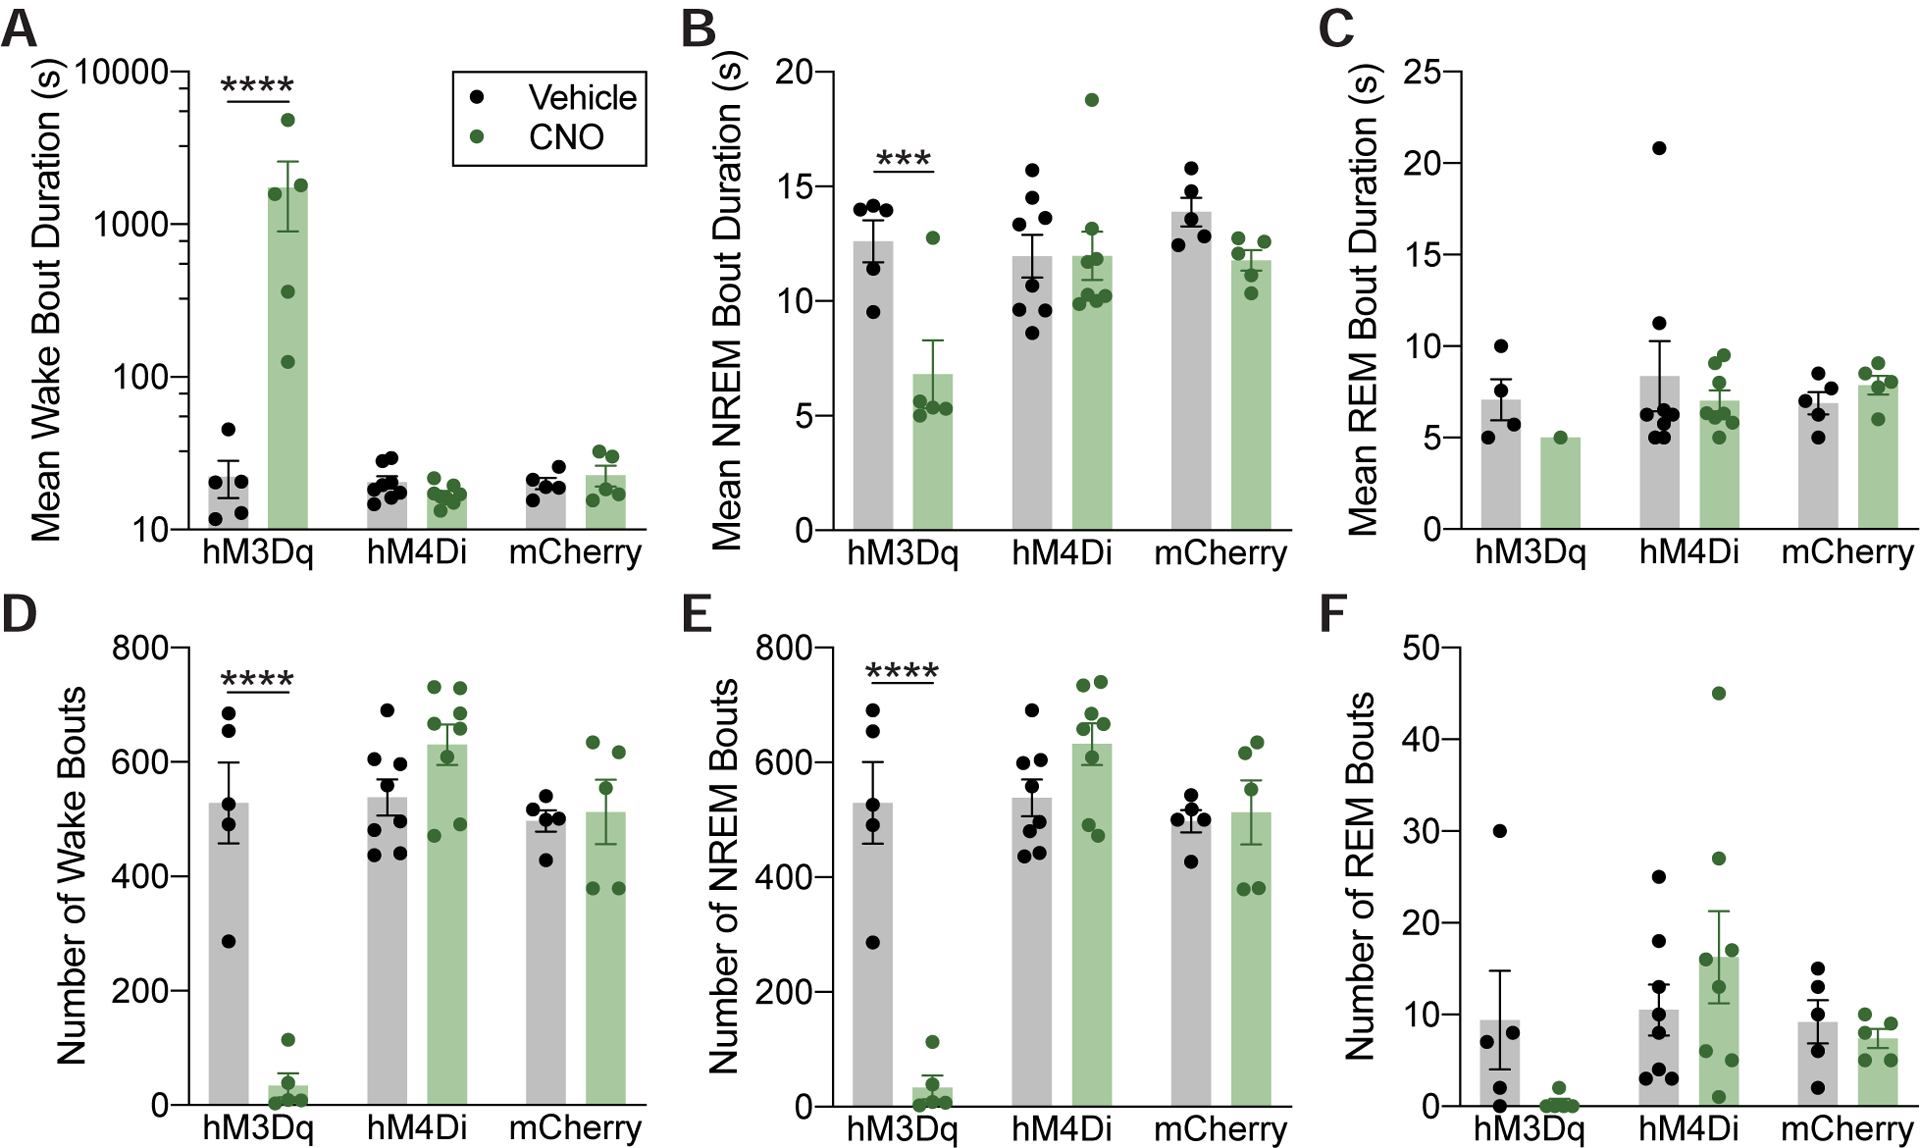
(A) Administration of 3mg/kg CNO stabilized and consolidated periods of wake in hM3Dq-expressing mice, markedly increasing the average wake bout duration (A) (note the logarithmic scale) while decreasing NREM bout duration (B). REM bout duration was not affected (C). CNO decreased the average number of wake bouts (D) as well as NREM bouts (E). Again, average number of REM bouts was not affected (F). Asterisks indicate a significant difference (***p<0.001, ****p<0.0001) from vehicle using a two-way repeated-measures ANOVA with Bonferroni’s correction for multiple comparisons. Data are shown as mean ± SEM. Data in (A) is plotted on a logarithmic scale to show full range of the data. See also Figure S3.
Chemogenetic activation of POA Tac1 neurons increases movement but does not affect place preference in an open field
Video recorded during EEG/EMG sessions, together with beam break actigraphy data, demonstrated that activating POA Tac1 neurons increased locomotor activity (Supplemental Video 1). To determine whether increased anxiety might account for the increased wakefulness and locomotion, we examined whether activation of POA Tac1 neurons altered ambulatory activity in an open field [30]. Following i.p. administration of 3mg/kg CNO or vehicle, Tac1-Cre mice expressing hM3Dq receptors (n=16 mice), hM4Di receptors (n=7 mice), or mCherry only (n=15 mice) in the POA were placed in a circular open field and allowed to explore for 20 minutes. Each animal’s position within the field was tracked by a video camera mounted overhead and analyzed offline. Activation of POA Tac1 neurons increased the total distance traveled over the session by 43% compared to vehicle (p<0.0001; 166.6 ± 9.4m after vehicle compared to 238.4 ± 18.0m after CNO, Figure 4A) and also increased average ambulatory speed (p<0.0001; 0.097 ± 0.004m/s after vehicle compared to 0.137 ± 0.007m/s after CNO, Figure 4B). These effects were specific to POA Tac1 activation, as CNO did not alter total distance traveled or average speed in the inhibitory hM4Di or control mCherry mice relative to vehicle (Figure 4A and 4B).
Figure 4: Chemogenetic Activation of POA Tac1 Neurons Increases Movement in an Open Field without Altering Open Field Place Preference.

(A) Total ambulatory distance during the 20-minute recording session increased following administration of 3mg/kg CNO only in hM3Dq-expressing mice. (B) Average speed was also increased in hM3Dq-expressing mice following CNO administration. (C) Schematic showing how behavioral place preference in the open field was determined. The percent time spent outside a center circle with a radius “r” from the center of the open field was calculated for hM3Dq-expressing (D), hM4Di-expressing (E), and control (F) mice following injection of vehicle or CNO. Regardless of how the center of the field was defined, there were no differences in place preference probability distributions between treatments for any group. Asterisks indicate a significant difference (****p<0.0001) from vehicle using a two-way repeated measures ANOVA with Bonferroni’s correction for multiple comparisons. Place preference probability distributions were compared using the Kolmogorov-Smirnov test. Data in (A) and (B) are shown as mean ± SEM. Solid lines and shading in (D-F) represent mean ± standard deviation place preference distributions. See also Video S1.
In addition to measures of speed and ambulatory activity, the open field paradigm is also used to assess anxiety phenotypes in many species [30], with increased time spent in the outer zone of the open field indicative of heightened anxiety [31,32]. To assess potential effects of POA Tac1 activation on anxiety, place preference within the open field was determined using the percent of time spent outside the center region of the field. To remove potential bias introduced by arbitrarily defining the center region, time spent outside the center was calculated as a function of the field’s radius (Figure 4C). There were no differences in place preference distributions between treatments regardless of the threshold used to define the center and the periphery of the open field for hM3Dq (p=0.9065, Figure 4D), hM4Di (p=0.9968, Figure 4E) and mCherry (p=1.00, Figure 4E) mice. Together, these data show that activation of POA Tac1 neurons increases ambulatory activity, but this increase in activity does not appear to be a consequence of increased anxiety.
Chemogenetic activation of POA Tac1 neurons stabilizes wakefulness against isoflurane induction and facilitates emergence from both isoflurane and sevoflurane anesthesia
Many nuclei involved in sleep and wake regulation play a role in anesthetic-induced unconsciousness. However, work examining the role of sleep and arousal pathways in anesthetic-induced unconsciousness in the POA has thus far largely focused on sleep-promoting neurons in the region [15,17–21,29,33]. Given that Tac1 POA neurons strongly promote wakefulness over natural sleep, we wondered if activation of these neurons would similarly promote wakefulness over anesthetic-induced unconsciousness and facilitate a return to the waking state after induction of general anesthesia.
Sensitivity to two distinct inhaled anesthetics, isoflurane and sevoflurane, was assessed using the loss of righting reflex (LORR) assay [34]. Population dose-response curves were generated for Tac1-Cre mice expressing hM3Dq receptors (n=16 mice), hM4Di receptors (n=20 mice), or mCherry only (n=16 mice) on separate days either after administration of vehicle or 3mg/kg CNO. hM3Dq-expressing mice given CNO displayed increased resistance to isoflurane induction (Figure 5A) and an even more impressive ability to exit the anesthetic state and return to wakefulness during isoflurane anesthesia (Figure 5B), illustrated by the rightward shift of both curves compared to vehicle. The mean induction EC50 dose, or dose at which half the population had lost the righting reflex, shifted from 0.77% (95% confidence interval [CI]: 0.75%−0.79%) after vehicle to 0.90% after CNO (CI: 0.89%−0.91%). The emergence EC50 dose, or dose at which half the population regained righting, increased from 0.39% (CI: 0.37%−0.42%) after vehicle to 0.71% (CI: 0.70%−0.71%) after CNO. Just as POA Tac1 inhibition had no effect on sleep or arousal, it similarly did not alter sensitivity to isoflurane on either induction or emergence (induction EC50 shift from 0.81% [CI: 0.78%−0.84%] after vehicle to 0.82% [CI: 0.81%−0.83%] after CNO; emergence EC50 shift from 0.51% [CI: 0.47%−0.56%] after vehicle to 0.43% [CI: 0.39%−0.48%] after CNO). CNO had no effect on the isoflurane sensitivity of the control mCherry group (induction EC50 shift from 0.79% [CI: 0.74%−0.83%] after vehicle to 0.82% [CI: 0.81%−0.83%] after CNO; emergence EC50 shift from 0.44% [CI: 0.40%−0.48%] after vehicle to 0.50% [CI: 0.47%−0.52%] after CNO).
Figure 5: Chemogenetic Activation of POA Tac1 Neurons Restores Wakefulness Against Isoflurane and Sevoflurane.

Dose response curves showing the fraction of unconscious mice as judged by a loss of righting reflex in response to stepwise increases or decreases in anesthetic concentration. For both induction (A) and emergence (B), administration of 3mg/kg CNO to hM3Dq-expressing mice increased resistance to isoflurane, shifting the dose response curve (dotted blue line) to the right of controls. While activation of POA Tac1 neurons did not significantly increase resistance to sevoflurane on induction (C), resistance to sevoflurane was observed on emergence (D). POA Tac1 inhibition (dotted purple lines) did not affect sensitivity to either anesthetic. Horizontal axes are displayed on a logarithmic scale. Best-fit sigmoidal dose-response curves are shown (bold solid or dashed line), with shading representing 95% confidence intervals. See also Figure S4.
As past work illustrates that anesthetics exert their effects at numerous, sometimes non-overlapping, molecular targets as well as nuclei across the brain [15–17,19,33,35,36], we also examined whether POA Tac1 neurons would modulate sensitivity to a second inhaled anesthetic, sevoflurane. Activation of POA Tac1 neurons (n=11 mice) significantly increased resistance to sevoflurane on emergence (Figure 5D), with the EC50 shifting from 1.25% (CI: 1.17%−1.32%) after vehicle to 1.63% (CI: 1.59%−1.67%) after CNO. While there was increased resistance to induction, this shift was not significant (EC50 shift from 1.70% [CI: 1.62%−1.77%] after vehicle to 1.81% [CI: 1.75%−1.87%] after CNO, Figure 5C). Similar to the results observed with isoflurane, inhibition of POA Tac1 neurons (n=13 mice) did not alter sensitivity to sevoflurane on either induction or emergence (induction EC50 shift from 1.71% [CI: 1.67%−1.74%] after vehicle to 1.66% [CI: 1.60%−1.72%] after CNO; emergence EC50 shift from 1.22% [CI: 1.15%−1.29%] after vehicle to 1.08% [CI: 0.97%−1.19%] after CNO, (Figure 5C and 5D).
Since anesthetic sensitivity measures are dependent in part on core body temperature, the thermogenic potential of activating Tac1 POA neurons was measured. In the absence of an anesthetic challenge, CNO treatment did not alter core body temperature (p=0.7651, Figure S4). Similarly, with active warming during anesthetic exposure [34], core body temperature remained unchanged (36.9 ± 0.1°C prior to exposure and 37.2 ± 0.1°C after exposure).
POA Tac1 neurons project to numerous wake-promoting nuclei across the brain
To investigate how POA Tac1 neurons might promote wakefulness, projections of hM3Dq-expressing POA Tac1 neurons were mapped histologically. We found dense hM3Dq-mCherry+ projections to numerous established wake-promoting nuclei across the brain, including the orexinergic neurons of the lateral hypothalamus (LH) (Figure 6A), histaminergic tuberomammillary nucleus (TMN) neurons (Figure 6B), dopaminergic ventral periaqueductal gray (vPAG) and ventral tegmental area (VTA) neurons (Figure 6C & 6D), and noradrenergic locus coeruleus (LC) neurons (Figure 6E). Very limited projections to the sleep-promoting parafacial zone (not shown) were observed.
Figure 6: POA Tac1 Neurons Project to Known Wake-Promoting Nuclei.
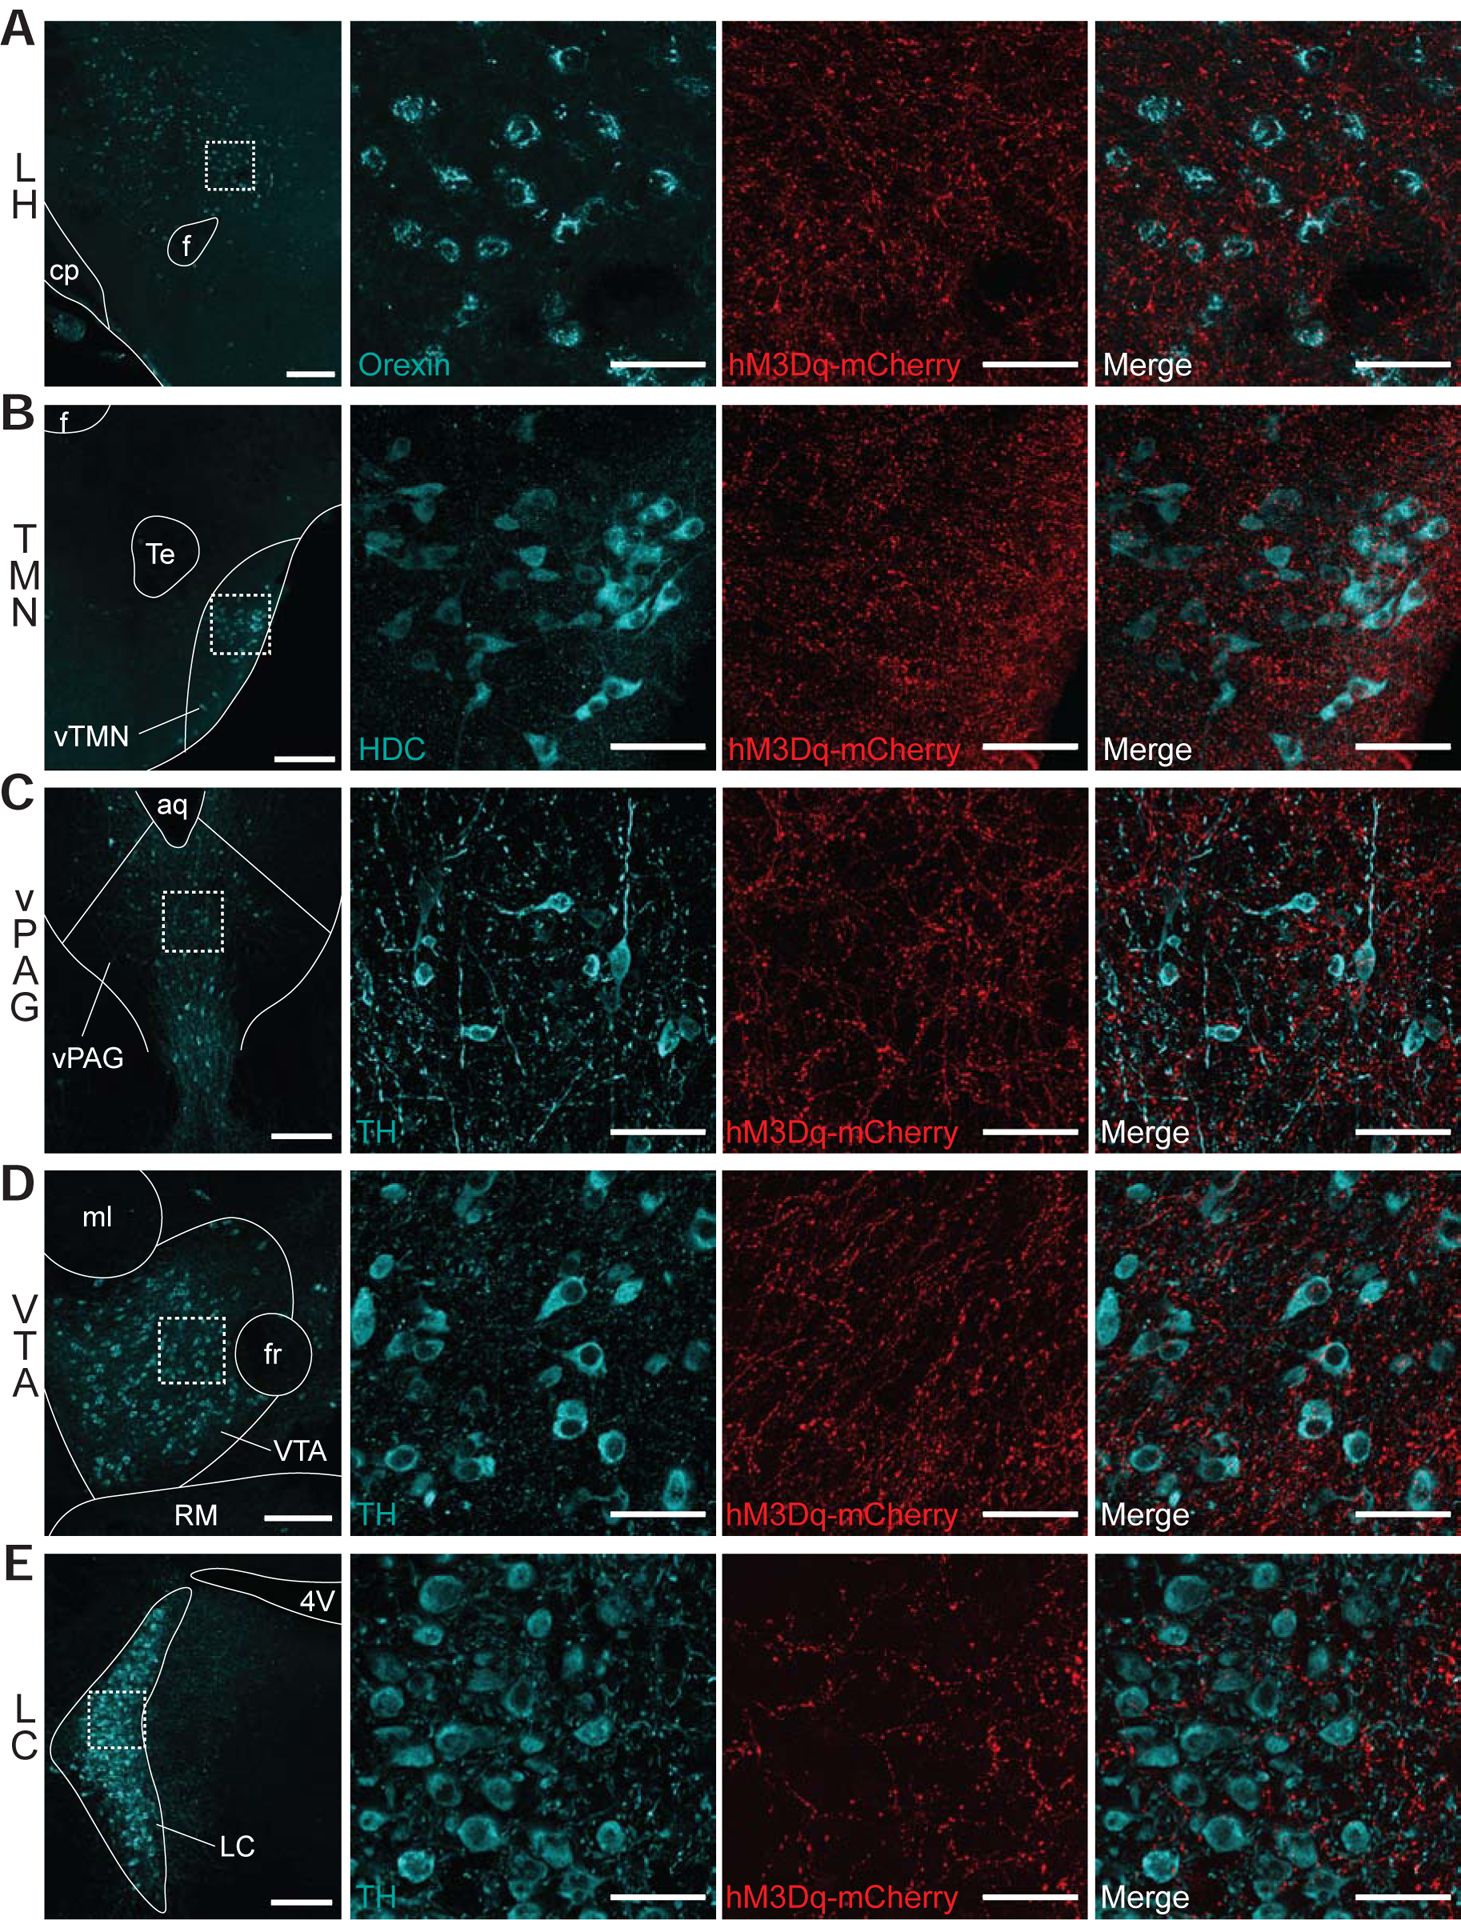
hM3Dq-mCherry-positive terminals were observed in the (A) LH, (B) TMN, (C) vPAG, (D) VTA, and (E) LC. Column 1 shows a low magnification image of each region, while columns 2–4 show high-magnification views of the region outlined by white dashed box in column 1. Sections were stained for mCherry (red) as well as (A) orexin, (B) histidine decarboxylase, and (C-E) tyrosine hydroxylase, shown in cyan. Scale bar is 200um in column 1 and 50um in columns 2–4. Abbreviations: f, fornix; cp, cerebral peduncle; LH, lateral hypothalamus; Te, terete hypothalamic nucleus; TMN, tuberomammillary nucleus; aq, aqueduct; vPAG, ventral periaqueductal gray; ml, medial lemniscus; fr, fasciculus retroflexus; VTA, ventral tegmental area; RM, retromamillary nucleus; 4V, fourth ventricle; LC, locus coeruleus.
DISCUSSION
Here, we demonstrate that chemogenetic activation of POA Tac1 neurons strongly promotes and consolidates wakefulness while also enhancing locomotor activity. In addition to a near total abolition of sleep, activation of POA Tac1 neurons also strongly biases towards the waking state over isoflurane- and sevoflurane-induced unconscious states. Following activation of POA Tac1 neurons, mice exit the anesthetic state at doses that would formerly have kept them anesthetized. The potent effects of Tac1 activation thus work to support the waking state over both endogenous as well as anesthetic-induced impairment of arousal. Chemogenetic inhibition of this population, while incomplete, did not affect arousal state, suggesting the POA Tac1 neurons are sufficient, but perhaps not necessary, for wakefulness.
Tachykinin neuropeptides have been previously linked to sleep and wake regulation. Nighttime intravenous infusions of substance P, a product of the Tac1 gene, in healthy adults increases time spent awake as well as REM latency compared to saline infusions [37]. Additionally, ICV administration of substance P also increases both time spent awake and latency of sleep onset in mice [38]. One proposed mechanism for this enhanced wakefulness is substance P-mediated activation of wake-promoting LC neurons, known to express tachykinin receptors [39]. Indeed, local administration of substance P depolarizes LC neurons and increases firing rate [40]. POA Tac1 projections to the LC, as well as the LH, TMN, vPAG, and VTA (Figure 6) provide a likely endogenous source of substance P to enhance wakefulness. However, synaptic connections to these regions will need to be confirmed using channelrhodopsin-assisted circuit mapping (CRACM) [43] or a higher resolution microscopy method such as electron microscopy. It must also be noted that substance P signaling is not uniformly arousal-promoting. When infused directly into the VLPO of mice, substance P promotes sleep [41], suggesting that substance P has region-specific effects on arousal.
Chemogenetic activation of POA Tac1 neurons strongly stabilized the wake state, decreasing the number of transitions between sleep and wake while greatly increasing the average length of wake bouts. This is in contrast to previously published results describing NREM-promoting effects of POA Tac1 activation [9]. Given single-cell molecular profiling of the POA showing that Tac1 is expressed in both excitatory and inhibitory POA neurons [27], it is likely that distinct populations of sleep-promoting and wake-promoting Tac1 neurons exist within the region. The chemogenetic activation strategy used in our study almost certainly recruited more POA neurons compared to the optogenetic strategy employed by Chung et al., allowing for the possibility that activation of the wake-promoting Tac1 neurons in our study overpowered any sleep-promoting Tac1 neurons in the region. A second possible explanation for these divergent results is a potential conduction block caused by 10Hz optogenetic stimulation. Galaninergic POA neurons stimulated at 10Hz promote wake [9]. However, optogenetic stimulation at lower frequencies (0.5–4Hz) that more closely match the endogenous firing rate during NREM sleep increases NREM sleep [42]. Endogenous state dependent firing rates of POA Tac1 neurons remain unknown. A third potential explanation relates to differences in neuronal transfection across the POA. While viral spread for animals used in this study are given (Figure S1), the extent of transfection was not shown by Chung et al [9].
More difficult to reconcile are the divergent effects of chemogenetic inhibition, which had no effect on sleep in this study but was previously shown to promote wakefulness [9]. Variable efficacy of chemogenetic inhibition may underlie these differences, as incomplete suppression of activity of hM4Di-expressing neurons occurs whether CNO is administered locally or systemically [44–46]. Our c-Fos immunohistochemistry reflects these findings, as the number of c-Fos-expressing hM4Di neurons was not completely abolished, but rather decreased by roughly 30% after CNO compared to vehicle. Once again, a difference in viral transfection between the two studies may also explain the divergent effects of chemogenetic inhibition.
In addition to sleep and wake, the POA is also involved in regulating body temperature. Multiple studies have demonstrated the existence of neurons within the POA that regulate both states, with activation of galaninergic VLPO neurons as well as glutamatergic MnPO and MPO neurons promoting both sleep and a reduction of body temperature [20,29,42,47]. Activation of POA Tac1 neurons, in contrast, produced no changes in body temperature, suggesting this population is not shared between the circuits controlling sleep and body temperature.
Not only did activation of POA Tac1 neurons stabilize wakefulness, it also increased ambulatory activity, as demonstrated by our beam break and open field results. This is not the first instance of a link between tachykinins and locomotion. Injections of substance P into the brainstem of lampreys, rodents, and cats induce bouts of locomotor activity, suggesting an evolutionarily conserved role for tachykinins in modulating locomotion [48–51]. Additionally, substance P and neurokinin A, another product of the Tac1 gene, produce a dopamine-mediated increase in locomotor activity in an open field when injected into the VTA of rats [52–54]. To our knowledge, the endogenous source of tachykinins in these regions has yet to be identified. However, our histological identification of POA Tac1 projections to the VTA suggests tachykinin release from these neurons as a potential mechanism underlying the enhanced locomotor phenotype observed after POA Tac1 activation. Multiple neuronal populations within the VTA are also known to regulate sleep and wakefulness [57], making the VTA a potential mediator of both the locomotor and arousal promoting effects of POA Tac1 activation.
Analysis of open field locomotion allowed for a simultaneous investigation into potential effects on anxiety. Sleep and wake disturbances are known to occur in a number of psychiatric conditions, including anxiety [55,56,58,59]. Furthermore, tachykinins have previously been implicated in anxiety and other emotional behaviors in rodents. Mice with a targeted deletion of either the Tac1 gene or neurokinin 1 receptor gene show reduced anxiety in a number of paradigms, including the open field [60–62]. Similarly, administration of neurokinin 1 receptor antagonists in rodents reduces anxiety-related behaviors [63,64], while agonists induce an anxiogenic response [64]. Given these links, we questioned whether the increased wakefulness observed after POA Tac1 activation was due to anxiety. Mice typically spend more time exploring the periphery of an open field compared to the open center area, with an increase in time spent in the center indicative of anxiolysis [30,32]. An unbiased comparison of place preference probability distributions within the open field between CNO and vehicle treated mice expressing hM3Dq, hM4Di, or mCherry alone revealed that POA Tac1 neurons have no effect on place preference and are unlikely to be involved in the anxiety phenotypes previously described.
POA Tac1 activation restored wakefulness during ongoing doses of both isoflurane and sevoflurane that produced unconsciousness in vehicle treated controls. Moreover, POA Tac1 activation hindered onset of isoflurane anesthesia. POA Tac1 activation did produce a rightward shift on sevoflurane induction, though the shift did not reach significance. This may be due to sevoflurane’s faster rate of uptake compared to isoflurane, resulting from sevoflurane’s lower blood/gas partition coefficient. A faster induction of sevoflurane anesthesia may ultimately have minimized the experimental window available to detect a shift in resistance. The unquestionable large and common effect of POA Tac1 activation facilitating emergence from two general anesthetics with a potential agent-specific differential effect on induction could also be indicative of a differential neurobiology for entering and exiting states of anesthesia [35].
These results support the shared circuitry hypothesis of anesthetic hypnosis, which posits that anesthetics exert their hypnotic effects in part by acting on endogenous sleep-wake neuronal circuitry and that independent modulation of the same neurons in these circuits affects the anesthetic state. Within the hypothalamus specifically, anesthetics are known to activate the VLPO, the medial preoptic area, and the supraoptic nucleus, three sleep-promoting nuclei [17,20,65], and inhibit the wake-stabilizing orexinergic neurons in the lateral hypothalamus [35,67]. However, recent work showing that GABAergic or glutamatergic POA neurons that modulate sleep and wake have no effect on isoflurane induction and recovery time suggests that not all sleep or arousal-promoting neurons play a meaningful role in anesthetic hypnosis [29]. Further identification of the hypothalamic microcircuitry regulating sleep and wakefulness with the ability to impact drug-induced states of unconsciousness is needed.
STAR METHODS
RESOURCE AVAILABILITY
Lead Contact
Further information and requests for resources and reagents should be directed to and will be fulfilled by the Lead Contact, Max Kelz (kelz@pennmedicine.upenn.edu).
Materials Availability
This study did not generate any unique materials or reagents.
Data and Code Availability
The original anesthetic dose response data are provided on Mendeley Data (https://dx.doi.org/10.17632/k45sgtmjc4.1). Due to the large size of the data files, the EEG/EMG recordings, imaging datasets and open field video files are available upon request from the Lead Contact. This study did not generate any unique code.
EXPERIMENTAL MODEL AND SUBJECT DETAILS
Mice
Studies were approved by the Institutional Animal Care and Use Committee at the University of Pennsylvania and were conducted in accordance with National Institutes of Health guidelines. Chemogenetic experiments were performed in male and female Tac1-IRES-Cre mice (Jackson Laboratories, stock 021877; 43 females and 40 males) aged 10–18 weeks, weighing 18–25g at the time of surgery. Male and female mice were distributed equally across groups in each experiment. Littermates were split between experimental and control groups while also ensuring equal distribution of males and females between groups. All mice were housed on a reverse 12h:12h light/dark cycle (ZT0/lights on 7:00pm) with ad libitum access to food and water.
METHOD DETAILS
Viral Vectors and Chemicals
Cre-dependent adeno-associated viral vectors (AAV8-hSyn-DIO-hM3Dq-mCherry, Addgene, 44361; AAV8-hSyn-DIO-hM4Di-mCherry, Addgene, 44362) were used to selectively express excitatory hM3Dq or inhibitory hM4Di receptors in Tac1 hypothalamic neurons. Control animals received a Cre-dependent adeno-associated viral vector containing mCherry only (AAV8-hSyn-DIO-mCherry, Addgene, 50459). Clozapine-N-oxide (CNO, Sigma-Aldrich) was prepared fresh for each experiment by dissolving in sterile saline to a concentration of 0.3mg/ml. CNO dosing for all experiments was 3mg/kg.
Surgical Procedures
Mice were anesthetized with 2.5% isoflurane in 100% oxygen for induction, and maintained on 1.5% isoflurane for the remainder of the surgery. After lack of response to a toe pinch, mice were placed on a stereotaxic frame (Kopf Model 902). Eyes were protected by an eye ointment and core temperature was maintained at 37±0.5°C using a closed-loop heating pad (CWE Inc). To target the POA, mice received bilateral 300nl microinjections of virus delivered using a 33G, 10ul Hamilton syringe (Hamilton Company, 80008) mounted on a stereotaxic microinjection syringe pump (Stoelting Co). The injection coordinates relative to bregma were: AP −0.10mm; ML ±0.70mm; DV −5.70mm. Following injection, the syringe was held in position for 10 minutes to avoid virus reflux up the syringe tract [66]. Following bilateral injections, the incision was sutured closed, isoflurane was discontinued, and animals received 0.5mg cefazolin and 0.125mg meloxicam to maintain analgesia. For sleep recordings, EEG/EMG leads were constructed and implanted following viral injections as previously described [68]. 6 epidural EEG leads were implanted 0.65mm lateral to midline on both hemispheres, ranging from 2.45mm anterior to bregma to 2.75mm posterior to bregma. Additionally, 2 EMG leads were implanted in the dorsal neck muscles. The headpiece was secured to the skull using dental cement (A-M Systems). All mice were allowed to recover for a minimum of two weeks prior to the start of habituation.
Fluorescent In Situ Hybridization
In situ hybridization was performed with the RNAscope Fluorescent Multiplex Kit (Advanced Cell Diagnostics Inc) following the pretreatment protocol for fixed frozen sections. Mice were transcardially perfused with PBS followed by 4% paraformaldehyde, brains were then removed and post-fixed overnight in 4% paraformaldehyde. Brains were then placed in 15% sucrose until tissue sank, and repeated in 30% sucrose. Brains were embedded in Tissue-Tek O.C.T Compound and the POA was sectioned at 14μm by cryostat and mounted onto Superfrost Plus slides. FISH protocol was then run according to manufacturer’s instructions, with the Target Retrieval pretreatment step extended to 8 minutes and tac1 C2 and mCherry C3 probes.
Immunohistochemistry for c-Fos
Mice expressing hM3Dq or hM4Di receptors in the POA received an intraperitoneal (i.p.) injection of vehicle or CNO 2 hours prior to sacrifice. Mice were then deeply anesthetized with isoflurane and transcardially perfused with ice cold PBS followed by 4% paraformaldehyde. Brains were removed and post-fixed in 4% paraformaldehyde overnight. Brain tissue was then sectioned via compresstome (Precisionary Instruments) at 40μm and standard c-Fos immunohistochemistry was performed on sections containing the hypothalamus. Sections were permeabilized and blocked in 2.5% normal goat serum in PBST (2% TritonX-100 in PBS) for 1 hour at room temperature, followed by an overnight incubation at 4° C in rabbit anti-cFos primary antibody (Cell Signaling Technologies, 1:1000). Sections were then washed in PBS, followed by a 2 hour incubation with Alexa Fluor 488 goat anti-rabbit secondary antibody (ThermoFisher, 1:200). Following a final wash in PBS, sections were mounted and cover slipped with mounting medium containing a DAPI counterstain (Vector Laboratories).
Immunohistochemistry for Projection Targets
Mice were transcardially perfused and brains postfixed and sectioned as described above. To visualize fiber projections in a variety of brain regions, sections were permeabilized and blocked in 2.5% normal goat serum in PBST (2% TritonX-100 in PBS) for 1 hour at room temperature, followed by an overnight incubation at 4° C in primary antiserum against mCherry (rabbit anti-RFP, Rockland Inc, 1:1000 or chicken anti-mCherry, Abcam, 1:1000) and the molecular marker of interest for each region (chicken anti-tyrosine hydroxylase, Abcam, 1:1000; rabbit anti-histidine decarboxylase, American Research Products Inc, 1:1000; or mouse anti-orexin A, R&D Systems, 1:1000). Sections were washed in PBS followed by a 2 hour incubation with the appropriate secondary antibodies (Alexa Fluor 594 goat anti-rabbit, ThermoFisher, 1:200; Alexa Fluor 594 goat anti-chicken, ThermoFisher, 1:200; Alexa Fluor 647 goat anti-rabbit, ThermoFisher, 1:200; Alexa Fluor 647 goat anti-mouse, ThermoFisher, 1:200; Alexa Fluor 647 goat anti-chicken, ThermoFisher, 1:200). Following a final wash in PBS, sections were mounted and coverslipped with mounting medium containing a DAPI counterstain (Vector Laboratories).
Imaging and Cell Counting
Sections used for cell counting were imaged at 20x using a confocal microscope (SP5II, Leica Microsystems). Counting was performed using ImageJ [69] and conducted by a blinded experimenter. Only mice that displayed mCherry expression in the POA were included in analysis. The fraction of mCherry-positive neurons also positive for c-Fos were quantified for each 40um section, and subsequently averaged for each animal. FISH sections and sections stained for projection targets were imaged at 40x and 63x also using a confocal microscope. The number of mCherry-positive neurons also positive for Tac1 was quantified for each image. Imaging for injection localization was performed using epifluorescence microscopy (Olympus BX41).
Viral Transfection Mapping
To construct viral transfection heat maps, coronal sections containing viral mCherry expression were imaged at 10x on an epifluorescence microscope. Each image was then matched to the corresponding section on the mouse brain atlas, and an outline containing the transfected region was traced on an outline of the corresponding atlas image overlaid on the microscopy image. This was repeated for all mice in the group and the outlines for each atlas section were then aggregated in Matlab. Transfected regions of interest were binarized and summed together for each coronal section across all animals. A 2-D Gaussian kernel with standard deviation of 3 was applied as a smoothing filter for creation of the final heat map.
Assessment of Home Cage Ambulatory Activity
Mouse ambulation was recorded using a 1-dimensional home cage locomotor infrared beam system and accompanying Accuscan Fusion 4.1 software (Omnitech Electronics Inc). Actigraphy was recorded for 4 hours following i.p. injection of vehicle or CNO at the beginning of the light cycle (ZT0-ZT4). Injection order was randomized and recordings were separated by at least 48 hours. Total number of beams broken during the 4 hour period was then compared between conditions.
Assessment of Sleep and Wake
At least 2 weeks after viral injection and EEG/EMG implantation, mice were habituated to tethering in the recording area for 3 days. All recordings were performed in home cages. On experimental days, mice underwent 1 hour of baseline EEG/EMG recording in the last hour of the dark cycle. An hour later (ZT0, onset of light cycle) mice received an i.p. injection of vehicle or CNO and EEG/EMG was continuously recorded for 4 hours post-injection. For hM4Di experiments, recordings took place at the opposite circadian time (baseline during last hour of the light cycle, injections at ZT12) to maximize any potential sleep-promoting effects. Injection order was randomized and recordings were separated by at least 48 hours for all groups. Signals were recorded and digitized at 1000 Hz using 32 channel headstages (Intan Technologies, Los Angeles, CA) and open source software [70]. EEG signals were filtered between 1 and 100 Hz using a 5th order zero-phase Butterworth filter and mean re-referenced. EMG signals were filtered above 100 Hz using the same filter. Spectral power estimation was computed using previously published code [71]. EEG/EMG was then used to classify brain states as NREM sleep, REM sleep, or wakefulness using a 5 second sliding window with a 2.5 second overlap [72]. Delta power was summed from 1–5 Hz while theta power was summed from 6–12 Hz. Epochs of NREM sleep were identified by high delta power (greater than mean power over entire recording) with low muscle tone (lower than mean power over entire recording). REM sleep was characterized by low delta power (less than mean power over entire recording), high theta power (greater than mean plus standard deviation over entire recording) with muscle atonia (EMG lower than mean power over entire recording). All other windows were classified as wake. Therefore, the wake state consisted of windows of high EMG power and high delta with EMG tone. Classification was performed in Matlab and manual verification confirmed findings. Total time, number of bouts, and average bout duration were calculated for each state and compared between groups. Finally, latency to the first NREM period was also compared between treatment conditions in all groups.
Open Field Video Tracking
Prior to the start of their open field recording, mice received i.p injections of vehicle or CNO. 30 minutes later, the mouse was placed in a circular open field (radius 76cm) and ambulatory activity was recorded for 20 minutes with a camera mounted above the open field. Movement was tracked offline using custom Matlab software previously described [73]. Total distance traveled and average speed were quantified over the entire recording. To address potential changes in place preference within the field, the probability of the mouse being outside the center region of the field was calculated for center regions of various radii and compared between treatments for each group. Injection order was randomized and trials were separated by at least 48 hours.
Righting Reflex Assessment
All mice were habituated to gas-tight, temperature-controlled, 200mL cylindrical chambers with 100% oxygen flowing at 200mL/minute, as previously described [34]. As previously shown, this flow rate results in chamber equilibration within 5 minutes [74]. Mice underwent staircase increasing followed by decreasing exposure to isoflurane or sevoflurane in a heated water bath with 15 minutes spent at each step. To control for the duration of CNO efficacy, full dose response curves were generated across two separate sessions. On the first testing day, isoflurane was increased from 0.0% to 1.2% (for induction) and then subsequently decreased back to 0.0% (for emergence) in 0.2% steps. At least 48 hours after the first testing day, the same group of mice was again exposed to the isoflurane staircase, but using odd concentrations (0.1%, 0.3%, and so on, with the final step remaining at 1.2%). The same two-session staircase protocol was used for sevoflurane, though the minimum and maximum concentrations were changed from 0.0% and 1.2% to 0.9% and 2.4% due to sevoflurane’s lower anesthetic potency. Chamber concentrations were confirmed using a Riken FI-21 refractometer (AM Bickford). After 15 minutes at each concentration to ensure both chamber and brain equilibration, righting reflex was assessed for each animal. An animal was considered to have an intact righting reflex if it successfully returned to a prone position twice in a row. Otherwise, the righting reflex was considered to be absent.
Body Temperature Measurement
Body temperature was measured rectally using a digital thermometer (Fisherbrand 15-078-187). Temperatures were taken prior to an i.p. injection of 3mg/kg CNO, then repeated 1 hour and 2 hours post-injection. Temperatures were also measured and recorded immediately before and after isoflurane righting reflex assessment to ensure adequate heating from the water bath.
QUANTIFICATION AND STATISTICAL ANALYSIS
Data were analyzed using Matlab 2019b (Mathworks, MA) using the Statistics and Machine Learning Toolbox and Prism v8.0 (GraphPad Software Inc). All data collection was randomized and counter-balanced. All data were tested for normality and are reported as mean ± standard error of the mean. A p value <0.05 was considered statistically significant for all comparisons. Behavioral changes as a function of virus (hM3DqmCherry, hM4Di-mCherry, or mCherry) and treatment (vehicle or CNO) were evaluated using a two-way repeated-measures ANOVA followed by Bonferroni’s correction for multiple comparisons. The percentage of active cells (c-Fos+) after administration of vehicle or CNO was compared using a two-tailed unpaired t test. The Kolmogorov–Smirnov test was used to determine any differences in place preference probability distributions. Isoflurane and sevoflurane dose response curves were generated by nonlinear regression fitting of the population responsiveness at each concentration collectively to the hill equation. Induction and emergence arms were computed separately for each condition. Parameter estimates and confidence intervals were computed using the Jacobian of the nonlinear regression model. Indications of significance are as follows: *p<0.05; **p<0.01; ***p<0.001; ****p<0.0001.
Supplementary Material
Video S1: Chemogenetic Activation of POA Tac1 Neurons Increases Home Cage Ambulatory Activity, Related to Figures 2 and 4. Video acquired during EEG/EMG polysomnography showed a noticeable increase in ambulatory activity in Tac1 hM3Dq mice that had received i.p. CNO (right cage) compared to those who had received i.p. vehicle (left and middle cages).
KEY RESOURCES TABLE
| REAGENT or RESOURCE | SOURCE | IDENTIFIER |
|---|---|---|
| Antibodies | ||
| Rabbit monoclonal anti-cFos (9F6) | Cell Signaling Technologies | Cat# 2250S, RRID: AB_2247211 |
| Rabbit polyclonal anti-RFP | Rockland | Cat# 600-401-379, RRID: AB_2209751 |
| Chicken polyclonal anti-mCherry | Abcam | Cat# ab205402, RRID: AB_2722769 |
| Chicken polyclonal anti-tyrosine hydroxylase | Abcam | Cat# ab76442, RRID: AB_1524535 |
| Rabbit polyclonal anti-histidine decarboxylase | American Research Products Inc | Cat# 03-16045, RRID: AB_1541512 |
| Mouse monoclonal anti-orexin A (97505) | R&D Systems | Cat# MAB763100 |
| Goat anti-rabbit, Alexa Fluor 488 | Thermo Fisher Scientific | Cat# A32731, RRID: AB_2633280 |
| Goat anti-rabbit, Alexa Fluor 594 | Thermo Fisher Scientific | Cat# A11012, RRID: AB_141359 |
| Goat anti-chicken, Alexa Fluor 594 | Thermo Fisher Scientific | Cat# A11042, RRID: AB_2534099 |
| Goat anti-rabbit, Alexa Fluor 647 | Thermo Fisher Scientific | Cat# A21244, RRID: AB_2535812 |
| Goat anti-chicken, Alexa Fluor 647 | Abcam | Cat# ab150175, RRID: AB_2732800 |
| Goat anti-mouse, Alexa Fluor 647 | Thermo Fisher Scientific | Cat# A21235, RRID: AB_2535804 |
| Bacterial and Virus Strains | ||
| AAV8-hSyn-DIO-hM3D(Gq)-mCherry | Addgene | Cat# 44361-AAV8 |
| AAV8-hSyn-DIO-hM4D(Gi)-mCherry | Addgene | Cat# 44362-AAV8 |
| AAV8-hSyn-DIO-mCherry | Addgene | Cat# 50459-AAV8 |
| Chemicals, Peptides, and Recombinant Proteins | ||
| Clozapine-N-oxide | Sigma-Aldrich | Cat# C0832-5MG |
| Isoflurane | Hospira Inc., Lake Forest, IL, USA | N/A |
| Sevoflurane | AbbVie Inc., North Chicago, IL, USA | N/A |
| Dental cement | A-M Systems | Cat# 525000; 526000 |
| Normal goat serum | Vector Laboratories | Cat# S-1000 |
| VectaShield Antifade mounting medium with DAPI | Vector Laboratories | Cat# H-1200-10, RRID: AB_2336790 |
| RNAscope Fluorescent Multiplex Kit | Advanced Cell Diagnostics | Cat# 320850; Probes: Mm-Tac1-C2, 41035-C2; Mm-mCherry-C3, 431201-C3 |
| Deposited Data | ||
| Anesthetic dose response data on Mendeley Data | This paper | https://dx.doi.org/10.17632/k45sgtmjc4.1 |
| Experimental Models: Organisms/Strains | ||
| Tac1-IRES-Cre: Tac1tm1.1(cre)Hze/J | Jackson Laboratories | Stock # 021877 |
| Software and Algorithms | ||
| Prism | GraphPad | Version 8, RRID: SCR_002798 |
| Open Ephys GUI | [70] | https://open-ephys.org |
| Matlab | MathWorks | Version R2019a, RRID: SCR_001622 |
| Accuscan Fusion | Omnitech Electronics | Version 4.1, RRID: SCR_017972 |
| Fiji | [69] |
https://imagej.net/Fiji RRID: SCR_002285 |
| Other | ||
| EEG pins | Digi-Key | Cat# ED85100-ND |
| EMG wires | A-M Systems | Cat# 787000 |
| EEG anchor screws | McMaster-Carr | Cat# 91800A050 |
| 32 channel headstage | Intan Technologies | Cat# C3314 |
| Infrared activity sensor pair | Omnitech Electronics | Cat# 71-SFX |
| Fusion home cage frame | Omnitech Electronics | Cat# 990-CSTM |
| SuperFrost Plus slides | Fisher Scientific | Cat# 12-550-15 |
HIGHLIGHTS.
Activation of POA Tac1 neurons promoted and stabilized wake over NREM and REM sleep.
Wakefulness caused by POA Tac1 activation is not due to increased anxiety.
POA Tac1 activation enhanced emergence from isoflurane and sevoflurane anesthesia.
The same neurons modulating endogenous arousal may sculpt states of anesthesia.
ACKNOWLEDGEMENTS
The authors thank Connor Brennan, Andrew McKinstry-Wu, Benjamin Harrison, Adeeti Aggarwal, and Brenna Shortal for their discussion and suggestions about the data. This work was funded the National Institutes of Health (R01GM088156 and R01GM107117 to M.B.K., R01GM124023 to A.P., and T32-HL007953 to S.L.R.) and by the Department of Anesthesiology and Critical Care at the University of Pennsylvania.
Footnotes
Publisher's Disclaimer: This is a PDF file of an unedited manuscript that has been accepted for publication. As a service to our customers we are providing this early version of the manuscript. The manuscript will undergo copyediting, typesetting, and review of the resulting proof before it is published in its final form. Please note that during the production process errors may be discovered which could affect the content, and all legal disclaimers that apply to the journal pertain.
DECLARATION OF INTERESTS
The authors declare no competing interests
REFERENCES
- 1.von Economo C (1930). Sleep as a problem of localization. J. Nerv. Ment. Dis 71, 249–259. [Google Scholar]
- 2.Sternson SM (2013). Hypothalamic survival circuits: Blueprints for purposive behaviors. Neuron 77, 810–824. [DOI] [PMC free article] [PubMed] [Google Scholar]
- 3.Wu Z, Autry AE, Bergan JF, Watabe-Uchida M, and Dulac CG (2014). Galanin neurons in the medial preoptic area govern parental behaviour. Nature 509, 325–330. [DOI] [PMC free article] [PubMed] [Google Scholar]
- 4.Scott N, Prigge M, Yizhar O, and Kimchi T (2015). A sexually dimorphic hypothalamic circuit controls maternal care and oxytocin secretion. Nature 525, 519–522. [DOI] [PubMed] [Google Scholar]
- 5.Tan CL, Cooke EK, Leib DE, Lin YC, Daly GE, Zimmerman CA, and Knight ZA (2016). Warm-Sensitive Neurons that Control Body Temperature. Cell 167, 47–59.e15. [DOI] [PMC free article] [PubMed] [Google Scholar]
- 6.Leib DE, Zimmerman CA, Poormoghaddam A, Huey EL, Ahn JS, Lin YC, Tan CL, Chen Y, and Knight ZA (2017). The Forebrain Thirst Circuit Drives Drinking through Negative Reinforcement. Neuron 96, 1272–1281.e4. [DOI] [PMC free article] [PubMed] [Google Scholar]
- 7.Allen WE, DeNardo LA, Chen MZ, Liu CD, Loh KM, Fenno LE, Ramakrishnan C, Deisseroth K, and Luo L (2017). Thirst-associated preoptic neurons encode an aversive motivational drive. Science (80-.). 357, 1149–1155. [DOI] [PMC free article] [PubMed] [Google Scholar]
- 8.Szymusiak R, Gvilia I, and McGinty D (2007). Hypothalamic control of sleep. Sleep Med. 8, 291–301. [DOI] [PubMed] [Google Scholar]
- 9.Chung S, Weber F, Zhong P, Tan CL, Nguyen TN, Beier KT, Hörmann N, Chang W-C, Zhang Z, Do JP, et al. (2017). Identification of preoptic sleep neurons using retrograde labelling and gene profiling. Nature. 545, 477–481. [DOI] [PMC free article] [PubMed] [Google Scholar]
- 10.Gallopin T, Fort P, Eggermann E, Cauli B, Luppi PH, Rossier J, Audinat E, Mühlethaler M, and Serafin M (2000). Identification of sleep-promoting neurons in vitro. Nature 404, 992–995. [DOI] [PubMed] [Google Scholar]
- 11.Lu J, Greco M. a, Shiromani P, and Saper CB. (2000). Effect of lesions of the ventrolateral preoptic nucleus on NREM and REM sleep. J. Neurosci 20, 3830–42. [DOI] [PMC free article] [PubMed] [Google Scholar]
- 12.Lu J, Bjorkum AA, Xu M, Gaus SE, Shiromani PJ, and Saper CB (2002). Selective Activation of the Extended Ventrolateral Preoptic Nucleus during Rapid Eye Movement Sleep. J. Neurosci 22, 4568–4576. [DOI] [PMC free article] [PubMed] [Google Scholar]
- 13.McGinty D, and Szymusiak R (2001). Brain structures and mechanisms involved in the generation of NREM sleep: Focus on the preoptic hypothalamus. Sleep Med. Rev 5, 323–342. [DOI] [PubMed] [Google Scholar]
- 14.Gong H, McGinty D, Guzman-Marin R, Chew K-T, Stewart D, and Szymusiak R (2004). Activation of c-fos in GABAergic neurones in the preoptic area during sleep and in response to sleep deprivation. J. Physiol 556, 935–946. [DOI] [PMC free article] [PubMed] [Google Scholar]
- 15.Nelson LE, Guo TZ, Lu J, Saper CB, Franks NP, and Maze M (2002). The sedative component of anesthesia is mediated by GABAA receptors in an endogenous sleep pathway. Nat. Neurosci 5, 979–984. [DOI] [PubMed] [Google Scholar]
- 16.Lu J, Nelson LE, Franks N, Maze M, Chamberlin NL, and Saper CB (2008). Role of endogenous sleep-wake and analgesic systems in anesthesia. J. Comp. Neurol 508, 648–662. [DOI] [PMC free article] [PubMed] [Google Scholar]
- 17.Moore JT, Chen J, Han B, Meng QC, Veasey SC, Beck SG, and Kelz MB (2012). Direct Activation of Sleep-Promoting VLPO Neurons by Volatile Anesthetics Contributes to Anesthetic Hypnosis. Curr. Biol 22, 2008–2016. [DOI] [PMC free article] [PubMed] [Google Scholar]
- 18.McCarren HS, Chalifoux MR, Han B, Moore JT, Meng QC, Baron-Hionis N, Sedigh-Sarvestani M, Contreras D, Beck SG, and Kelz MB (2014). α2-Adrenergic stimulation of the ventrolateral preoptic nucleus destabilizes the anesthetic state. J. Neurosci 34, 16385–96. [DOI] [PMC free article] [PubMed] [Google Scholar]
- 19.Han B, McCarren HS, O’Neill D, and Kelz MB (2014). Distinctive recruitment of endogenous sleep-promoting neurons by volatile anesthetics and a nonimmobilizer. Anesthesiology 121, 999–1009. [DOI] [PMC free article] [PubMed] [Google Scholar]
- 20.Zhang Z, Ferretti V, Güntan İ, Moro A, Steinberg EA, Ye Z, Zecharia AY, Yu X, Vyssotski AL, Brickley SG, et al. (2015). Neuronal ensembles sufficient for recovery sleep and the sedative actions of α2 adrenergic agonists. Nat. Neurosci 18, 553–561. [DOI] [PMC free article] [PubMed] [Google Scholar]
- 21.Li KY, Guan Y, and Krnjevic K (2009). Propofol Facilitates Glutamatergic Transmission to Neurons of the Ventrolateral Preoptic Nucleus. Anesthesiology 2, 1271–1278. [DOI] [PMC free article] [PubMed] [Google Scholar]
- 22.Liu Y-W, Zuo W, and Ye J-H (2013). Propofol stimulates noradrenalin-inhibited neurons in the ventrolateral preoptic nucleus by reducing GABAergic inhibition. Anesth. Analg 117. [DOI] [PMC free article] [PubMed] [Google Scholar]
- 23.Kaitin KI (1984). Preoptic area unit activity during sleep and wakefulness in the cat. Exp. Neurol 83, 347–357. [DOI] [PubMed] [Google Scholar]
- 24.Szymusiak R, and McGinty D (1986). Sleep-related neuronal discharge in the basal forebrain of cats. Brain Res. 370, 82–92. [DOI] [PubMed] [Google Scholar]
- 25.Szymusiak R, Alam N, Steininger TL, and McGinty D (1998). Sleep-waking discharge patterns of ventrolateral preoptic/anterior hypothalamic neurons in rats. Brain Res. 803, 178–188. [DOI] [PubMed] [Google Scholar]
- 26.Takahashi K, Lin JS, and Sakai K (2009). Characterization and mapping of sleep-waking specific neurons in the basal forebrain and preoptic hypothalamus in mice. Neuroscience 161, 269–292. [DOI] [PubMed] [Google Scholar]
- 27.Moffitt JR, Bambah-Mukku D, Eichhorn SW, Vaughn E, Shekhar K, Perez JD, Rubinstein ND, Hao J, Regev A, Dulac C, et al. (2018). Molecular, spatial, and functional single-cell profiling of the hypothalamic preoptic region. Science (80-.). 362. [DOI] [PMC free article] [PubMed] [Google Scholar]
- 28.Saito YC, Tsujino N, Hasegawa E, Akashi K, Abe M, Mieda M, Sakimura K, and Sakurai T (2013). GABAergic neurons in the preoptic area send direct inhibitory projections to orexin neurons. Front. Neural Circuits 7, 192. [DOI] [PMC free article] [PubMed] [Google Scholar]
- 29.Vanini G, Bassana M, Mast M, Colmenero AV, Hambrecht-wiedbusch VS, Mashour GA, Mondino A, Cerda I, and Phyle M (2020). Activation of Preoptic GABAergic or Glutamatergic Neurons Modulates Sleep-Wake Architecture, but Not Anesthetic State Transitions. Curr. Biol, 1–9. [DOI] [PMC free article] [PubMed] [Google Scholar]
- 30.Walsh RN, and Cummins RA (1976). The open-field test: A critical review. Psychol. Bull 83, 482–504. [PubMed] [Google Scholar]
- 31.Treit D, and Fundytus M (1988). Thigmotaxis as a test for anxiolytic activity in rats. Pharmacol. Biochem. Behav 31, 959–962. [DOI] [PubMed] [Google Scholar]
- 32.Simon P, Dupuis R, and Costentin J (1994). Thigmotaxis as an index of anxiety in mice. Influence of dopaminergic transmissions. Behav. Brain Res 61, 59–64. [DOI] [PubMed] [Google Scholar]
- 33.Nelson LE, Lu J, Guo T, Saper CB, Franks NP, and Maze M (2003). The alpha2-adrenoceptor agonist dexmedetomidine converges on an endogenous sleep-promoting pathway to exert its sedative effects. Anesthesiology 98, 428–436. [DOI] [PubMed] [Google Scholar]
- 34.Sun Y, Chen J, Pruckmayr G, Baumgardner JE, Eckmann DM, Eckenhoff RG, and Kelz MB (2006). High throughput modular chambers for rapid evaluation of anesthetic sensitivity. BMC Anesthesiol. 6. [DOI] [PMC free article] [PubMed] [Google Scholar]
- 35.Kelz MB, Sun Y, Chen J, Cheng Meng Q, Moore JT, Veasey SC, Dixon S, Thornton M, Funato H, and Yanagisawa M (2008). An essential role for orexins in emergence from general anesthesia. Proc. Natl. Acad. Sci. U. S. A 105, 1309–14. [DOI] [PMC free article] [PubMed] [Google Scholar]
- 36.Gompf H, Chen J, Sun Y, Yanagisawa M, Aston-Jones G, and Kelz MB (2009). Halothane-induced hypnosis is not accompanied by inactivation of orexinergic output in rodents. Anesthesiology 111, 1001–1009. [DOI] [PMC free article] [PubMed] [Google Scholar]
- 37.Lieb K, Ahlvers K, Dancker K, Strohbusch S, Reincke M, Feige B, Berger M, Riemann D, and Voderholzer U (2002). Effects of the neuropeptide substance P on sleep, mood, and neuroendocrine measures in healthy young men. Neuropsychopharmacology 27, 1041–1049. [DOI] [PubMed] [Google Scholar]
- 38.Andersen ML, Nascimento DC, MacHado RB, Roizenblatt S, Moldofsky H, and Tufik S (2006). Sleep disturbance induced by substance P in mice. Behav. Brain Res 167, 212–218. [DOI] [PubMed] [Google Scholar]
- 39.Otsuka M, and Yoshioka K (1993). Neurotransmitter functions of mammalian tachykinins. Physiol. Rev 73, 229–308. [DOI] [PubMed] [Google Scholar]
- 40.Guyenet PG, and Aghajanian GK (1977). Excitation of neurons in the nucleus locus coeruleus by substance P and related peptides. Brain Res. 136, 178–184. [DOI] [PubMed] [Google Scholar]
- 41.Zhang G, Wang L, Liu H, and Zhang J (2004). Substance P promotes sleep in the ventrolateral preoptic area of rats. Brain Res. 1028, 225–232. [DOI] [PubMed] [Google Scholar]
- 42.Kroeger D, Absi G, Gagliardi C, Bandaru SS, Madara JC, Ferrari LL, Arrigoni E, Münzberg H, Scammell TE, Saper CB, et al. (2018). Galanin neurons in the ventrolateral preoptic area promote sleep and heat loss in mice. Nat. Commun 9, 4129. [DOI] [PMC free article] [PubMed] [Google Scholar]
- 43.Petreanu L, Huber D, Sobczyk A, and Svoboda K (2007). Channelrhodopsin-2-assisted circuit mapping of long-range callosal projections. Nat. Neurosci 10, 663–668. [DOI] [PubMed] [Google Scholar]
- 44.Chang SE, Todd TP, Bucci DJ, and Smith KS (2015). Chemogenetic manipulation of ventral pallidal neurons impairs acquisition of sign-tracking in rats. Eur. J. Neurosci 42, 3105–3116. [DOI] [PMC free article] [PubMed] [Google Scholar]
- 45.Mahler SV, Vazey EM, Beckley JT, Keistler CR, Mcglinchey EM, Kaufling J, Wilson SP, Deisseroth K, Woodward JJ, and Aston-Jones G (2014). Designer receptors show role for ventral pallidum input to ventral tegmental area in cocaine seeking. Nat. Neurosci 17, 577–585. [DOI] [PMC free article] [PubMed] [Google Scholar]
- 46.Cichon J, and Gan W (2015). Branch-specific dendritic Ca2+ spikes cause persistent synaptic plasticity. Nature 520, 180–185. [DOI] [PMC free article] [PubMed] [Google Scholar]
- 47.Harding EC, Yu X, Miao A, Andrews N, Ma Y, Ye Z, Lignos L, Miracca G, Ba W, Yustos R, et al. (2018). A Neuronal Hub Binding Sleep Initiation and Body Cooling in Response to a Warm External Stimulus. Curr. Biol 28, 1–11. [DOI] [PMC free article] [PubMed] [Google Scholar]
- 48.Garcia-Rill E, and Skinner RD (1987). The mesencephalic locomotor region. I. Activation of a medullary projection site. Brain Res. 411, 1–12. [DOI] [PubMed] [Google Scholar]
- 49.Barthe JY, and Clarac F (1997). Modulation of the spinal network for locomotion by substance P in the neonatal rat. Exp. Brain Res 115, 485–492. [DOI] [PubMed] [Google Scholar]
- 50.Brocard F, Bardy C, and Dubuc R (2005). Modulatory effect of substance P to the brain stem locomotor command in lampreys. J. Neurophysiol 93, 2127–2141. [DOI] [PubMed] [Google Scholar]
- 51.Kinjo N, Atsuta Y, Webber M, Kyle R, Skinner RD, and Garcia-Rill E (1990). Medioventral medulla-induced locomotion. Brain Res. Bull 24, 509–516. [DOI] [PubMed] [Google Scholar]
- 52.Kelley AE, Stinus L, and Iversen SD (1979). Behavioral activation induced in the rat by substance P infusion into ventral tegmental area: Implication of dopaminergic A10 neurones. Neurosci. Lett 11, 335–339. [DOI] [PubMed] [Google Scholar]
- 53.Stinus L, Kelley AE, and Iversen SD (1978). Increased spontaneous activity following substance P infusion into A10 dopaminergic area. Nature 276, 616–618. [DOI] [PubMed] [Google Scholar]
- 54.Kalivas P, Deutch A, Maggio J, Mantyh P, and Roth R (1985). Substance K and substance P in the ventral tegmental area. Neurosci. Lett 57, 241–246. [DOI] [PubMed] [Google Scholar]
- 55.Breslau N, Roth T, Rosenthal L, and Andreski P (1996). Sleep disturbance and psychiatric disorders: A longitudinal epidemiological study of young adults. Biol. Psychiatry 39, 411–418. [DOI] [PubMed] [Google Scholar]
- 56.Monti JM, and Monti D (2000). Sleep disturbance in generalized anxiety disorder and its treatment. Sleep Med. Rev 4, 263–276. [DOI] [PubMed] [Google Scholar]
- 57.Yu X, Li W, Ma Y, Tossell K, Harris JJ, Harding EC, Ba W, Miracca G, Wang D, Li L, et al. (2019). GABA and glutamate neurons in the VTA regulate sleep and wakefulness. Nat. Neurosci 22, 106–119. [DOI] [PMC free article] [PubMed] [Google Scholar]
- 58.Ohayon MM, and Roth T (2003). Place of chronic insomnia in the course of depressive and anxiety disorders. J. Psychiatr. Res 37, 9–15. [DOI] [PubMed] [Google Scholar]
- 59.Khazaie H, and Masoudi M (2016). Sleep disturbances in veterans with chronic war-induced PTSD. J. Inj. Violence Res 8, 99–107. [DOI] [PMC free article] [PubMed] [Google Scholar]
- 60.Bilkei-Gorzo A, Racz I, Michel K, and Zimmer A (2002). Diminished anxiety- and depression-related behaviors in mice with selective deletion of the Tac1 gene. J. Neurosci 22, 10046–10052. [DOI] [PMC free article] [PubMed] [Google Scholar]
- 61.Santarelli L, Gobbi G, Debs PC, Sibille EL, Blier P, Hen R, and Heath MJS (2001). Genetic and pharmacological disruption of neurokinin 1 receptor function decreases anxiety-related behaviors and increases serotonergic function. Proc. Natl. Acad. Sci. U. S. A 98, 1912–1917. [DOI] [PMC free article] [PubMed] [Google Scholar]
- 62.Rupniak NMJ, Carlson EJ, Webb JK, Harrison T, Porsolt RD, Roux S, De Felipe C, Hunt SP, Oates B, and Wheeldon A (2001). Comparison of the phenotype of NK1R − / − mice with pharmacological blockade of the substance P (NK1) receptor in assays for antidepressant and anxiolytic drugs. Behav. Pharmacol 12, 497–508. [DOI] [PubMed] [Google Scholar]
- 63.Heldt S, Davis M, Ratti E, Corsi M, Trist D, and Ressler K (2009). Anxiolytic-like effects of the neurokinin 1 receptor antagonist GR-205171 in the elevated plus-maze and contextual fear-potentiated startle model of anxiety in gerbils. Behav. Pharmacol 20, 584–595. [DOI] [PMC free article] [PubMed] [Google Scholar]
- 64.Teixeira RM, Santos ARS, Ribeiro SJ, Calixto JB, Rae GA, and De Lima TCM (1996). Effects of central administration of tachykinin receptor agonists and antagonists on plus-maze behavior in mice. Eur. J. Pharmacol 311, 7–14. [DOI] [PubMed] [Google Scholar]
- 65.Jiang-Xie L-F, Yin L, Zhao S, Prevosto V, Han B-X, Dzirasa K, and Wang F (2019). A Common Neuroendocrine Substrate for Diverse General Anesthetics and Sleep. Neuron, 1–13. [DOI] [PMC free article] [PubMed] [Google Scholar]
- 66.Cardin JA, Carlén M, Meletis K, Knoblich U, Zhang F, Deisseroth K, Tsai LH, and Moore CI (2010). Targeted optogenetic stimulation and recording of neurons in vivo using cell-type-specific expression of Channelrhodopsin-2. Nat. Protoc 5, 247–254. [DOI] [PMC free article] [PubMed] [Google Scholar]
- 67.Zecharia AY, Nelson LE, Gent TC, Schumacher M, Jurd R, Rudolph U, Brickley SG, Maze M, and Franks NP (2009). The Involvement of Hypothalamic Sleep Pathways in General Anesthesia: Testing the Hypothesis Using the GABAA Receptor 3N265M Knock-In Mouse. J. Neurosci 29, 2177–2187. [DOI] [PMC free article] [PubMed] [Google Scholar]
- 68.Wasilczuk AZ, Proekt A, Kelz MB, and McKinstry-Wu AR (2016). High-density electroencephalographic acquisition in a rodent model using low-cost and open-source resources. J. Vis. Exp 2016, 1–10. [DOI] [PMC free article] [PubMed] [Google Scholar]
- 69.Schindelin J, Arganda-Carreras I, Frise E, Kaynig V, Longair M, Pietzsch T, Preibisch S, Rueden C, Saalfeld S, Schmid B, et al. (2012). Fiji: An open-source platform for biological-image analysis. Nat. Methods 9, 676–682. [DOI] [PMC free article] [PubMed] [Google Scholar]
- 70.Siegle JH, López AC, Patel YA, Abramov K, Ohayon S, and Voigts J (2017). Open Ephys: An open-source, plugin-based platform for multichannel electrophysiology. J. Neural Eng 14. [DOI] [PubMed] [Google Scholar]
- 71.Hudson AE, Calderon DP, Pfaff DW, and Proekt A (2014). Recovery of consciousness is mediated by a network of discrete metastable activity states. Proc. Natl. Acad. Sci. U. S. A 111, 9283–9288. [DOI] [PMC free article] [PubMed] [Google Scholar]
- 72.Weber F, Chung S, Beier KT, Xu M, Luo L, and Dan Y (2015). Control of REM sleep by ventral medulla GABAergic neurons. Nature 526, 435–438. [DOI] [PMC free article] [PubMed] [Google Scholar]
- 73.Wasilczuk AZ, Maier KL, and Kelz MB (2018). The Mouse as a Model Organism for Assessing Anesthetic Sensitivity 1st ed. (Elsevier Inc.) [DOI] [PMC free article] [PubMed] [Google Scholar]
- 74.McKinstry-Wu AR, Wasilczuk AZ, Harrison BA, Bedell VM, Sridharan MJ, Breig JJ, Pack M, Kelz MB, and Proekt A (2019). Analysis of stochastic fluctuations in responsiveness is a critical step toward personalized anesthesia. Elife 8, 1–25. [DOI] [PMC free article] [PubMed] [Google Scholar]
Associated Data
This section collects any data citations, data availability statements, or supplementary materials included in this article.
Supplementary Materials
Video S1: Chemogenetic Activation of POA Tac1 Neurons Increases Home Cage Ambulatory Activity, Related to Figures 2 and 4. Video acquired during EEG/EMG polysomnography showed a noticeable increase in ambulatory activity in Tac1 hM3Dq mice that had received i.p. CNO (right cage) compared to those who had received i.p. vehicle (left and middle cages).
Data Availability Statement
The original anesthetic dose response data are provided on Mendeley Data (https://dx.doi.org/10.17632/k45sgtmjc4.1). Due to the large size of the data files, the EEG/EMG recordings, imaging datasets and open field video files are available upon request from the Lead Contact. This study did not generate any unique code.