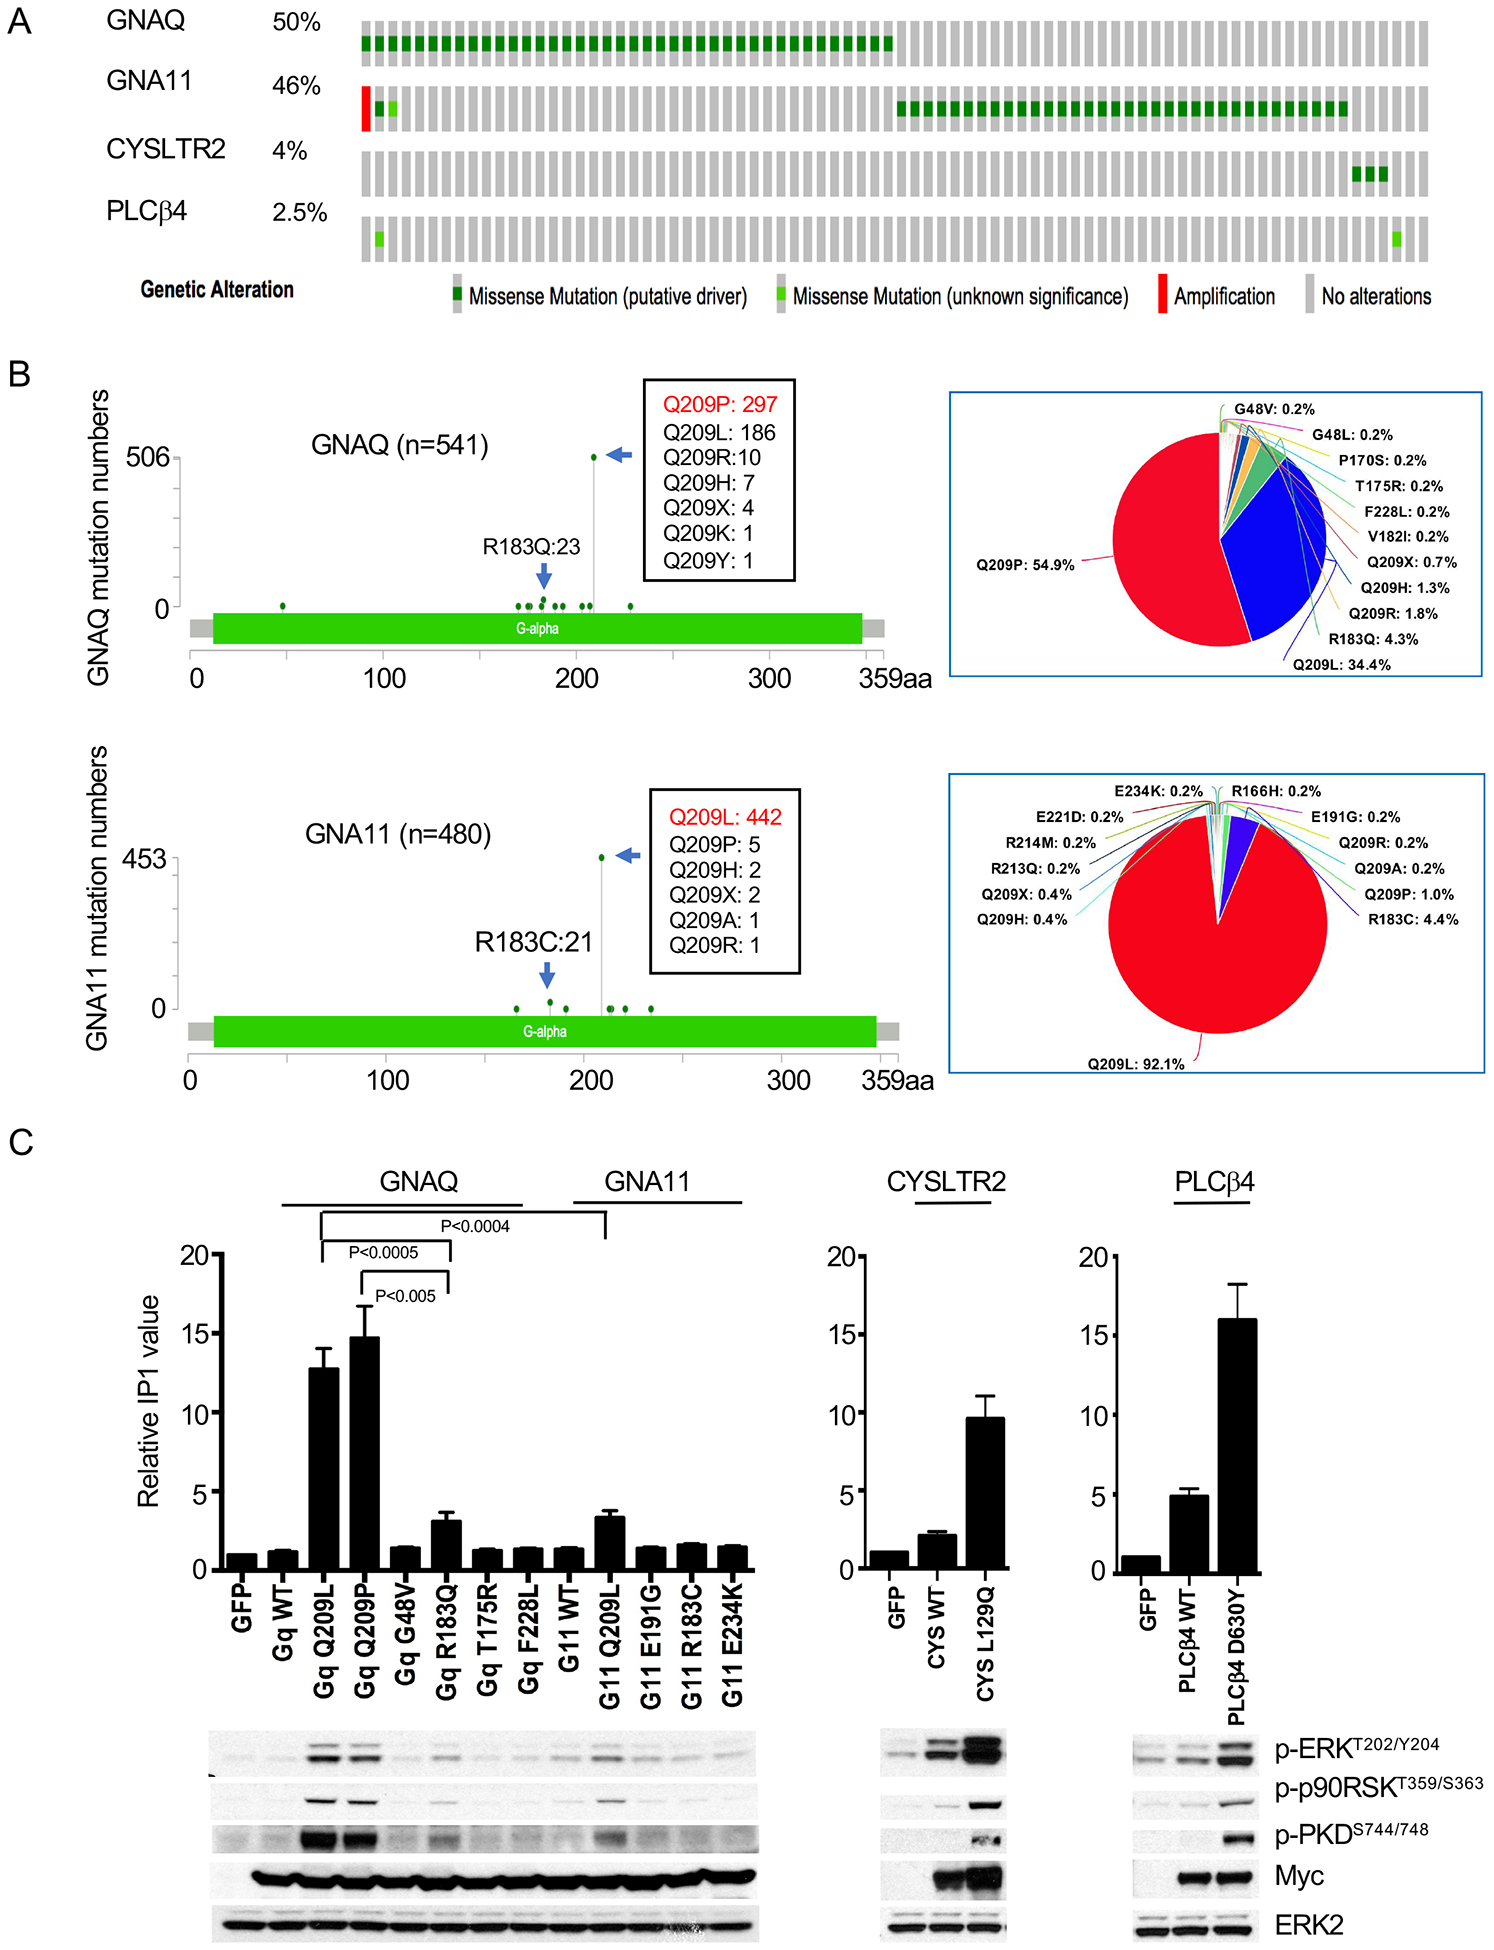
Figure 1: Functional characterization of Gαq pathway mutations in UM.

(A) Oncoprint of 80 UM samples from the TCGA UM project (https://www.cbioportal.org)(73, 74)
(B) Mutation spectra across the coding region of GNAQ and GNA11 from TCGA and COSMIC V91 (GNAQ: n=541; GNA11: n=480)
(C) IP1 accumulation to assess PLCβ activity induced by mutations in GNAQ, GNA11, and PLCB4. 293FT cells were transfected with 1μg of the respective cDNAs for 24 hours before measurement of IP1 (20,000 cells per sample) (top panel) and western blot (bottom panel). Error bars represent the SEM from at least three independent experiments. Representative western blot of three independent experiments is shown. Statistical significance was calculated by two-tailed unpaired Student t Test.
