

Abstract
Background:
Heart failure with preserved ejection fraction (HFpEF) constitutes half of all HF yet lacks effective therapy. Understanding its myocardial biology remains limited due to a paucity of heart tissue molecular analysis.
Methods:
We performed RNA sequencing on right ventricular septal endomyocardial biopsies prospectively obtained from patients with consensus criteria for HFpEF (n=41) and contrasted to RV-septal tissue from HF with reduced EF (HFrEF, n=30) and donor controls (CON, n=24). Principal component analysis (PCA) and hierarchical clustering tested for transcriptomic distinctiveness between groups and impact of co-morbidities, and differential gene expression with pathway enrichment contrasted HF groups to CON. Within HFpEF, non-negative matrix factorization (NMF) and weighted gene co-expression analysis (WGCNA) identified molecular subgroups and the resulting clusters were correlated with hemodynamic and clinical data.
Results:
HFpEF patients were more often women (59%), African American (68%), obese (median BMI 41), and hypertensive (98%), with clinical HF characterized by 65% NYHA III-IV, nearly all on a loop diuretic, and 70% with a HF hospitalization in the prior year. PCA separated HFpEF from HFrEF and CON with minimal overlap and this persisted after adjusting for primary co-morbidities: BMI, sex, age, diabetes, and renal function. Hierarchical clustering confirmed group separation. Nearly half the significantly altered genes in HFpEF versus CON (1882 up, 2593 down) changed in the same direction in HFrEF; however, 5745 genes were uniquely altered between HF groups. Compared to CON, uniquely upregulated genes in HFpEF were enriched in mitochondrial ATP synthesis/electron transport, pathways downregulated in HFrEF. HFpEF-specific down-regulated genes engaged endoplasmic reticulum stress, autophagy, and angiogenesis. BMI differences largely accounted for HFpEF upregulated genes whereas neither this nor broader co-morbidity adjustment altered pathways enriched in downregulated genes. NMF identified three HFpEF transcriptomic subgroups with distinctive pathways and clinical correlates, including a group closest to HFrEF with higher mortality, and a mostly female group with smaller hearts and pro-inflammatory signaling. These groupings remained after sex adjustment. WGCNA analysis yielded analogous gene-clusters and clinical groupings.
Conclusions:
HFpEF exhibits distinctive broad transcriptomic signatures and molecular subgroupings with particular clinical features and outcomes. The data reveal new signaling targets to consider for precision therapeutics.
Keywords: Heart failure, heart failure with preserved ejection fraction, RNA sequencing, bioinformatics, human, transcriptomics
Introduction
Heart failure with preserved ejection fraction (HFpEF) affects about half of all heart failure patients, impacting over 13 million adults worldwide1. Patients develop symptoms similar to HF with reduced ejection fraction (HFrEF), having high hospitalization rates, morbidity, and mortality2, 3. Unlike HFrEF, effective therapies for HFpEF remain lacking. Importantly, the past two decades have witnessed a transformation of HFpEF phenotypes from mostly hypertensive-cardiac hypertrophy with diastolic dysfunction4, 5 to a syndrome marked by severe obesity and associated comorbidities6–8. The heterogeneity of HFpEF - from its clinical presentation to comorbidities - is inculpated in the disappointing efforts to uncover successful treatment9. Little remains understood about the underlying biology of HFpEF, and while animal models can be helpful, they struggle to capture the multi-dimensionality of this syndrome.
One likely reason human HFpEF remains a clinical and therapeutic conundrum is that so little is known about its underlying molecular biology given the paucity of tissue harvesting. Existing heart data stems from small cohorts of mostly hypertensive patients with left ventricular (LV) hypertrophy, some with diffuse coronary disease, but with minimal obesity10–13. Tissue biopsies revealed a stiff myocardium from fibrosis and titin modifications5, 10, increased inflammatory markers11, and reduced protein kinase G activity12. Gene expression profiling has not been reported to date in a prospectively defined HFpEF cohort, thus whether there is a distinctive HFpEF signature despite clinical heterogeneity, if and how it is altered by obesity and other co-morbidities, and whether a molecular phenotype can identify clinical HFpEF subgroups, are all unknown.
Accordingly, the current study assessed gene expression profiles in HFpEF patients in comparison to HFrEF patients and donor controls, to test the hypotheses that 1) despite clinical heterogeneity, HFpEF subjects do exhibit a distinctive gene transcriptome that contrasts to HFrEF and controls; 2) these differences involve enriched pathways with strong association as well as independence from major co-morbidities such as obesity; and 3) molecular phenotyping can identify HFpEF sub-groups that exhibit distinct clinical features and prognosis. Our ultimate goal was to identify a transcriptomic signature of subsets of HFpEF patients that may ultimately lead to improved personalized therapeutics.
Methods
Data Sources:
Database files with a) raw mapped reads for each patient for all identified genes in each patient group; b) normalized read counts for these genes based on DESeq analysis; c) the primary data set we use in our analysis that has median reads and between group statistical analysis for genes that pass our noise-level filter (see below) for each patient group; d) data in a similar format but pertaining to HFpEF subgroups; and e) metadata with patient ID# to reference with the gene databases, tissue source (e.g. right versus left heart, and site), and disease group – are all posted in an online data repository14.
HFpEF Study Population
The HFpEF patient group consisted of those referred to the Johns Hopkins University HFpEF Clinic from 1/2016–4/2018 who provided informed consent for an endomyocardial biopsy research protocol as approved by the Johns Hopkins Institutional Review Board (IRB). All patients underwent clinical assessment, echocardiography, and invasive hemodynamic testing. HFpEF diagnostic criteria were based on current guideline definitions of HFpEF15–17 to include the following: signs and symptoms of clinical HF using Framingham criteria for HF18, left ventricular ejection fraction (LVEF) ≥ 50% by echocardiography within the prior 12 months, and at least two of the following: 1) structural heart disease (increased left ventricular [LV] wall thickness or left atrial [LA] diameter) or diastolic dysfunction on echocardiography19; 2) N-terminal pro–B-type natriuretic peptide (NTproBNP) ≥ 125 pg/mL; or 3) hemodynamic evidence of elevated left sided filling pressures (pulmonary artery wedge pressure [PAWP] ≥ 15 mmHg at baseline; or ≥ 25 mmHg with exercise). Exclusion criteria included prior history of LVEF < 40%, HF with mid-range EF (40–50%), greater than moderate valvular disease, infiltrative cardiomyopathy (including cardiac amyloidosis), restrictive cardiomyopathy, congenital heart disease, constrictive pericarditis, isolated pulmonary arterial hypertension, hypertrophic cardiomyopathy (known genetic variant, severe unexplained LVH, or presence of myocyte disarray on histology), or prior heart transplantation. Data are generally reported as median (25th, 75th percentiles).
Myocardial Tissue Procurement and Processing
HFpEF patients (n=63) underwent right heart catheterization with endomyocardial biopsy (Jawz Bioptome, Argon Medical, Frisco, TX) in the supine position via internal jugular venous access and echocardiographic guidance, which we have previously described. A total of 7–9 right ventricular (RV) septal biopsies were obtained, 3–4 for clinical histology, and the remaining rapidly frozen in liquid nitrogen for analysis. Clinical histology for myocyte hypertrophy and fibrosis was assessed by a cardiovascular pathologist. Quantitative analysis of myocardial fibrosis and CD68+ cell count was performed as previously described.20 Briefly, fibrosis (Masson’s trichrome) and myocyte hypertrophy (hematoxylin and eosin) were qualitatively graded by a cardiovascular pathologist and provided in the clinical report. Quantitative analysis of fibrosis (Masson’s trichrome) and CD68+ cell number (immunohistochemistry) was performed using HALO (Area Quantification FL algorithm, Indica Lab, Albuquerque, New Mexico). Biopsies positive for cardiac amyloidosis based on Congo Red staining (n=7) were excluded. RNA was isolated from 48 of the remaining samples with sufficient tissue, with RNA suitable for sequencing obtained in 41.
HFpEF biopsies were compared to RV mid-septal myocardium obtained from brain-dead organ donors (CON, n=24) and from HFrEF explanted hearts (n=30) in patients undergoing transplantation. HFrEF and CON tissues were provided from the University of Pennsylvania under an IRB-approved protocol. LV septal tissue from the same hearts were also obtained. The de-identified clinical/demographic data from these subjects were determined close to time-of-death (CON) or cardiac transplantation.
RNA isolation and preparation
Samples were crushed using a disposable pellet pestle (Kimble Chase, Vineland, NJ, USA) in 150 μL of Qiagen RLT buffer with 1% BME (Qiagen, Germantown, MD, USA) then homogenized in a Magna Lyser (Roche Diagnostics, Indianapolis, Indiana, USA) for 30 seconds at 6500 rpm. After homogenization, 298 μL of RNAase-free water and 2 μL of a 50 mg/mL proteinase K solution were added to each tube and mixed well. Samples were incubated at 55°C for 10 minutes, centrifuged, and the supernatant was collected into a new 1.5ml RNase-free microcentrifuge tube. RNA extraction was performed by using the RNeasy Micro Kit (Qiagen) with on-column DNase treatment (Qiagen) according to the manufacturer’s instructions. RNA concentration and integrity were assessed using a nanoDrop 8000 (Thermo Fisher, Waltham, MA, USA) and a Bioanalyzer (Agilent, Santa Clara, CA, USA). Samples with ≥100 ng total RNA and RNA integrity numbers (RIN) ≥7 were used for sequencing.
Analysis of Differential Gene Expression
The human genome was obtained in FASTA format (GRCh38) from Ensembl version 92 and gene set annotation in gtf format. The hisat2 indices were built from the genome index using hisat2-build21 from Hisat2 version 2.1.0. Raw RNAseq paired-end reads were aligned to the genome using hisat2 (default flags). The total reads per sample ranged from 30–50 million and all sample alignment mapping rates were above 97%. HTSeq was used to count reads mapping to individual genes by processing the sorted bam files with accepted read quality.22
DESeq223 was used to estimate differential gene expression between HFpEF, HFrEF and CON sample tissue starting with counts generated by HTSeq-count. Genes with a median read count <50 in each sample group, or those with a high correlation (>0.5) to beta-globin component of hemoglobin (from blood contamination in HFpEF biopsies) were excluded. Extreme expression outliers were detected and replaced based on the default Cook’s distance cutoff (99% quantile of the F(p,m-p) distribution with p the number of parameters including the intercept and m number of samples). Gene expression was normalized using the DESeq2 median of ratios normalization. Differentially expressed genes were defined using the 5% FDR (False Discovery Rate, Benjamini-Hochberg method) threshold for significance. Adjustment for covariates was performed using generalized linear models within DESeq2. The full set of processed detected genes were first examined using principal component analysis (PCA) and unsupervised hierarchical cluster analysis (UHCA). In clustering analysis, the variance stabilizing transform of the raw reads was used along with hierarchical clustering based on Pearson correlation. PCA was performed in R, using DEseq2 function plotPCA from the variance stabilizing transformation of the read counts. Gene pathway enrichment (KEGG and gene ontology (GO)) was determined with clusterProfiler using R. Differential gene expression in specific pathways used KEGG or BIO-RAD® lists, calculating z-scores ([observed-mean]/standard deviation) for each gene in the pathway comparing CON to either HFpEF or HFrEF.
Weighted Correlation Network Analysis of HFpEF Samples
Weighted correlation network analysis, WGCNA, was used to construct gene modules, based on correlation in expression levels in the HFpEF sample cohort.24 The modules consist of functionally related genes and thus different modules tend to be involved in individual functions. Three patients (7709, 7715, 7546) were excluded from this analysis based on low correlation with other HFpEF samples, from sample-sample correlation analysis (Figure I in the Supplement). Using the HFpEF expression data (13,265 genes after the previously described low count and blood contamination filtering steps), a correlation matrix was created which was transformed into a Topological Overlap Matrix (TOM) using a signed network in the blockwiseModules function (using parameters: power=16 (selected from pickSoftThreshold cutoff of 0.95), minModuleSize = 30, mergeCutHeight = 0.25). 8 gene modules were identified, consisting of between 62 and 477 genes. Next, clinical traits were associated with each of the modules from their Pearson correlation with the module eigengenes (first principal component) calculated using the function moduleEigengenes. Lastly, a pathway analysis was conducted as described above for each set of module genes.
Non-Negative Matrix Factorization to Identify Gene-Expression Based HFpEF Clusters
Non-negative matrix factorization, NMF, was used to determine if there were transcriptional subgroups within the HFpEF patient samples25. NMF uses an iterative algorithm to detect a subset of features/genes to split the data into k groups. The same patient outliers from the WGCNA were excluded from this analysis (samples 7709, 7715, 7546). Using the remaining 38 samples, the NMF Brunet algorithm detected 3 clusters (based on running NMF 40 times for each k =2,..,5, with a fixed initial seed and using cophenetic coefficient, a measure of robustness to select the optimum number of clusters).26 The analysis was then repeated 250 times with k=3 with different initial conditions for model fitting. As per the NMF algorithm, metagenes for each of the 3 clusters were identified using consensus clustering. Differential gene expression was performed between controls and each HFpEF NMF subgroup individually. Clinical characteristics were compared between the 3 clusters of HFpEF patients.
We performed Kaplan-Meier time-to-event analysis using both HF hospitalizations and deaths during 12months of follow-up. Log-rank test was used to assess statistical significance between the curves of the three HFpEF groups (determined by NMF). Three patients were excluded due to very short follow-up (2 weeks to 2 months).
Statistical Analysis
Continuous data are generally reported as median (25th, 75th percentiles). Categorical data are generally reported as number, %. Significance threshold was determined by the 5% FDR adjusted for multiple comparisons by the Benjamini-Hochberg method. Adjustment for covariates was performed using generalized linear models within DESeq2. Agnostic clustering was performed on variance stabilizing transform of the raw reads using principal component analysis and unsupervised hierarchical clustering. Gene pathway enrichment was performed using a Fisher’s exact test of differentially expressed genes within the pathway of interest was used to determine pathway enrichment. Targeted pathway analysis compared z-scores for each gene in the pathway using Wilcoxon rank-sum test. WGCNA was performed excluding 3 outliers based on the sample-sample correlation analysis. Pearson correlation was used to determine clinical characteristics associated with each gene cluster. NMF was used to subgroup HFpEF. Kaplan-Meier time-to-event analysis with log-rank test was performed using the three transcriptomic subgroups determined by NMF. Events included HF hospitalizations and deaths. Kruskal-Wallis and Wilcoxon rank-sum tests were used for continuous variables, and Fisher’s exact was used for categorical variables to compare clinical characteristics between groups.
Results
Baseline Characteristics of Study Patients
Given the heterogeneity of HFpEF patients, we provide a comprehensive characterization of clinical, echocardiographic and invasive hemodynamic data of the present study group (Table 1 and Supplemental Table 1). Their median age was 62 years, 59% were female, and 68% African American, with a high burden of co-morbidities including hypertension (98%), diabetes (63%), and atrial fibrillation (24%). Median BMI was 40.8 kg/m2 (36–46). Clinical HF was evident with 70% having been hospitalized in the prior 1 year, 95% on loop diuretic therapy, and a median NT-proBNP of 169 pg/mL (94–614) in this obese cohort. Echocardiography confirmed preserved EF, increased LV wall thickness, and diastolic dysfunction. Invasive hemodynamics revealed elevated right atrial and pulmonary artery pressures and a PAWP median of 20mmHg (15–24 mmHg). Elevated PA pressures were most often due to left sided heart disease with only 12% having criteria for pre-capillary pulmonary hypertension (PVR ≥ 3 Wood units). The group displayed substantial heterogeneity as seen in clinical practice with respect to systolic blood pressure, BMI, LV mass index, serum NTproBNP, mean PA pressure, and renal function (Figure II in the Supplement).
Table 1.
Clinical characteristics of HFpEF, HFrEF, and Donor Control Groups
| Control (24) | HFpEF (41) | HFrEF (30) | P value | |
|---|---|---|---|---|
| Age, years | 57 (52, 63) | 62 (53, 69)††† | 50 (45, 62) | 0.003 |
| Female Sex, n (%) | 10 (42%) | 24 (59%) | 10 (33%) | 0.1 |
| Race/Ethnicity | <0.001 | |||
| African-American, n (%) | 1 (4%) | 28 (68%)***,††† | 8 (27%)* | |
| Caucasian, n (%) | 22 (92%) | 11 (27%) | 21 (70%) | |
| Hispanic, n (%) | 1 (4%) | 1 (2%) | 0 (0%) | |
| Medications | ||||
| ACEi or ARB, n (%) | 6 (25%) | 26 (63%)** | 20 (67%)** | 0.003 |
| Beta Blocker, n (%) | 6 (25%) | 22 (54%)*,††† | 28 (93%)*** | <0.001 |
| Loop Diuretic, n (%) | 0 (0%) | 39 (95%)*** | 30 (100%)*** | <0.001 |
| Past Medical History | ||||
| Hypertension, n (%) | 11 (46%) | 40 (98%)*** | 30 (100%)*** | <0.001 |
| Diabetes, n (%) | 3 (12%) | 26 (63%)***,† | 9 (30%) | <0.001 |
| Coronary artery disease, n (%) | 1 (4%) | 4 (10%) | 5 (17%) | 0.36 |
| Atrial fibrillation or flutter, n (%) | 3 (12%) | 10 (24%)†† | 19 (63%)*** | <0.001 |
| Etiology of HFrEF | ||||
| Familial cardiomyopathy | 6 (20%) | |||
| Ischemic heart disease | 6 (20%) | |||
| Left ventricular non- compaction | 2 (6.7%) | |||
| Non-ischemic dilated cardiomyopathy | 15 (50%) | |||
| Sarcoidosis | 1 (3.3%) | |||
| BMI, kg/m2 | 27 (22, 31) | 41 (36, 46)***,††† | 26 (23, 29) | <0.001 |
| LVEF, % | 61 (60, 65) | 65 (60, 70)††† | 18 (11, 20)*** | <0.001 |
| LVEDD, cm | 4.0 (3.9, 4.5) | 4.6 (4.0, 5.0) *,††† | 6.8 (6.2, 7.3)*** | <0.001 |
| LV posterior wall, mm | 9.5 (8.0, 11.0) | 12.0 (9.7, 13.0)*,††† | 8.55 (8.0, 10.0) | <0.001 |
| Sex-adjusted LV mass/height1.7, g/m1.7 | 95 (86, 115) | 107 (83, 131)† | 121 (113, 150)** | 0.004 |
| LVMI, g/m2 | 118 (97, 138) | 95 (80, 119)**,††† | 146 (131, 158)*** | <0.001 |
| eGFR, mL/min/1.73m2 | 83 (56, 104) | 48 (33, 70)**,†† | 70 (56, 82) | 0.003 |
| Invasive Hemodynamics | ||||
| RA, mmHg | N/A | 12 (8, 15)†† | 7 (5, 11) | 0.012 |
| PASP, mmHg | N/A | 45 (33, 54) | 48 (40, 56) | 0.68 |
| PA mean, mmHg | N/A | 29 (23, 35) | 29 (23, 34) | 0.55 |
| PAWP, mmHg | N/A | 20 (15, 24) | 20 (16, 24) | 0.94 |
| CI, L/min/m2 | N/A | 2.52 (2.29, 3.09)††† | 2.05 (1.80, 2.30) | <0.001 |
| PVR ≥ 3 WU, n (%) | N/A | 5 (12%) | 9 (30%) | 0.077 |
| RA/PAWP ratio | N/A | 0.57 (0.50, 0.62)†† | 0.39 (0.27, 0.56) | 0.002 |
| PA Pulsatility Index | N/A | 2.0 (1.4, 2.7)††† | 3.8 (2.8, 6.0) | <0.001 |
Data are n (%) or median (25th-75th percentile). P-value displayed for Fisher’s exact test used for categorical variables. Kruskal-Wallis test used for continuous variables. Post-hoc between group comparison statistics (Wilcoxon):
p<0.05 vs Control,
p≤0.01 vs Control,
p≤0.001 vs Control.
p<0.05 vs HFrEF,
p≤0.01 vs HFrEF,
p≤0.001 vs HFrEF.
ACEi, angiotensin converting enzyme inhibitor; ARB, angiotensin II receptor blocker. All other abbreviations as in Table 1. N/A, invasive hemodynamics not available for control patients. Sex-adjusted LV mass/height1.7 was calculated by multiplying by a constant of 1.28 for women.
Table 1 provides additional data for CON and HFrEF cohorts. These subjects were younger, more often Caucasian, had less diabetes, better renal function, and a lower median BMI. Eighty percent of HFrEF patients had non-ischemic cardiomyopathy.
HFpEF, HFrEF, and CON have Distinct mRNA-Expression Profiles
The filtered RNAseq read-set identified ~13,000 genes. Principal component analysis utilizing all RV septum expressed genes separated these into three distinct groups, with only a few overlapping patients in HFpEF and HFrEF (Figure 1A). PCA was also performed after first adjusting for sex only and sex plus the 4 other major covariates that differed between HFpEF and HFrEF: age, diabetes, BMI, and renal function (eGFR). The results show rotation of the vectors with a bit more overlap, but there is still clear separation of the groups (Figure 1B, Figure III in the Supplement). Unsupervised hierarchical cluster analysis (UHCA, Figure 1C) also identified three distinct groupings, with 88% of HFpEF, 97% of HFrEF, and 100% CON subjects clustering within their category. Despite HFpEF clinical heterogeneity, the vast majority of genes exhibited a coefficient of variation among patients of <30% (23% [85%−36%]), similar to HFrEF and CON (Figure IV in the Supplement). As we had sampled the RV in all cases to match with HFpEF biopsy site, we also tested if RV and LV septal transcripts correlate. This has been found in normal hearts27; here we examined HFrEF where tissue from both septal sides was obtained. We found an extremely high correlation of gene expression independent of presence or absence of pulmonary hypertension (Figure V in the Supplement). PCA and UHCA of RV and LV data from HFrEF and CON groups also found both to intermix within their group while remaining segregated from the other groups (Figure V in the Supplement).
Figure 1. Transcriptomic differences between HFpEF and HFrEF.
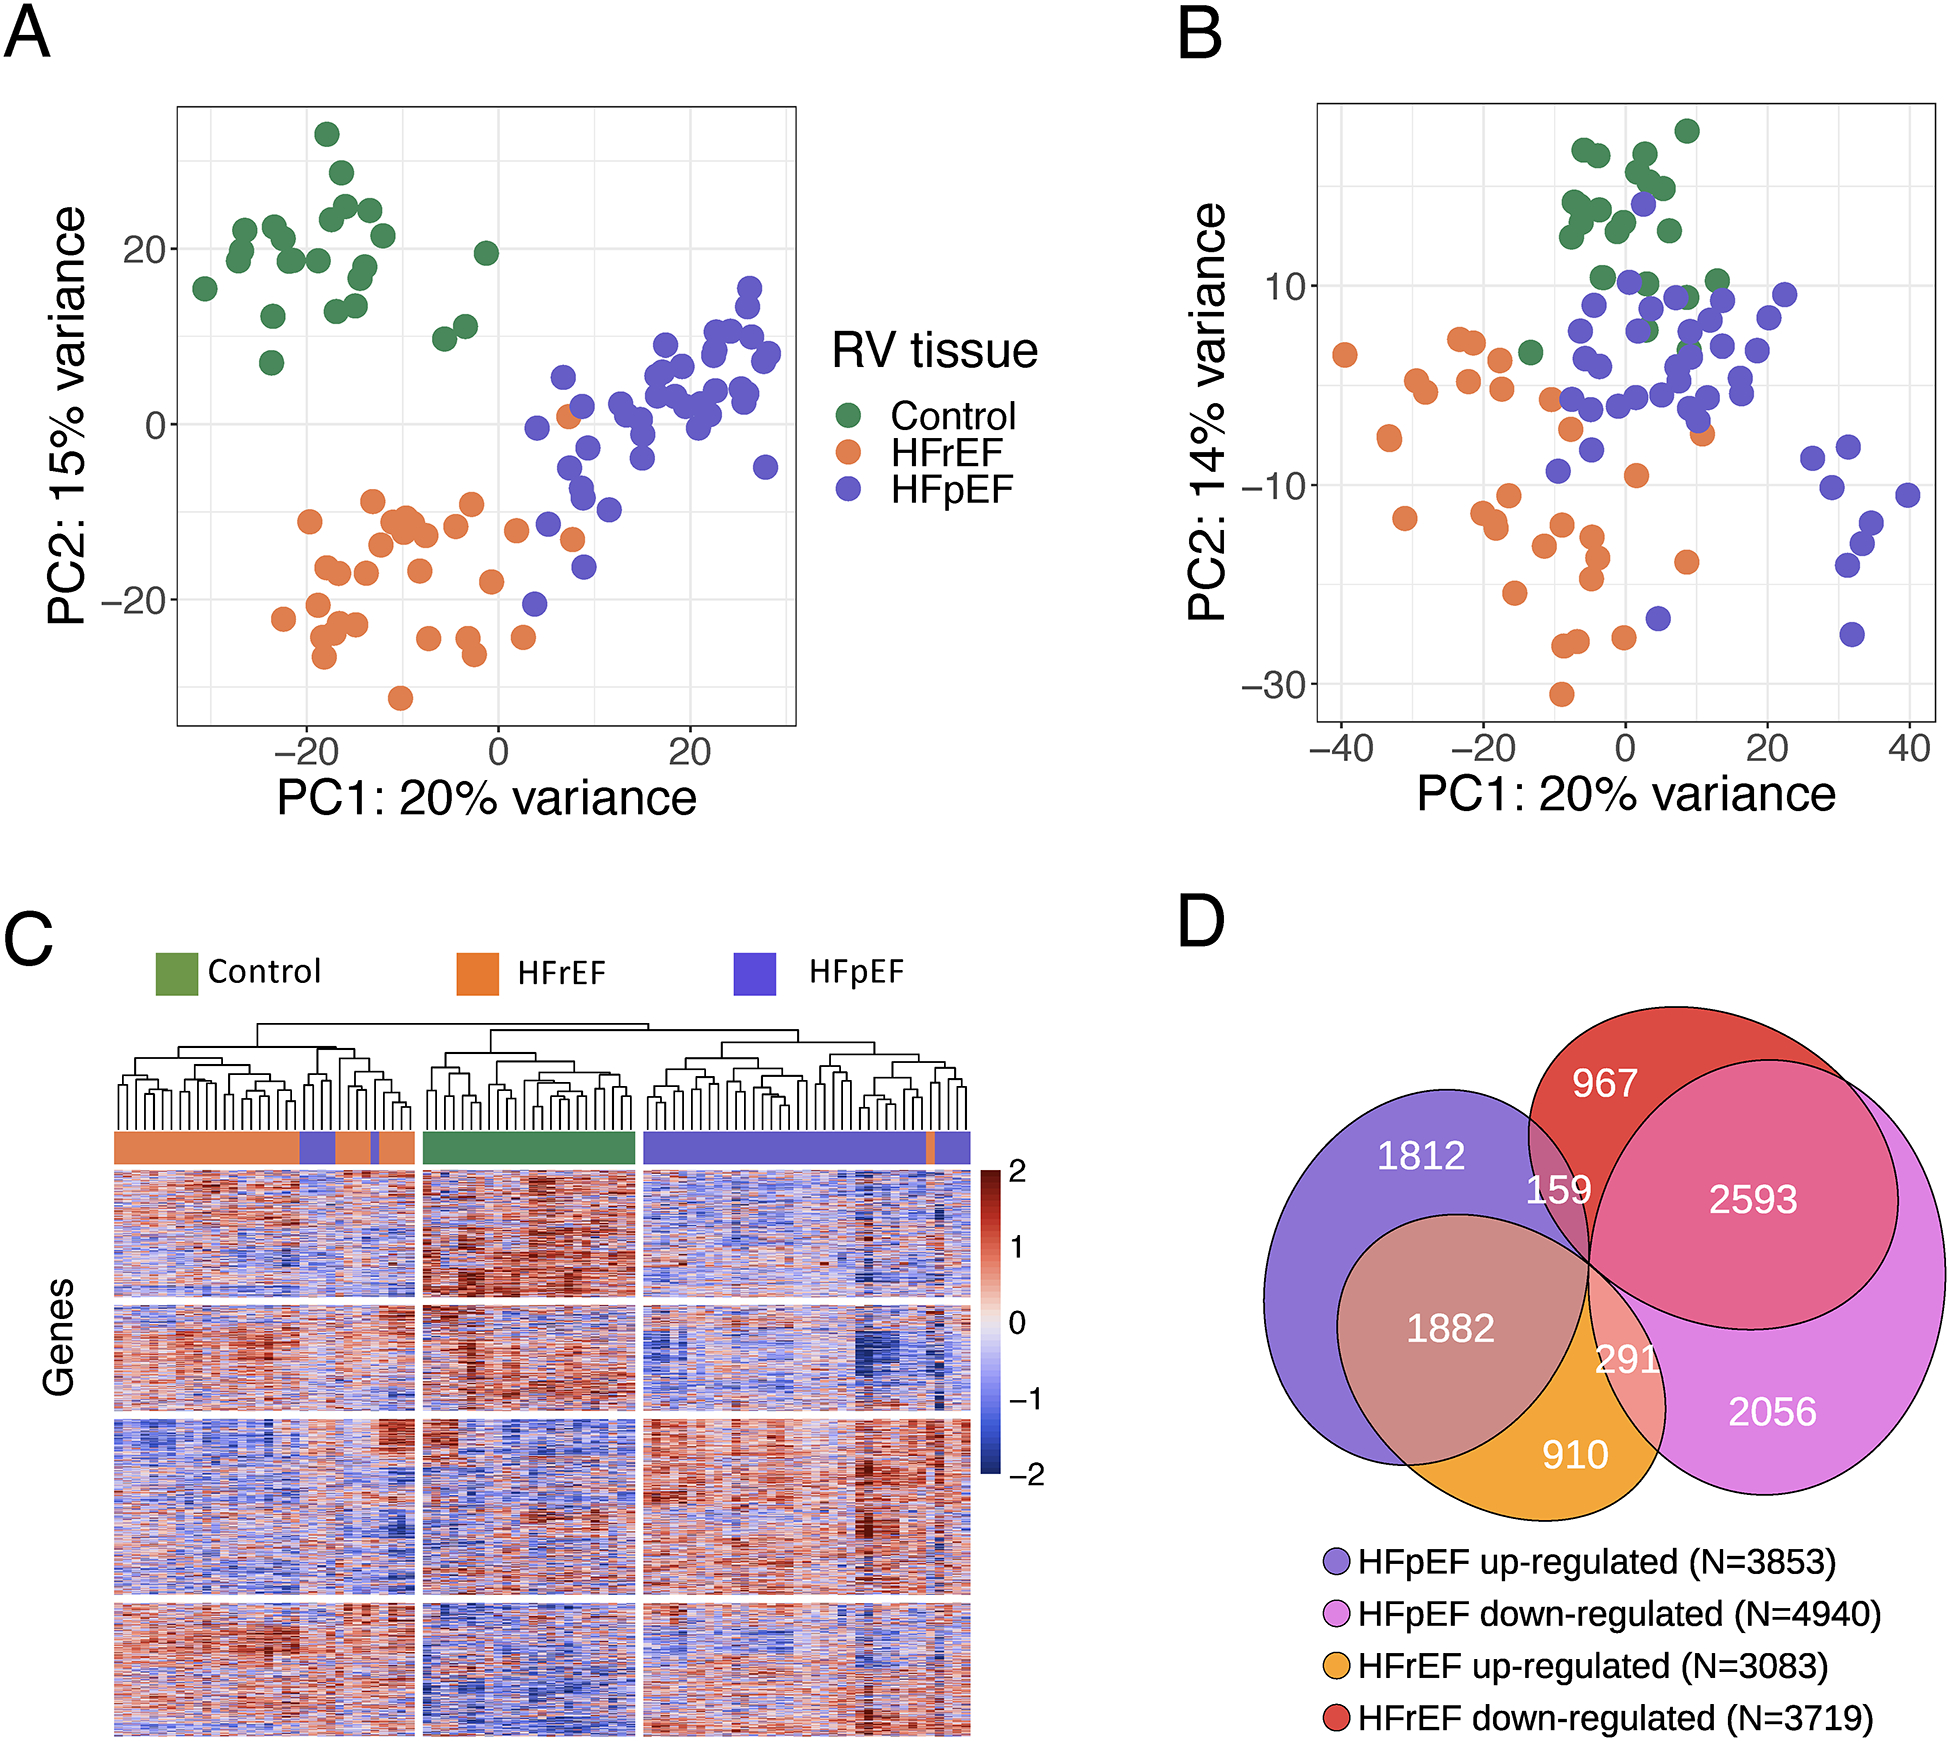
RNAseq was performed on CON (n=24), HFrEF (n=30), and HFpEF (n=41). A) Principal component (PC) analysis using all identified genes for CON (green), HFrEF (orange), and HFpEF (purple) reveals within group clusters with minimal overlap. B) Principal component analysis after adjustment for age, sex, diabetes, body mass index [BMI], and estimated glomerular filtration rate. C) Hierarchical clustering analysis using all identified genes, using Pearson correlation, shown as a heatmap of variance stabilizing transforms of the reads that also largely separates the groups. Only 5 HFpEF patients grouped into HFrEF; 1 HFrEF patient grouped into HFpEF. D) Venn diagram of differentially expressed genes (5% FDR threshold) for the three groups, their directions versus CON, and relative portion unique or shared by each HF group.
In total, 8793 genes were differentially expressed between HFpEF and CON and 6802 genes between HFrEF and CON, using a 5% FDR threshold. For each directional change, nearly half were shared, while ~5% went in opposite directions (Figure 1D). Up or downregulated genes in each HF group were subjected to gene ontology and KEGG pathway enrichment analysis (Figure VI in the Supplement). This identified inflammatory and immune response pathways enriched in both, but uniquely upregulated pathways in HFpEF to be mitochondrial ATP synthesis and oxidative phosphorylation, that were downregulated in HFrEF. Uniquely downregulated HFpEF genes were epigenetic modulators, membrane morphogenesis/organization, organonitrogen signaling, and receptor-coupled kinase signaling, several being upregulated in HFrEF.
HFpEF is proposed to have enhanced oxidative stress, fibrotic, hypertrophic, and inflammatory signaling, and depressed nitric oxide and endoplasmic reticular signaling28. We therefore examined differential expression between each HF group and CON in these and other selective pathways. Figure 2 plots Z-scores for genes in each pathway. HFpEF had enhanced expression of oxidative phosphorylation but lower expression of endoplasmic reticular, cGMP-related, autophagy, fibrosis and hypertrophy related genes compared to their alterations in HFrEF. By contrast, oxidant stress, inflammatory, and NO-signaling pathway genes were similarly impacted.
Figure 2. Gene expression differences between HFpEF and HFrEF within targeted pathways of interest.
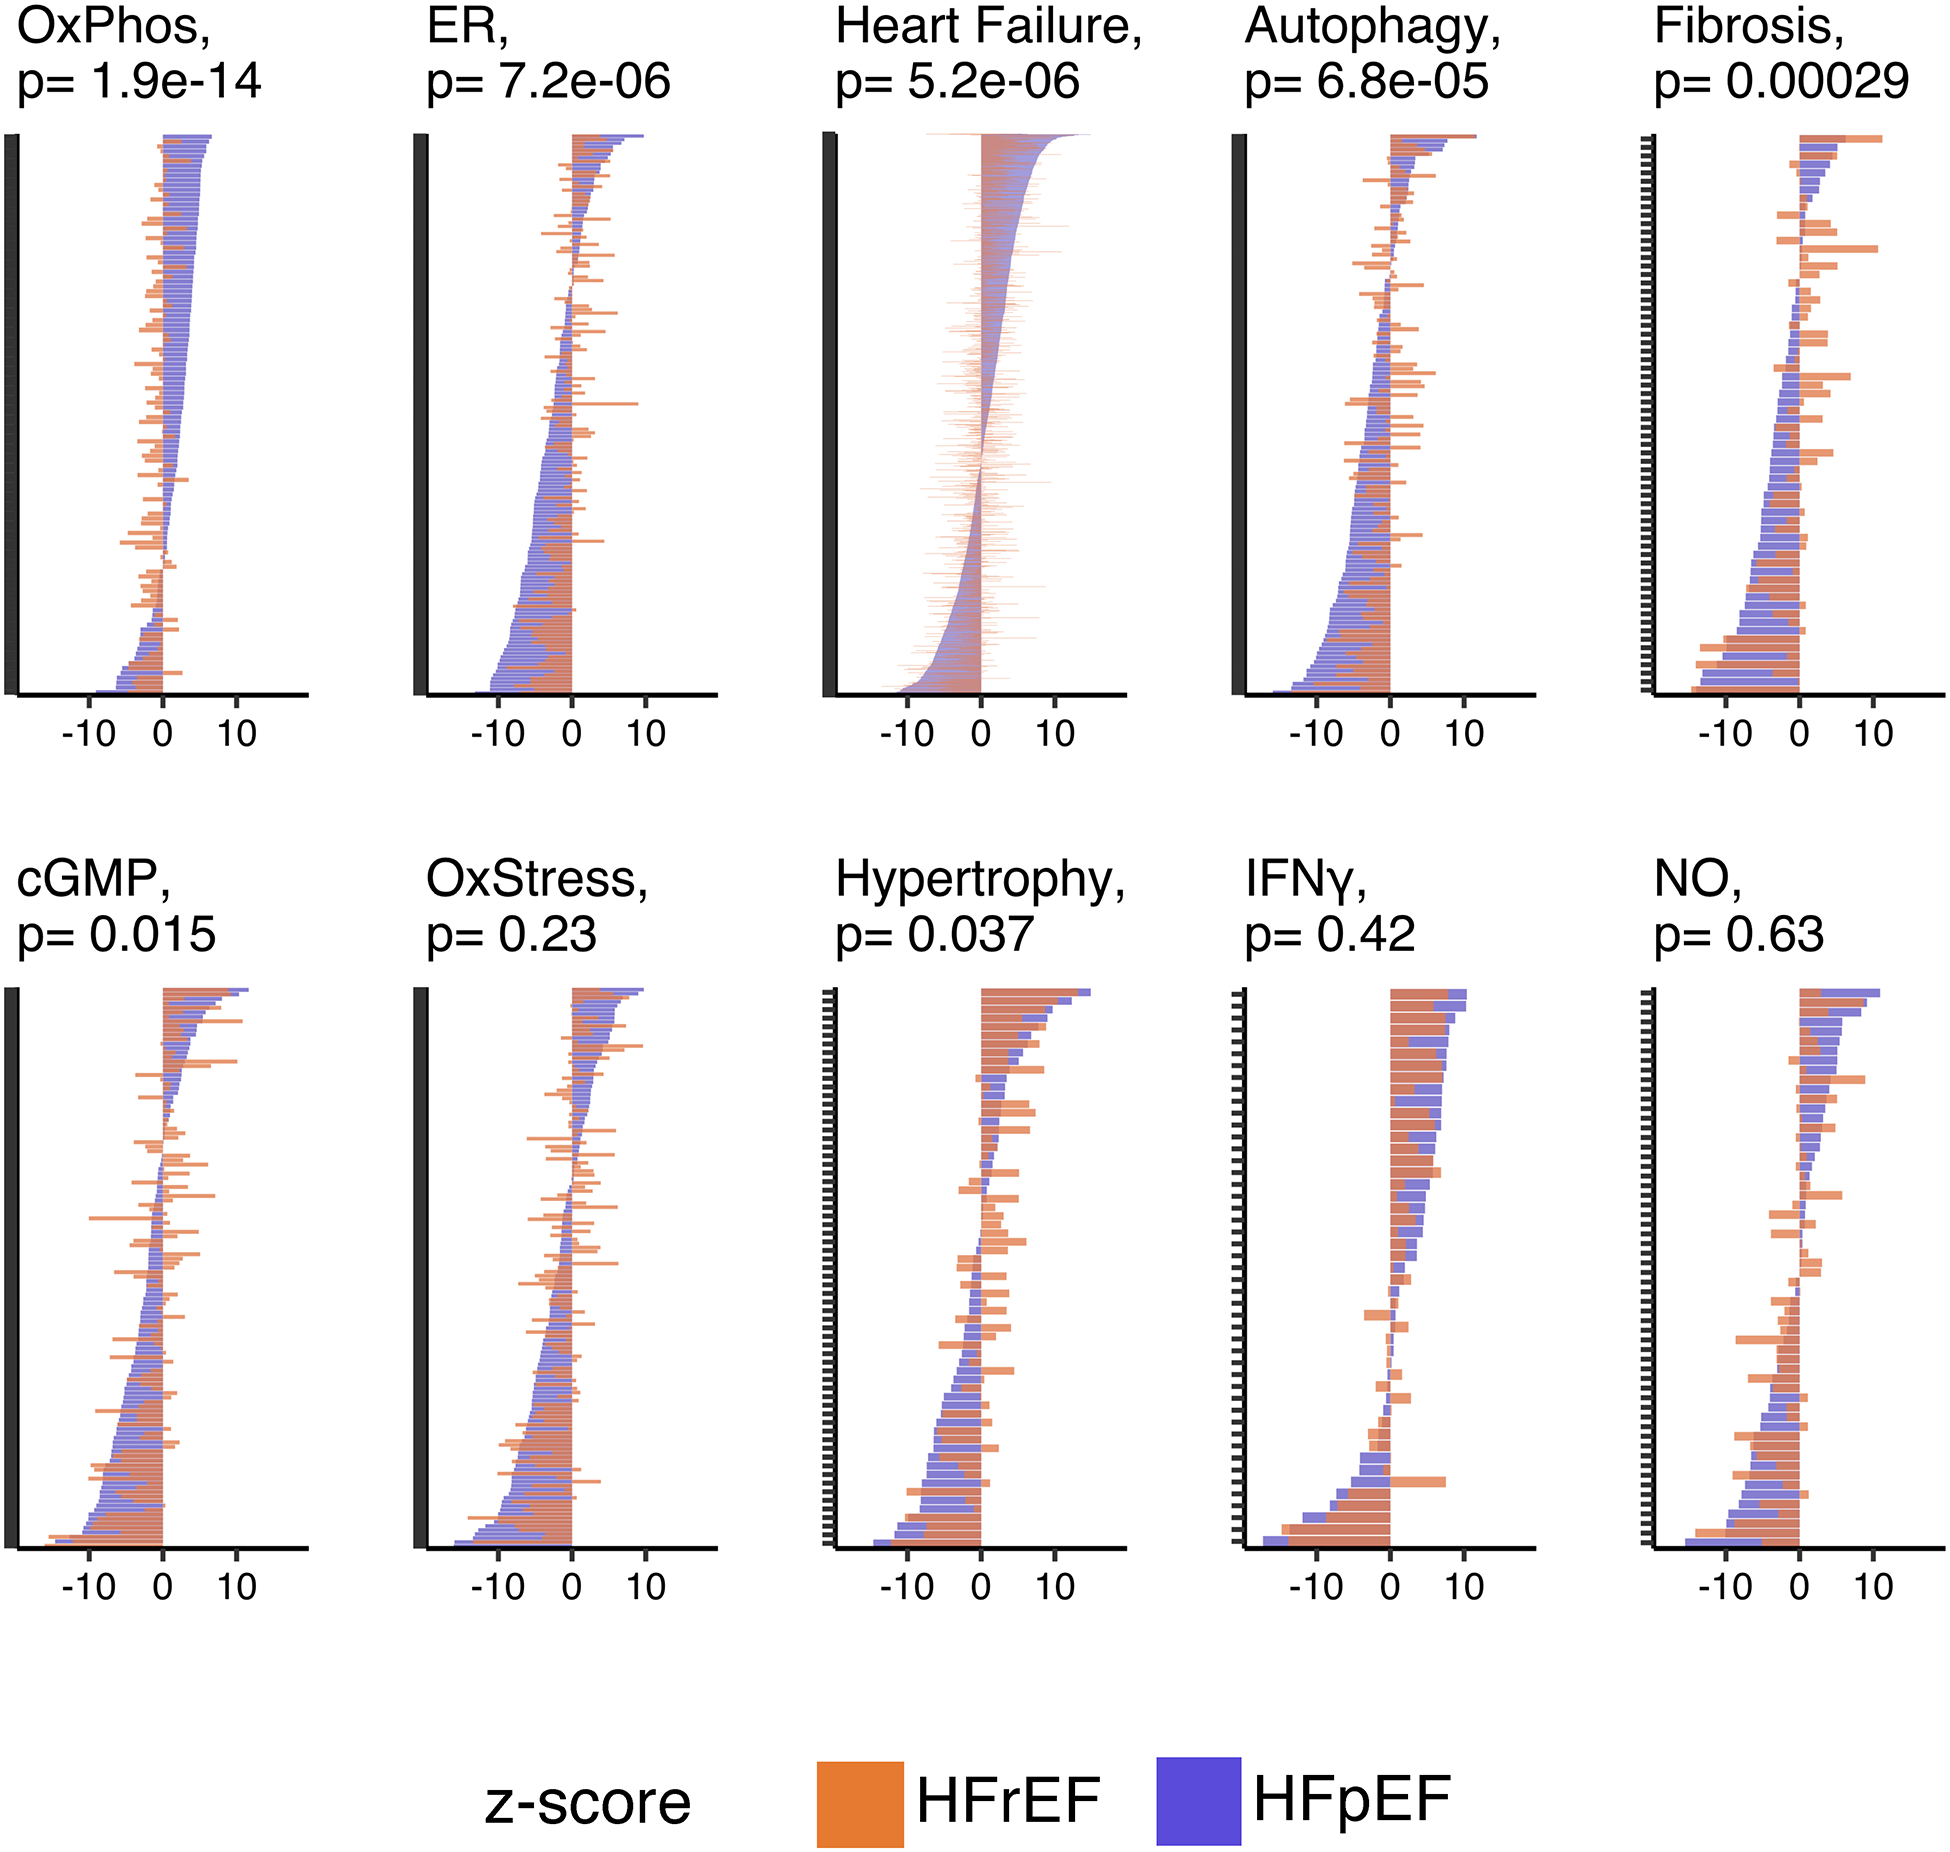
Gene-expression changes in HFpEF vs CON (purple) and HFrEF vs CON (orange) in 10 targeted pathways. Each plot is displayed as Z-scores for individual genes. Vertical placement is based highest-lowest HFpEF vs CON scores. Wilcoxon rank-sum P value displayed for differences in Z-scores between HF groups. OxPhos, oxidative phosphorylation; ER, protein processing in the endoplasmic reticulum; cGMP, cyclic guanosine monophosphate; OxStress, oxidative stress; IFNγ, Interferon gamma; NO, nitric oxide.
Influence of HFpEF Covariates on HFpEF Gene Expression Changes
To test the potential influence of major HFpEF morbidities, we repeated pathway analysis of differentially expressed genes obtained after adjusting for clinical covariates within DESeq2, including sex or BMI alone or combined with age, diabetes, and eGFR. Downregulated gene-enriched pathways were unchanged despite co-morbidity adjustment (Figure 3A). By contrast, upregulated gene pathways were no longer significant after adjusting for all 5 comorbidities and were mostly accounted for by adjusting for BMI alone (Figure 3B). Sex adjustment did not affect pathway enrichment. Thus, the upregulated HFpEF transcriptomic signature is largely associated with obesity but the downregulated one is independent of BMI and other major covariates.
Figure 3. Impact of co-morbidities and functional analysis of differentially expressed HFpEF genes.
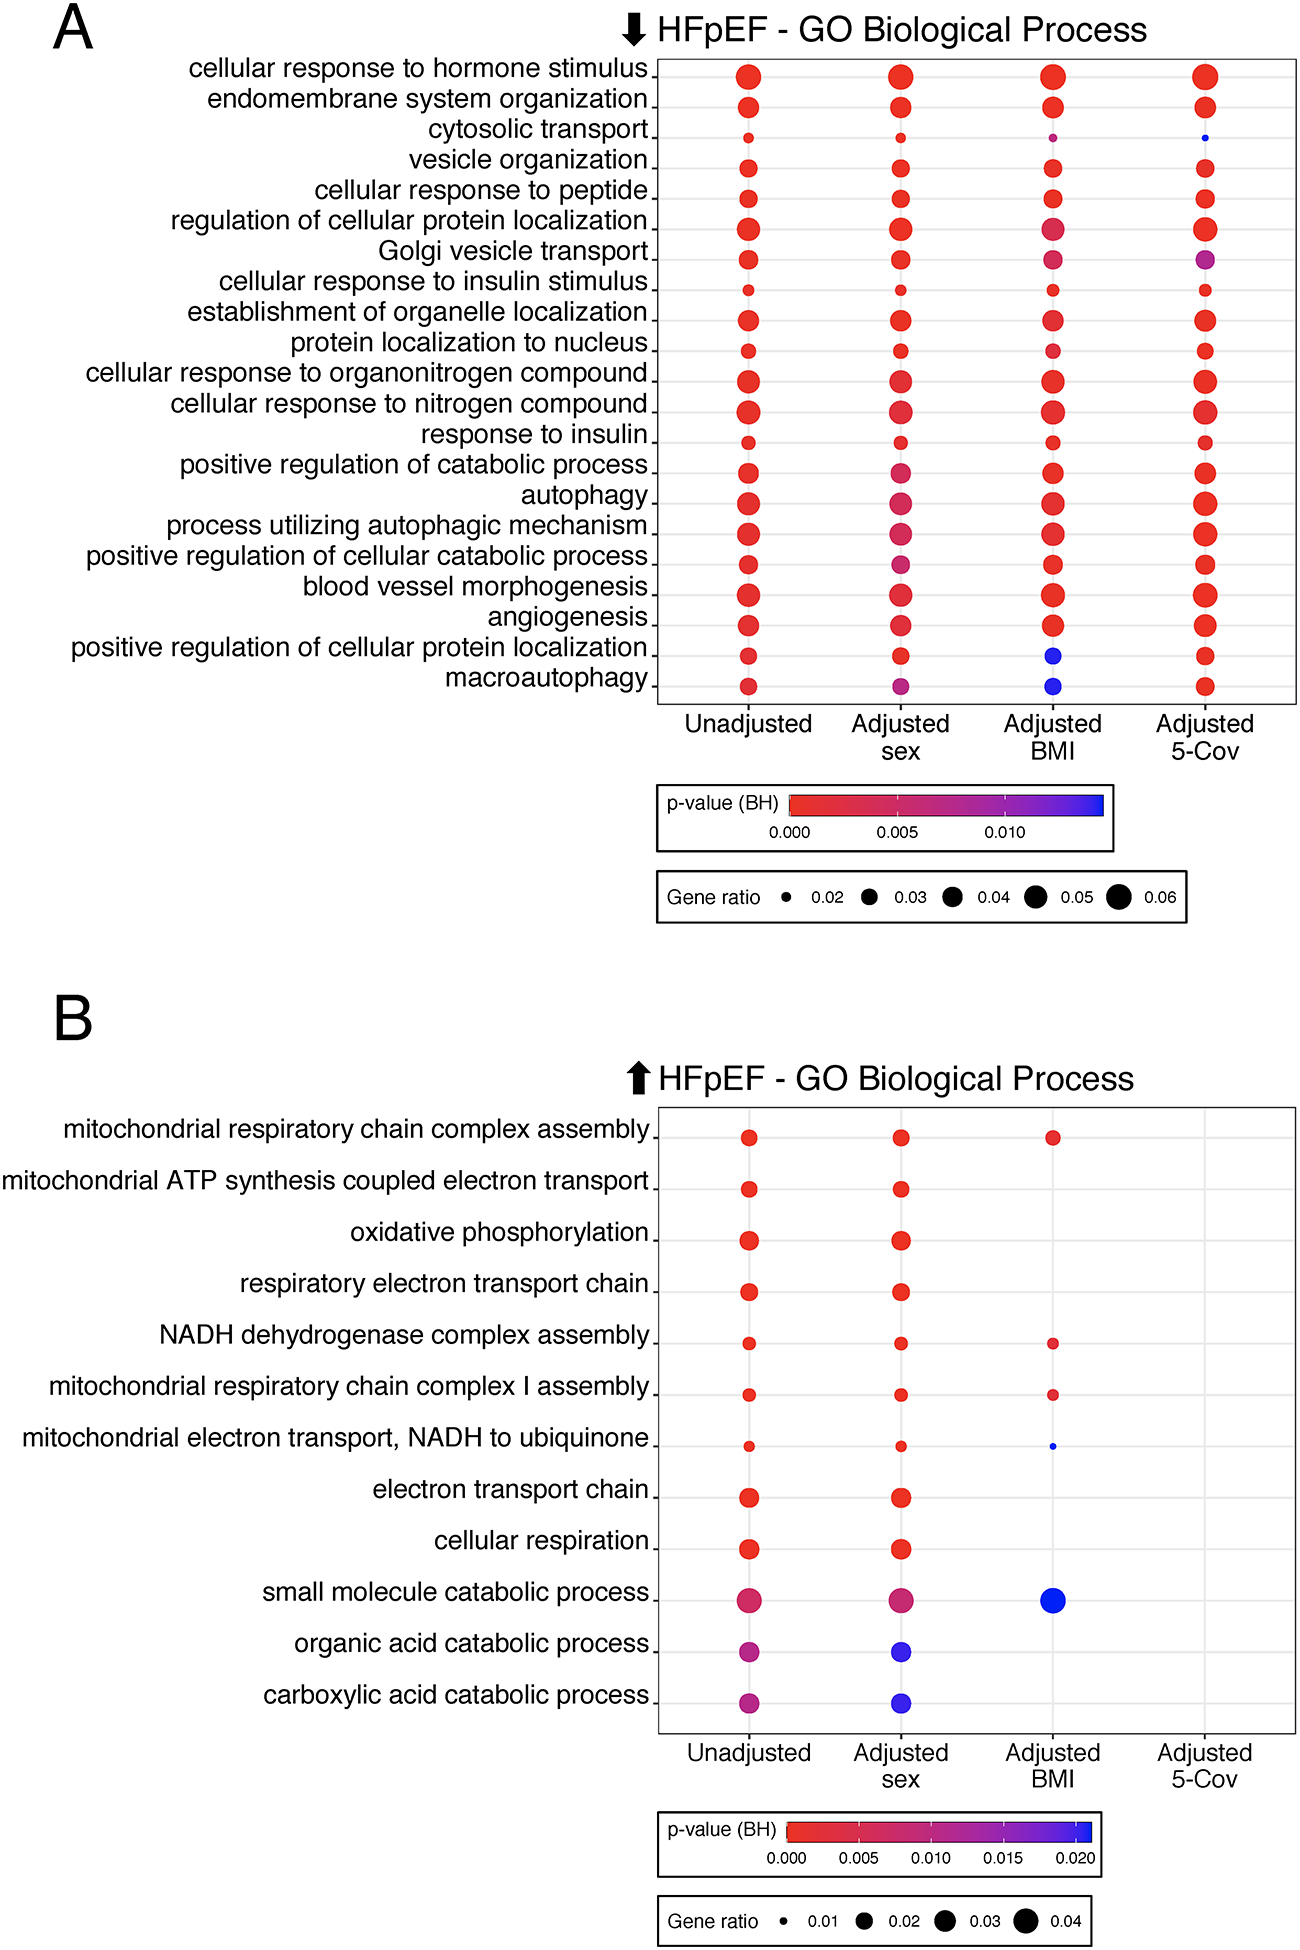
A) Enrichment of Gene Ontology (GO)-Biological Processes based on genes downregulated in HFpEF vs CON using unadjusted differential gene expression analysis, adjustment for sex or body mass index [BMI] alone, or adjustment for five clinical covariates (age, sex, diabetes, BMI, estimated glomerular filtration rate). Circle size reflects gene ratio - proportion of differentially expressed genes in a pathway versus all differentially expressed genes; color coding reflects Fisher’s exact P value after Benjamini-Hochberg (BH) adjustment for multiple comparisons. B) Same analysis using genes upregulated in HFpEF. Circle size and color coding as described in Fig. 2A.
Association of Gene Expression Clusters with HFpEF Clinical Subgroups
Heterogeneity among HFpEF raised the hypothesis that subgroups could be identified solely from their transcriptome that in turn would map to distinctive clinical phenotypes. We tested this using two methods. The first was non-negative matrix factorization (NMF) which identified three HFpEF subgroups based on maximal between patient expression correlations. Groups 1 (n=11) and 2 (n=10) were the most internally correlated, whereas Group 3 (n=18) was more heterogeneous (Figure 4A). PCA (using all genes) found Group 1 closest to HFrEF (Figure 4B, Figure VII in the Supplement), and the gene pathways enriched in Group 1 were shared with HFrEF patients (Figure 4C). Immune pathways dominated Group 2, while inflammatory and extracellular matrix processes characterized Group 3 (Figure 4C, Figure VIII in the Supplement). Table 2 and Table II in the Supplement provide clinical features of the 3 groups. Group 1 was predominantly male, nearly all diabetic, had relatively lower BMI, and higher NT-proBNP, LV dimensions, and pulmonary vascular load. Group 2 was all female, had the highest BMI, smallest LV size, lowest NT-proBNP, but higher CD68+ inflammatory cells. Time-to-first-event Kaplan-Meier analysis for the first 12 months showed Group 1 with the highest risk of death or HF hospitalization (p=0.025, Figure 4D).
Figure 4. Identification of HFpEF subgroups by agnostic clustering of gene expression.
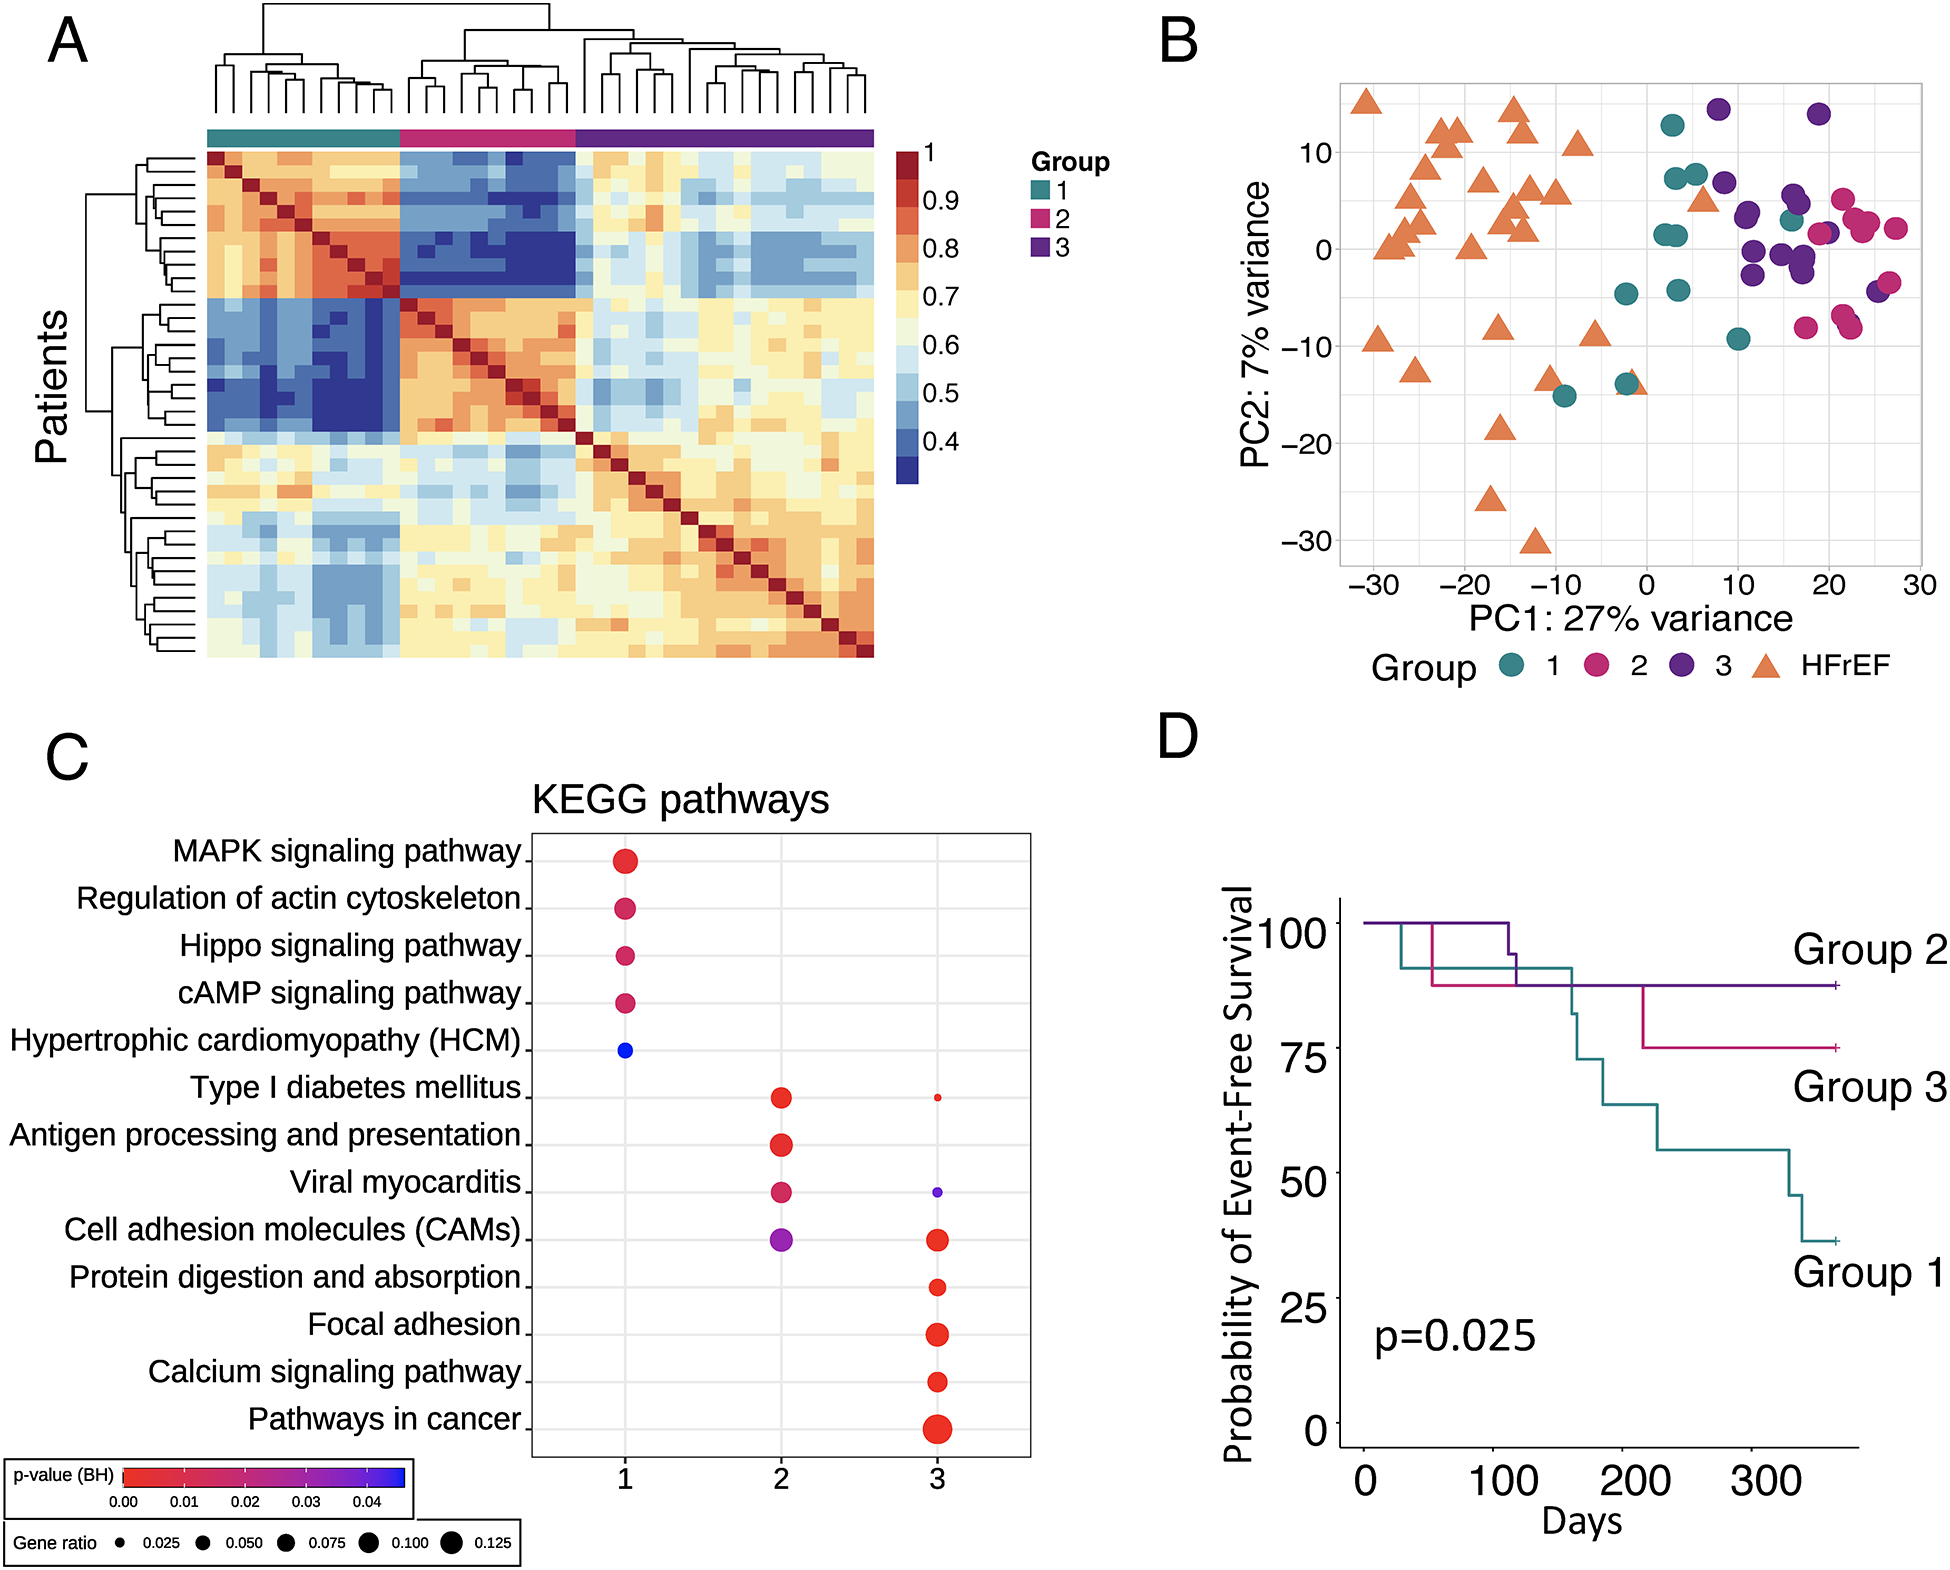
A) Non-negative matrix factorization (NMF) identifies 3 HFpEF patient clusters (n=38). Two groups show high intra-group similarity, while the third is heterogeneous. B) Principal component (PC) analysis using HFpEF groups and HFrEF as comparator. C) Enrichment of Kyoto Encyclopedia of Genes and Genomes (KEGG) pathways in the subset of differentially expressed genes within HFpEF subgroups. Symbol size and color are as defined in Fig. 2A. D) Kaplan-Meier analysis of 12-month probability of event-free survival, with event being a composite of death or heart failure hospitalization. Log-rank p-value displayed.
Table 2.
Clinical characteristics of three HFpEF groups derived by Non-negative Matrix Factorization
| Group 1 (11) | Group 2 (10) | Group 3 (17) | P value | |
|---|---|---|---|---|
| Age, years | 62 (53, 72) | 64 (44, 68) | 61 (56, 67) | 0.77 |
| Female, n (%) | 4 (36%)** | 10 (100%)††† | 7 (41%) | 0.002 |
| HF hospitalization past 12mos, n (%) | 9 (82%) | 6 (60%) | 12 (71%) | 0.53 |
| NYHA Class | 0.079 | |||
| II, n (%) | 3 (27%) | 1 (10%) | 9 (53%) | |
| III, n (%) | 8 (73%) | 8 (80%) | 8 (47%) | |
| IV, n (%) | 0 (0%) | 1 (10%) | 0 (0%) | |
| Past Medical History | ||||
| Hypertension, n (%) | 11 (100%) | 9 (90%) | 17 (100%) | 0.26 |
| Diabetes, n (%) | 10 (91%)† | 6 (60%) | 9 (53%) | 0.1 |
| CAD, n (%) | 0 (0%) | 2 (20%) | 2 (12%) | 0.26 |
| Atrial Fib/Flutter, n (%) | 4 (36%) | 0 (0%) | 6 (35%) | 0.083 |
| Systolic BP, mmHg | 141 (138, 173) | 136 (125, 161) | 136 (124, 147) | 0.31 |
| Diastolic BP, mmHg | 68 (65, 80) | 74 (61, 82) | 75 (66, 79) | 0.97 |
| BMI, kg/m2 | 37 (33, 46) | 43 (41, 48) | 41 (36, 46) | 0.26 |
| eGFR, mL/min/1.73m2 | 38 (30, 68) | 51 (44, 96) | 49 (33, 70) | 0.32 |
| BUN, mg/dL | 38 (22, 52)* | 18 (15, 24) | 22 (17, 29) | 0.043 |
| Creatinine, mg/dL | 1.90 (1.20, 2.15)* | 1.25 (0.85, 1.30) | 1.40 (1.10, 2.30) | 0.09 |
| NTproBNP, pg/mL | 1505 (418, 3279)***,† | 48 (28, 92)†† | 169 (113, 591) | <0.001 |
| Echocardiography | ||||
| LVEF, % | 60 (55, 65) | 65 (61, 69) | 65 (65, 70) | 0.19 |
| LVEDD, cm | 4.8 (4.2, 5.7)* | 4.0 (3.7, 4.3)†† | 4.9 (4.2, 5.1) | 0.005 |
| LA Diameter, cm | 4.4 (3.8, 5.0) | 3.8 (3.3, 4.2)† | 4.3 (3.8, 4.7) | 0.075 |
| Sex-adjusted LV mass/height1.7, g/m1.7 | 114 (95, 151) | 98 (69, 123) | 98 (83, 116) | 0.21 |
| LV mass index, g/m2 | 121 (109, 134)**,† | 74 (55, 93) | 93 (85, 113) | 0.005 |
| Invasive Hemodynamics | ||||
| RAP, mmHg | 13 (8, 16) | 11 (8, 15) | 12 (9, 14) | 0.91 |
| PASP, mmHg | 54 (50, 67)*,†† | 41 (32, 49) | 43 (33, 48) | 0.006 |
| PAmean, mmHg | 34 (29, 38)† | 29 (22, 35) | 28 (23, 32) | 0.074 |
| PAWP, mmHg | 21 (16, 26) | 19 (13, 24) | 20 (16, 22) | 0.73 |
| CI, L/min/m2 | 3.00 (2.20, 3.48) | 2.51 (2.27, 3.02) | 2.49 (2.40, 2.64) | 0.75 |
| PVR, wu | 2.73 (1.57, 3.45) | 1.48 (1.25, 2.27) | 1.58 (0.89, 2.09) | 0.11 |
| PVR ≥ 3wu, n (%) | 4 (36%) | 0 (0%) | 1 (5.9%) | 0.031 |
| RVSWI, gm/m2/beat | 9.7 (9.1, 11.9)* | 7.6 (5.5, 8.9) | 7.0 (5.7, 9.5) | 0.043 |
| Trans-pulmonary gradient, mmHg | 12.0 (11.5, 20.0)*,† | 8.0 (7.2, 11.0) | 8.0 (7.0, 11.0) | 0.023 |
| PA compliance, mL/mmHg | 2.4 (1.8, 3.9)*,† | 3.9 (3.6, 4.4) | 4.3 (3.0, 5.0) | 0.048 |
| Clinical Histology | ||||
| % Fibrosis | 7.2 (5.7, 7.6) | 5.0 (3.4, 10.1) | 8.0 (7.1, 11.1) | 0.29 |
| CD68 cells/mm2 | 40 (29, 55)* | 80 (51, 99) | 61 (38, 107) | 0.094 |
Data presented as n (%) or median (25th-75th percentile). Fisher’s exact test used for categorical variables. Kruskal-Wallis test used for continuous variables.
p<0.05 vs Group 2,
p≤0.01 vs Group 2,
p≤0.001 vs Group 2.
p<0.05 vs Group 3,
p≤0.01 vs Group 3,
p≤0.001 vs Group 3.
HF, heart failure; NYHA, New York Heart Association; ACEi, angiotensin converting enzyme inhibitor; ARB, angiotensin II receptor blocker; ALDO, aldosterone; CCB, calcium channel blocker; BUN, blood urea nitrogen; RVSWI, right ventricular stroke work index. All other abbreviations are as in Table 1.
The finding that Group 2 contained only females raised the question of whether sex-related differences dominated the transcriptome clustering. We tested this in two ways. First NMF analysis was repeated after removing all genes differentially expressed between HFpEF-men and HFpEF-women. There were only 96 such genes including 26 on the X-chromosome and removing them yielded essentially the same NMF result (Figure IX-A in the Supplement). The second method adjusted for sex in the gene primary reads prior to NMF processing (Figure IX-B in the Supplement). This also yielded 3 groups each fully balanced by sex, but their characteristics remained similar to the un-adjusted groups (Table III in the Supplement).
While NMF identified groups based on optimized gene clusters, we could post hoc take each group and examine their differentially expressed genes versus CON, focusing on those that are not shared by all three groups. The results (Figure X, XI in the Supplement) show oxidative phosphorylation and metabolic processes were similarly upregulated in Groups 2 and 3 but not Group 1. Immune response pathways were notably downregulated in Group 1 but neither other group, while autophagy, unfolded protein response, cell growth, and multiple RNA-processing pathways were downregulated in Groups 2 and 3 but not Group 1. Thus, while the total HFpEF group exhibited all three combined behaviors, this analysis identifies the subsets where these primarily reside.
Lastly, we employed WGCNA as an alternative method to match transcriptomic groupings with clinical correlates (Figure 5A). These clusters also exhibited morphisms with those identified by NMF (Figure 5B, 5C, Table IV in the Supplement). NMF Group 1 shared many genes with the WGCNA blue cluster that enriched for sarcomere organization and stress-activated kinase signaling pathways and correlated with LV hypertrophy, serum NT-proBNP and RV afterload. NMF Group 2 shared genes in both yellow and red WGCNA clusters in oxidative phosphorylation, immune-inflammatory signaling, and ER stress, and patients had the opposite clinical features compared to Group 1. Finally, NMF Group 3 matched the brown cluster prominently enriched for extracellular matrix and angiogenesis pathways in patients with smaller, less hypertrophied hearts, less DM, but worse HF symptoms.
Figure 5. Weighted gene correlation network analysis (WGCNA) in HFpEF.
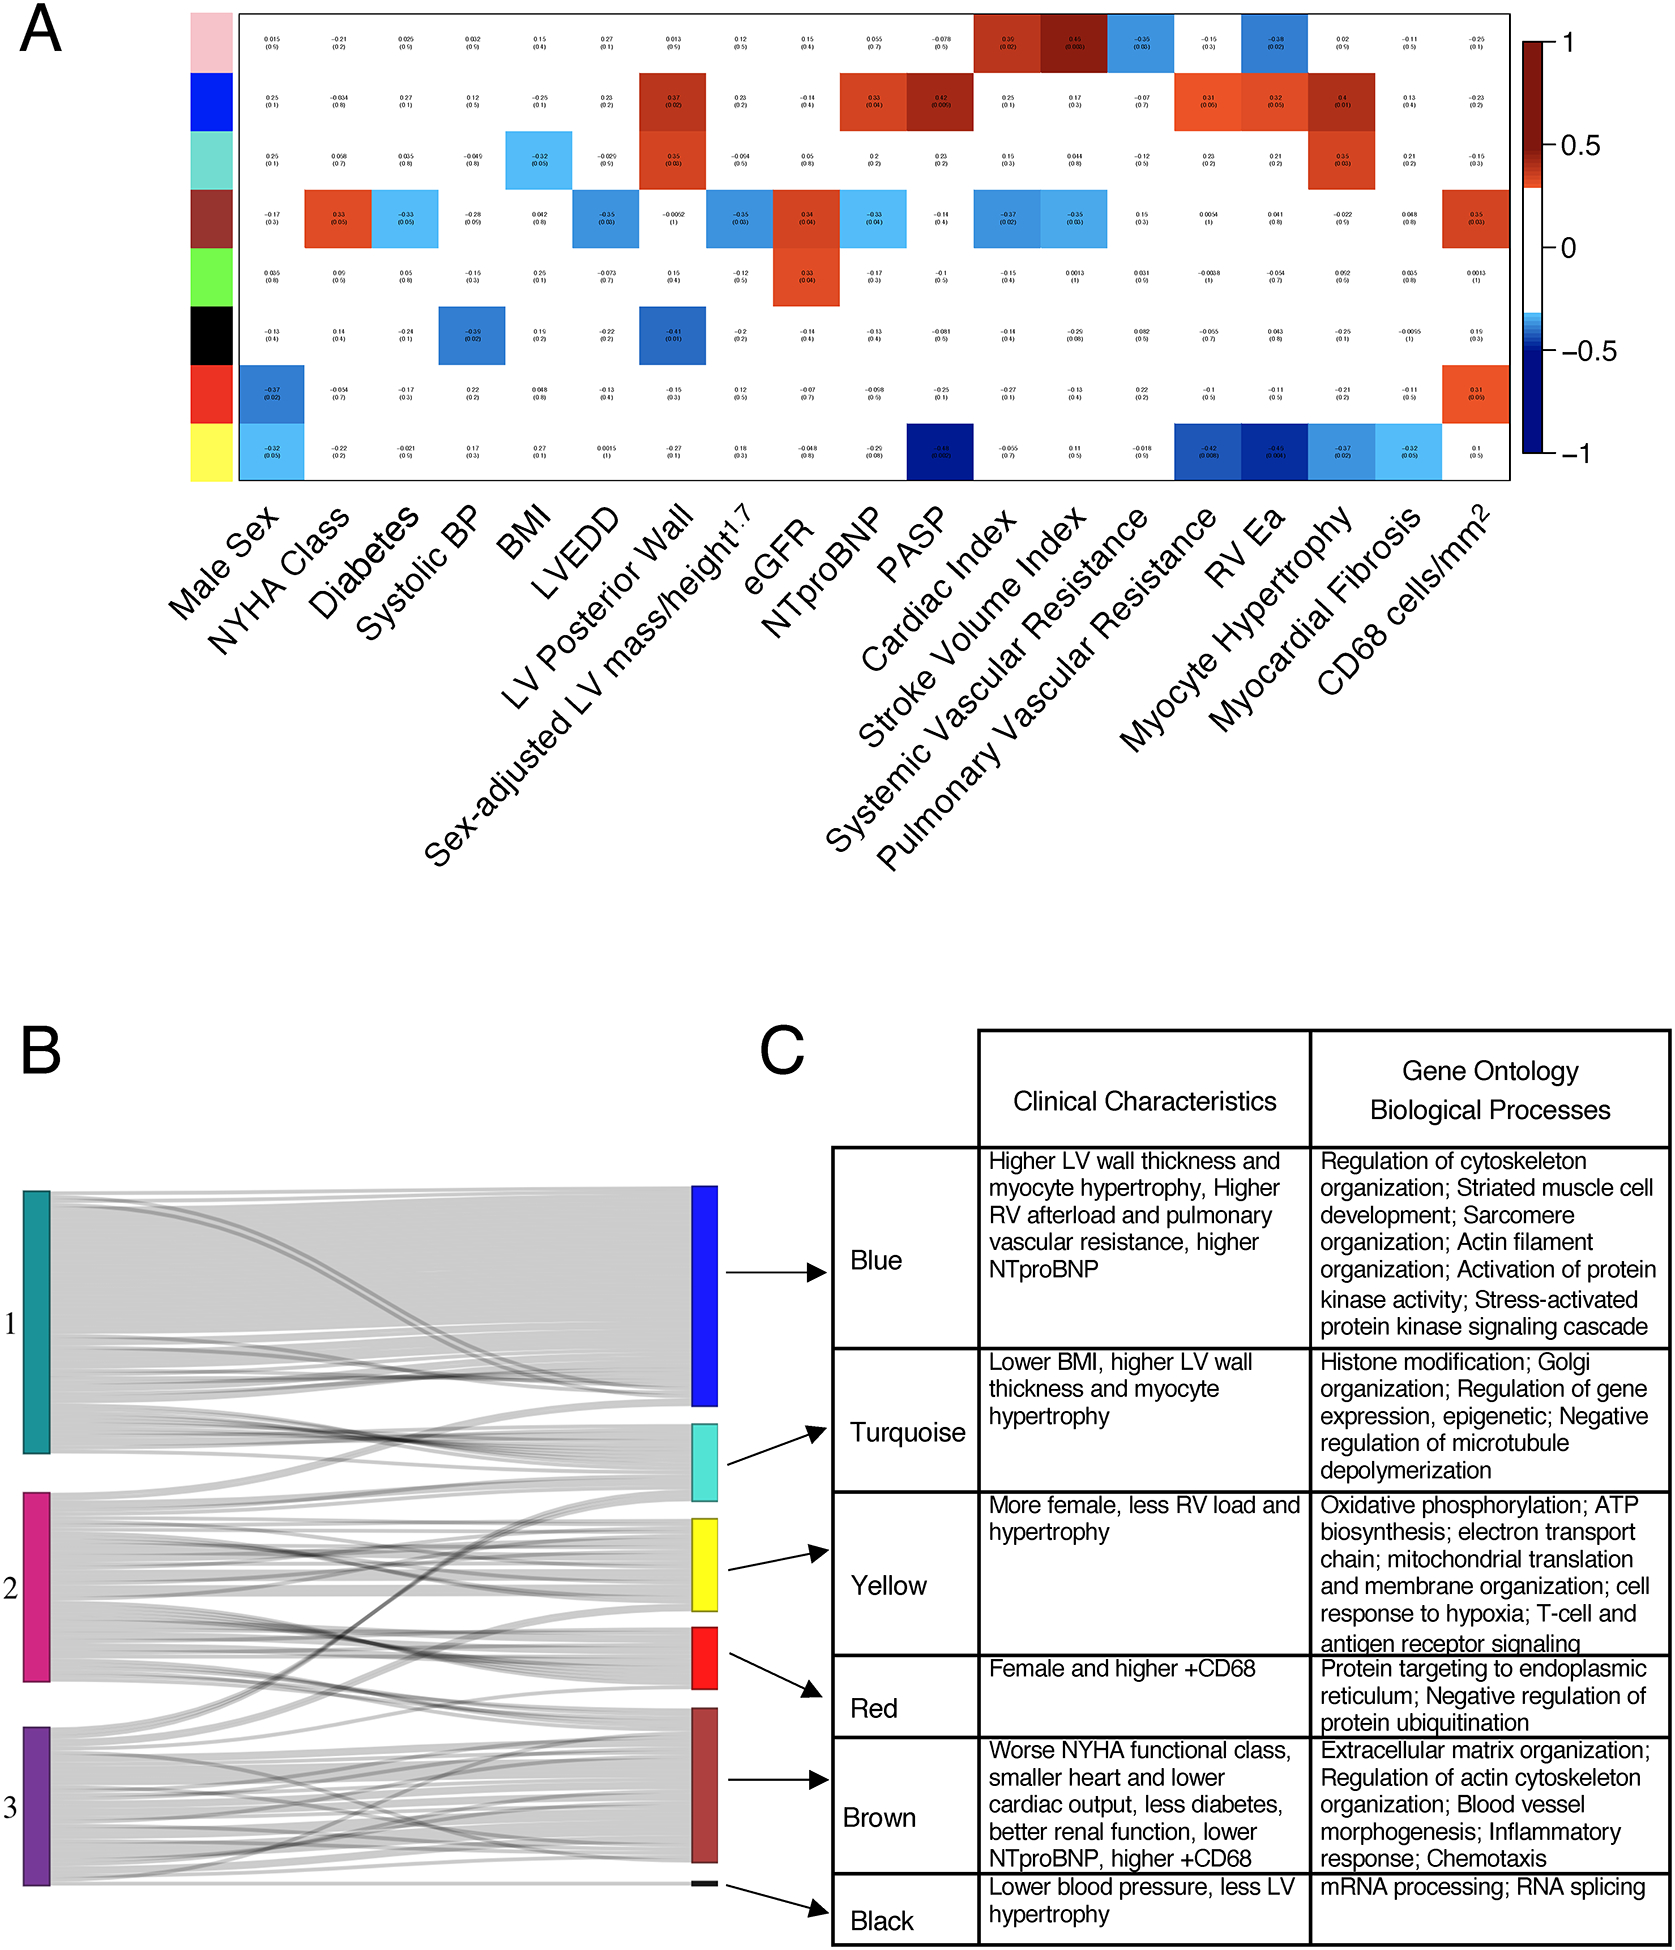
A) WGCNA identified 8 gene clusters, represented as colors on the y-axis. Their correlation with clinical parameters is shown as red boxes indicating positive and blue boxes negative correlations. B) The top 300 metagenes inherent to NMF Group 1 HFpEF overlap significantly with the “blue” cluster from the WGCNA. Each line represents a gene in an NMF group that best defined that group and its match among the gene clusters identified by WGCNA. Genes from HFpEF Group 1 overlap most with the blue cluster, while genes from Group 2 mostly overlap with the yellow and red clusters, and Group 3 mostly overlaps with the brown cluster. C) Table identifies the clinical characteristics and gene ontology biological processes related to each group. Abbreviations: BP – blood pressure; BMI – body mass index, LVEDD, left ventricular end diastolic diameter; eGFR, estimated glomerular filtration rate; PASP, pulmonary artery systolic pressure; RV, RV Ea, Right ventricle arterial elastance.
Discussion
In this first broad analysis of gene expression in myocardium from prospectively identified human HFpEF patients, we reveal several important findings. First, HFpEF has a distinct transcriptome versus controls and exhibits many unique pathway modifications compared to HFrEF. Second, altered gene expression in pathways often postulated as central to HFpEF pathogenesis including fibrosis, hypertrophy, oxidant stress and inflammation29 are similar or less augmented compared to HFrEF; whereas more unique pathways in HFpEF relate to protein hemostasis, ER stress, and angiogenesis. Third, HFpEF can be sub-grouped based solely on transcriptomics, yielding: 1) a hemodynamic-driven phenotype that shares similarities to HFrEF and has worse clinical outcomes; 2) a cohort with smaller hearts and inflammatory and matrix signatures; and 3) a heterogeneous phenotype with worse HF symptoms but lower NT-proBNP and smaller hearts as well. This remains distinctive from HFrEF. These relations between underlying transcriptomic signatures and their clinical correlates suggests a path forward for more personalized and biologically based therapeutics.
HFpEF displays broad transcriptomic changes despite clinical heterogeneity
Initial reports of HFpEF in the 1980’s (termed diastolic heart failure at the time) described mostly elderly, hypertensive, and predominantly female patients with hypertrophied ventricles without obvious coronary disease4. This remained a primary phenotype over the ensuing 20 years, with hypertension, hypertrophy, fibrosis, and resulting diastolic impairment considered the primary disease pathophysiology. However, the phenotype has changed over the past two decades to involve a younger, mixed-sex population, characterized by severe obesity and metabolic comorbidities.6, 8 This evolution has shifted the mechanistic perspective to a multi-organ disease9 that includes pulmonary hypertension, obesity and metabolic disease, vascular stiffening, chronotropic incompetence, skeletal muscle disease, and renal insufficiency30. In this context, the role of the heart has become more ambiguous, and while suspicions persist that the myocardium is not normal, just how is less certain. This heterogeneity has been blamed for clinical failures of therapeutic trials31.
In this context, a coherent HFpEF transcriptomic profile despite clinical hetero-geneity is intriguing and reveals shared myocardial signaling distinctive from CON or HFrEF. The variance in individual gene expression among HFpEF patients was relatively modest and similar to that in HFrEF and CON, even as the latter are often considered less clinically heterogeneous. Given the larger size of our HFpEF cohort, we were able for the first time to further dissect out myocardial molecular subgroups. We know of only one prior report of myocardial transcriptomics from 16 patients undergoing coronary bypass surgery, 5 of which having HFpEF-features32. None of the five were prospectively identified with clinical HF and only one was treated with a diuretic (none a loop diuretic) limiting interpretability of the data. By contrast, the current results are derived from a well-characterized cohort of symptomatic HFpEF patients under active medical management.
HFpEF transcriptomic signatures and the role of co-morbidities
Prior studies have proposed various pathophysiological components thought to underlie HFpEF, including myocyte hypertrophy, interstitial fibrosis, oxidative stress, and abnormal NO signaling29. While we found these pathways more engaged in HFpEF compared to controls, similar if not greater changes were found in HFrEF, and are thus not unique to HFpEF. By contrast, several pathways dysregulated in HFpEF versus CON differed from those observed in late-stage HFrEF. The upregulation of genes in oxidative phosphorylation/ATP synthesis pathways is intriguing given that they are downregulated in HFrEF and this pathway enrichment is linked with differences in BMI between HFpEF and CON. Obesity engages a complex pathophysiology involving adipokines, vascular dysfunction, inflammatory signaling, metabolic fuel utilization defects, and many other features that contribute to cardiometabolic syndromes33, 34. It is certainly possible that upregulated energy-related genes in more obese HFpEF patients relate to this pathobiology, but it could also reflect higher energy requirements to perfuse more tissue (fat) than the heart was designed for and to handle the increased workload due to higher inertance to movement. This may need to be dissected using cardiometabolic pre-clinical models as myocardial tissue from non-failing obese patients will be difficult to obtain.
Equally interesting is the set of genes uniquely downregulated in HFpEF that could not be accounted for by BMI or other major co-morbidities. These genes involve protein homeostasis, trafficking, angiogenesis, ER processing and stress, and protein recycling. They were consistently identified using different bio-informatics methods, including GO, KEGG, NMF, and WGCNA. The presence of depressed ER processing genes is notable in light of data from a carefully phenotyped mouse HFpEF model combining hemodynamic and metabolic stress that found the pathway is depressed and biologically relevant35. Confirmation of its functional relevance in larger mammals and particular humans with HFpEF awaits future studies. It is important to recognize that gene expression does not imply functional effects or necessarily correlate with protein levels, but it puts a spotlight on pathways likely to be engaged. Further studies are needed to test various candidates as therapeutic targets.
Identifying HFpEF subgroups by the transcriptome
Many recent studies have employed a broad array of clinical data including serum biomarkers to phenotype HFpEF subgroups by artificial intelligence/machine learning and cluster-mapping approaches31, 36, 37. These find HFpEF patients at highest risk generally have right heart dysfunction, hemodynamic overload, higher NT-proBNP, and often renal dysfunction31, 36, 37. Whether or how these groups map to molecular signatures was previously unknown, but the new data suggest they are. A limiting factor is that HFpEF patients often present with many overlapping features, making it difficult to assign them to pre-designated clinical subgroups. Here, we took the opposite approach, using only the transcriptome to develop sub-group clusters, then mapping the clusters back to clinical features and biological pathways. Despite the inherent mathematical differences in NMF and WGCNA analyses, we found remarkable concordance between NMF-Group 1, an agnostically identified high-risk subgroup that shares features of the high-risk cohorts in prior clinical-phenomapping studies31, 36, 37, and the WGCNA blue module, suggesting biological relevance. Interestingly, the transcriptome of this subgroup is also closest to HFrEF, suggesting therapies for the latter may benefit this HFpEF subgroup. By contrast, therapies targeting protein-processing, metabolism, inflammation, or matrix remodeling may more benefit NMF Groups 2 or 3; obesity-reduction would likely help all groups.
Limitations
Our study has several limitations. The results do not test a specific mechanism for HFpEF, but rather provide a framework for biological exploration of the syndrome. We used whole myocardial rather than single cell RNAseq, as the latter has yet to be established from heart biopsies; thus, cell-specific expression remains to be clarified. The HFrEF patients had late-stage disease and were being transplanted, and while this may reflect more severe disease than the HFpEF cohort, the latter group had well documented hemodynamics, functional class, HF hospitalization rates, and disability representing a high morbidity clinical phenotype. Furthermore, the vast majority of molecular and cellular data for human HF derives from tissue procured in advanced HFrEF in the same manner. The CON tissue from brain-dead organ donors may be impacted by the conditions surrounding death; however, the within-group transcriptomes were very consistent. We were limited to the unused donor and HFrEF explant tissue available and were not able to match patients based on demographics and comorbidities. Finally, the myocardial tissue in HFpEF is from the RV septum, the standard sampling location for endomyocardial biopsy, and while we cannot be certain gene expression is identical in the LV in HFpEF, we found very strong transcriptomic agreement between tissue from the LV and RV in HFrEF patients that was unaltered by RV load from pulmonary hypertension.
Conclusion
HFpEF myocardium displays characteristic transcriptional signatures, distinct from CON and HFrEF. Some of these transcriptome signatures are closely linked to obesity and other co-morbidities, while others are not. Lastly, we find molecular subgroups within HFpEF have corresponding distinctive clinical profiles. Together, these results provide new biological insights into HFpEF, and help forge a framework to better develop precision-guided therapeutics.
Supplementary Material
Clinical Perspective.
What is new?
We performed myocardial transcriptomic analysis in heart failure with preserved ejection fraction (HFpEF), HF with reduced EF (HFrEF), and controls.
Upregulated genes in oxidative phosphorylation pathways in HFpEF were associated with obesity, whereas downregulated genes in endoplasmic reticulum stress, autophagy, and angiogenesis were independent of co-morbidities.
We identified a subgroup of HFpEF with a transcriptomic signature more similar to HFrEF. This group had larger hearts, worse pulmonary hypertension, higher NTproBNP, and worse clinical outcomes.
What are the clinical implications?
Transcriptome-derived HFpEF subgroups including one more similar to HFrEF may benefit from proven HFrEF therapies and others that may benefit from targeted therapies addressing inflammation, proteostasis, and angiogenesis.
Sources of Funding
The NextGen RNA sequencing was supported by a research grant from Amgen, Inc. DAK was supported by AHA 16SFRN28620000 and NHLBI R35:HL135827; KS by AHA: 16SFRN27870000, NHLBI R01:HL61912, and JHU SOM Clinician Scientist Award; AC by R01HL124091 and The Mirowski Family Foundation; VSH by NIH 2T32HL007227-44; JSB and HK by NHLBI R35:HL135827; KBM by a research grant from Sanofi-Adventis. XL, SMH, MS are employees of Amgen, Inc. JY and AYK were employees of Amgen when the project started and have since left the company.
Non-standard Abbreviations and Acronyms
- HFpEF
Heart Failure with Preserved Ejection Fraction
- HF
Heart Failure
- RNA
Ribonucleic acid
- RV
Right ventricle
- EF
Ejection fraction
- HFrEF
Heart Failure with Reduced Ejection Fraction
- CON
Control
- PCA
Principal Component Analysis
- NMF
Non-negative matrix factorization
- WGNCA
Weighted gene co-expression analysis
- BMI
Body Mass Index
- NYHA
New York Heart Association
- ATP
Adenosine triphosphate
- LV
Left ventricle
- IRB
Institutional Review Board
- LVEF
Left ventricular ejection fraction
- LA
Left atrium
- NTproBNP
N-terminal pro–B-type natriuretic peptide
- PAWP
Pulmonary artery wedge pressure
- LVH
Left ventricular hypertrophy
- CD68
Cluster of Differentiation 68
- FDR
False discovery rate
- UHCA
Unsupervised hierarchical clustering analysis
- KEGG
Kyoto Encyclopedia of Genes and Genomes
- GO
Gene Ontology
- PA
Pulmonary artery
- PVR
Pulmonary vascular resistance
- eGFR
Estimated glomerular filtration rate
- cGMP
Cyclic guanine monophosphate
- NO
Nitric oxide
- ER
endoplasmic reticulum
- DM
Diabetes mellitus
Footnotes
Disclosures
VSH, HK, AM, KB, KM, JV, AC - none. XL, SMH, MS, JY, AYK are/were employees and stockholders of Amgen, Inc. JSB is a founder and director of Neochromosome. DAK is a consultant and Scientific Advisory Board Member (Cardiometabolic) for Amgen. SMH is an executive, officer, and shareholder of Amgen and is a scientific founder and shareholder of Tenaya Therapeutics. AYK is a full-time employee of Calico Life Sciences, LLC. KS is a consultant and advisory board member for Novartis, Janssen, Bayer and Cytokinetics, and receives honoraria.
Supplemental Materials
Supplemental Figures I-XI
Supplemental Tables I – IV
References
- 1.Benjamin EJ, Virani SS, Callaway CW, Chamberlain AM, Chang AR, Cheng S, Chiuve SE, Cushman M, Delling FN, Deo R, et al. Heart Disease and Stroke Statistics-2018 Update: A Report From the American Heart Association. Circulation. 2018;137:e67–e492. doi: 10.1161/CIR.0000000000000558 [DOI] [PubMed] [Google Scholar]
- 2.Owan TE, Hodge DO, Herges RM, Jacobsen SJ, Roger VL and Redfield MM. Trends in prevalence and outcome of heart failure with preserved ejection fraction. N Engl J Med. 2006;355:251–259. doi: 10.1056/NEJMoa052256 [DOI] [PubMed] [Google Scholar]
- 3.Sharma K, Hill T, Grams M, Daya NR, Hays AG, Fine D, Thiemann DR, Weiss RG, Tedford RJ, Kass DA, et al. Outcomes and Worsening Renal Function in Patients Hospitalized With Heart Failure With Preserved Ejection Fraction. Am J Cardiol. 2015;116:1534–1540. doi: 10.1016/j.amjcard.2015.08.019 [DOI] [PubMed] [Google Scholar]
- 4.Topol EJ, Traill TA and Fortuin NJ. Hypertensive hypertrophic cardiomyopathy of the elderly. N Engl J Med. 1985;312:277–283. doi: 10.1056/NEJM198501313120504 [DOI] [PubMed] [Google Scholar]
- 5.Borbely A, van der Velden J, Papp Z, Bronzwaer JG, Edes I, Stienen GJ and Paulus WJ. Cardiomyocyte stiffness in diastolic heart failure. Circulation. 2005;111:774–781. doi: 10.1161/01.CIR.0000155257.33485.6D [DOI] [PubMed] [Google Scholar]
- 6.Kitzman DW and Shah SJ. The HFpEF Obesity Phenotype: The Elephant in the Room. J Am Coll Cardiol. 2016;68:200–203. doi: 10.1016/j.jacc.2016.05.019 [DOI] [PubMed] [Google Scholar]
- 7.Kitzman DW and Nicklas BJ. Pivotal Role of Excess Intra-Abdominal Adipose in the Pathogenesis of Metabolic/Obese HFpEF. JACC Heart Fail. 2018;6:1008–1010. doi: 10.1016/j.jchf.2018.08.007 [DOI] [PMC free article] [PubMed] [Google Scholar]
- 8.Obokata M, Reddy YNV, Pislaru SV, Melenovsky V and Borlaug BA. Evidence Supporting the Existence of a Distinct Obese Phenotype of Heart Failure With Preserved Ejection Fraction. Circulation. 2017;136:6–19. doi: 10.1161/circulationaha.116.026807 [DOI] [PMC free article] [PubMed] [Google Scholar]
- 9.Sharma K and Kass DA. Heart failure with preserved ejection fraction: mechanisms, clinical features, and therapies. Circ Res. 2014;115:79–96. doi: 10.1161/CIRCRESAHA.115.302922 [DOI] [PMC free article] [PubMed] [Google Scholar]
- 10.Zile MR, Baicu CF, Ikonomidis JS, Stroud RE, Nietert PJ, Bradshaw AD, Slater R, Palmer BM, Van Buren P, Meyer M, et al. Myocardial stiffness in patients with heart failure and a preserved ejection fraction: contributions of collagen and titin. Circulation. 2015;131:1247–1259. doi: 10.1161/CIRCULATIONAHA.114.013215 [DOI] [PMC free article] [PubMed] [Google Scholar]
- 11.Westermann D, Lindner D, Kasner M, Zietsch C, Savvatis K, Escher F, von Schlippenbach J, Skurk C, Steendijk P, Riad A, et al. Cardiac inflammation contributes to changes in the extracellular matrix in patients with heart failure and normal ejection fraction. Circ Heart Fail. 2011;4:44–52. doi: 10.1161/CIRCHEARTFAILURE.109.931451 [DOI] [PubMed] [Google Scholar]
- 12.van Heerebeek L, Hamdani N, Falcao-Pires I, Leite-Moreira AF, Begieneman MP, Bronzwaer JG, van der Velden J, Stienen GJ, Laarman GJ, Somsen A, et al. Low myocardial protein kinase G activity in heart failure with preserved ejection fraction. Circulation. 2012;126:830–839. doi: 10.1161/CIRCULATIONAHA.111.076075 [DOI] [PubMed] [Google Scholar]
- 13.Runte KE, Bell SP, Selby DE, Haussler TN, Ashikaga T, LeWinter MM, Palmer BM and Meyer M. Relaxation and the Role of Calcium in Isolated Contracting Myocardium From Patients With Hypertensive Heart Disease and Heart Failure With Preserved Ejection Fraction. Circ Heart Fail. 2017;10:e004311. doi: 10.1161/CIRCHEARTFAILURE.117.004311 [DOI] [PMC free article] [PubMed] [Google Scholar]
- 14.Hahn VS, Knutsdottir H, Luo X, Bedi KC Jr., Margulies KB, Haldar SM, Stolina M, Yin J, Khakoo AY, Vaishnav J, et al. Myocardial gene expression signatures in human heart failure with preserved ejection fraction. Zenodo Data Repository. 2020. doi: DOI: 10.5281/zenodo.4114617 [DOI] [PMC free article] [PubMed] [Google Scholar]
- 15.Pieske B, Tschöpe C, de Boer RA, Fraser AG, Anker SD, Donal E, Edelmann F, Fu M, Guazzi M, Lam CSP, et al. How to diagnose heart failure with preserved ejection fraction: the HFA-PEFF diagnostic algorithm: a consensus recommendation from the Heart Failure Association (HFA) of the European Society of Cardiology (ESC). Eur J Heart Fail. 2020;22:391–412. doi: 10.1002/ejhf.1741 [DOI] [PubMed] [Google Scholar]
- 16.Ponikowski P, Voors AA, Anker SD, Bueno H, Cleland JGF, Coats AJS, Falk V, González-Juanatey JR, Harjola VP, Jankowska EA, et al. 2016 ESC Guidelines for the diagnosis and treatment of acute and chronic heart failure: The Task Force for the diagnosis and treatment of acute and chronic heart failure of the European Society of Cardiology (ESC)Developed with the special contribution of the Heart Failure Association (HFA) of the ESC. Eur Heart J. 2016;37:2129–2200. doi: 10.1093/eurheartj/ehw128 [DOI] [PubMed] [Google Scholar]
- 17.Yancy CW, Jessup M, Bozkurt B, Butler J, Casey DE Jr., Drazner MH, Fonarow GC, Geraci SA, Horwich T, Januzzi JL, et al. 2013 ACCF/AHA guideline for the management of heart failure: executive summary: a report of the American College of Cardiology Foundation/American Heart Association Task Force on practice guidelines. Circulation. 2013;128:1810–1852. doi: 10.1161/CIR.0b013e31829e8807 [DOI] [PubMed] [Google Scholar]
- 18.McKee PA, Castelli WP, McNamara PM and Kannel WB. The natural history of congestive heart failure: the Framingham study. N Engl J Med. 1971;285:1441–1446. doi: 10.1056/NEJM197112232852601 [DOI] [PubMed] [Google Scholar]
- 19.Lang RM, Badano LP, Mor-Avi V, Afilalo J, Armstrong A, Ernande L, Flachskampf FA, Foster E, Goldstein SA, Kuznetsova T, et al. Recommendations for cardiac chamber quantification by echocardiography in adults: an update from the American Society of Echocardiography and the European Association of Cardiovascular Imaging. J Am Soc Echocardiogr. 2015;28:1–39 e14. doi: 10.1016/j.echo.2014.10.003 [DOI] [PubMed] [Google Scholar]
- 20.Hahn VS, Yanek LR, Vaishnav J, Ying W, Vaidya D, Lee YZJ, Riley SJ, Subramanya V, Brown EE, Hopkins CD, et al. Endomyocardial Biopsy Characterization of Heart Failure With Preserved Ejection Fraction and Prevalence of Cardiac Amyloidosis. JACC Heart Fail. 2020;8:712–724. doi: 10.1016/j.jchf.2020.04.007 [DOI] [PMC free article] [PubMed] [Google Scholar]
- 21.Kim D, Langmead B and Salzberg SL. HISAT: a fast spliced aligner with low memory requirements. Nat Methods. 2015;12:357–360. doi: 10.1038/nmeth.3317 [DOI] [PMC free article] [PubMed] [Google Scholar]
- 22.Anders S, Pyl PT and Huber W. HTSeq--a Python framework to work with high-throughput sequencing data. Bioinformatics. 2015;31:166–169. doi: 10.1093/bioinformatics/btu638 [DOI] [PMC free article] [PubMed] [Google Scholar]
- 23.Love MI, Huber W and Anders S. Moderated estimation of fold change and dispersion for RNA-seq data with DESeq2. Genome Biol. 2014;15:550. doi: 10.1186/s13059-014-0550-8 [DOI] [PMC free article] [PubMed] [Google Scholar]
- 24.Langfelder P and Horvath S. WGCNA: an R package for weighted correlation network analysis. BMC Bioinformatics. 2008;9:559. doi: 10.1186/1471-2105-9-559 [DOI] [PMC free article] [PubMed] [Google Scholar]
- 25.Gaujoux R and Seoighe C. A flexible R package for nonnegative matrix factorization. BMC Bioinformatics. 2010;11:367. doi: 10.1186/1471-2105-11-367 [DOI] [PMC free article] [PubMed] [Google Scholar]
- 26.Brunet JP, Tamayo P, Golub TR and Mesirov JP. Metagenes and molecular pattern discovery using matrix factorization. Proc Natl Acad Sci U S A. 2004;101:4164–4169. doi: 10.1073/pnas.0308531101 [DOI] [PMC free article] [PubMed] [Google Scholar]
- 27.Johnson EK, Matkovich SJ and Nerbonne JM. Regional Differences in mRNA and lncRNA Expression Profiles in Non-Failing Human Atria and Ventricles. Sci Rep. 2018;8:13919. doi: 10.1038/s41598-018-32154-2 [DOI] [PMC free article] [PubMed] [Google Scholar]
- 28.Paulus WJ. Unfolding Discoveries in Heart Failure. N Engl J Med. 2020;382:679–682. doi: 10.1056/NEJMcibr1913825 [DOI] [PubMed] [Google Scholar]
- 29.Paulus WJ and Tschope C. A novel paradigm for heart failure with preserved ejection fraction: comorbidities drive myocardial dysfunction and remodeling through coronary microvascular endothelial inflammation. J Am Coll Cardiol. 2013;62:263–271. doi: 10.1016/j.jacc.2013.02.092 [DOI] [PubMed] [Google Scholar]
- 30.Shah SJ, Borlaug BA, Kitzman DW, McCulloch AD, Blaxall BC, Agarwal R, Chirinos JA, Collins S, Deo RC, Gladwin MT, et al. Research Priorities for Heart Failure With Preserved Ejection Fraction: National Heart, Lung, and Blood Institute Working Group Summary. Circulation. 2020;141:1001–1026. doi: 10.1161/CIRCULATIONAHA.119.041886 [DOI] [PMC free article] [PubMed] [Google Scholar]
- 31.Shah SJ, Katz DH, Selvaraj S, Burke MA, Yancy CW, Gheorghiade M, Bonow RO, Huang CC and Deo RC. Phenomapping for novel classification of heart failure with preserved ejection fraction. Circulation. 2015;131:269–279. doi: 10.1161/circulationaha.114.010637 [DOI] [PMC free article] [PubMed] [Google Scholar]
- 32.Das S, Frisk C, Eriksson MJ, Walentinsson A, Corbascio M, Hage C, Kumar C, Asp M, Lundeberg J, Maret E, et al. Transcriptomics of cardiac biopsies reveals differences in patients with or without diagnostic parameters for heart failure with preserved ejection fraction. Sci Rep. 2019;9:3179. doi: 10.1038/s41598-019-39445-2 [DOI] [PMC free article] [PubMed] [Google Scholar]
- 33.Collins S A heart-adipose tissue connection in the regulation of energy metabolism. Nat Rev Endocrinol. 2014;10:157–163. doi: 10.1038/nrendo.2013.234 [DOI] [PubMed] [Google Scholar]
- 34.Koliaki C, Liatis S and Kokkinos A. Obesity and cardiovascular disease: revisiting an old relationship. Metabolism. 2019;92:98–107. doi: 10.1016/j.metabol.2018.10.011 [DOI] [PubMed] [Google Scholar]
- 35.Schiattarella GG, Altamirano F, Tong D, French KM, Villalobos E, Kim SY, Luo X, Jiang N, May HI, Wang ZV, et al. Nitrosative stress drives heart failure with preserved ejection fraction. Nature. 2019;568:351–356. doi: 10.1038/s41586-019-1100-z [DOI] [PMC free article] [PubMed] [Google Scholar]
- 36.Cohen JB, Schrauben SJ, Zhao L, Basso MD, Cvijic ME, Li Z, Yarde M, Wang Z, Bhattacharya PT, Chirinos DA, et al. Clinical Phenogroups in Heart Failure With Preserved Ejection Fraction: Detailed Phenotypes, Prognosis, and Response to Spironolactone. JACC Heart Fail. 2020;8:172–184. doi: 10.1016/j.jchf.2019.09.009 [DOI] [PMC free article] [PubMed] [Google Scholar]
- 37.Segar MW, Patel KV, Ayers C, Basit M, Tang WHW, Willett D, Berry J, Grodin JL and Pandey A. Phenomapping of patients with heart failure with preserved ejection fraction using machine learning-based unsupervised cluster analysis. Eur J Heart Fail. 2020;22:148–158. doi: 10.1002/ejhf.1621 [DOI] [PubMed] [Google Scholar]
Associated Data
This section collects any data citations, data availability statements, or supplementary materials included in this article.