

Abstract
Introduction:
Alterations of white matter integrity and subsequent white matter structural deficits are consistent findings in Fetal Alcohol Syndrome (FAS), but knowledge regarding the molecular mechanisms underlying these abnormalities is incomplete. Experimental rodent models of FAS have shown dysregulation of cytokine expression leading to apoptosis of oligodendrocyte precursor cells (OPCs) and altered oligodendrocyte (OL) differentiation, but whether this is representative of human FAS pathogenesis has not been determined.
Methods:
Fetal brain tissue (12.2-21.4 weeks gestation) from subjects undergoing elective termination of pregnancy was collected according to an IRB-approved protocol. Ethanol (EtOH) exposure status was classified based on a detailed face-to-face questionnaire adapted from the National Institute on Alcohol Abuse and Alcoholism Prenatal Alcohol and Sudden Infant Death Syndrome and Stillbirth (PASS) study. Twenty EtOH-exposed fetuses were compared with 20 gestational age matched controls. Cytokine and OPC marker mRNA expression was quantified by Real-Time Polymerase chain reaction (qRT-PCR). Patterns of protein expression of OPC markers and active Capase-3 were studied by Fluorescence Activated Cell Sorting (FACS).
Results:
EtOH exposure was associated with reduced markers of cell viability, OPC differentiation, and OL maturation, while early OL differentiation markers were unchanged or increased. Expression of mRNAs for proteins specific to more mature forms of OL lineage (platelet-derived growth factor α (PDGFRα) and myelin basic protein (MBP) was lower in the EtOH group than in controls. Expression of the multifunctional growth and differentiation-promoting growth factor IGF-1, which is essential for normal development, also was reduced. Reductions were not observed for markers of early stages of OL differentiation, including Nuclear transcription factor NK-2 homeobox locus 2 (Nkx2.2). Expression of mRNAs for the proinflammatory cytokine, tumor necrosis factor-α (TNFα), and several proinflammatory chemokines was higher in the EtOH group compared to controls, including: Growth regulated protein alpha/chemokine (C-X-C motif) ligand 1 (GRO-α/CXCL1), Interleukin 8/chemokine (C-X-C motif) ligand 8 (IL8/CXCL8), Chemokine (C-X-C motif) ligand 6/Granulocyte chemotactic protein 2 (CXCL16/GCP2), epithelial-derived neutrophil-activating protein 78/chemokine (C-X-C motif) ligand 5 (ENA-78/CXCL5), monocyte chemoattractant protein-1 (MCP-1). EtOH exposure also was associated with an increase in the proportion of cells expressing markers of early stage OPCs, such as A2B5 and NG2. Finally, apoptosis (measured by caspase-3 activation) was increased substantially in the EtOH group compared to controls.
Conclusion:
Prenatal EtOH exposure is associated with excessive OL apoptosis and/or delayed OL maturation in human fetal brain. This is accompanied by markedly dysregulated expression of several chemokines and cytokines, in a pattern predictive of increased OL cytotoxicity and reduced OL differentiation. These findings are consistent with findings in animal models of FAS.
Keywords: Alcohol, FAS, Fetal Brain, Oligodendrocytes, Neuronal Injury
1. Introduction
Fetal exposure to ethanol (EtOH) during pregnancy is the leading cause of preventable cognitive impairment (Mutch 2016, Ornoy 2010, MMWR, 2012). Past estimates of the prevalence of fetal alcohol syndrome (FAS) in the US general population ranged from 0.2 to 7 per 1000 children, but newer research suggests that 3.1% to 9.9% of children have a fetal alcohol spectrum disorder (FASD) (Sampson, 1997, Andersen et al, 2012, Popova et al, 2017, May et al, 2018). The most widely known effects of EtOH on the developing central nervous system (CNS) of experimental animals are reduced neurogenesis, abnormal neuronal differentiation and migration, and induction of neuronal apoptosis (Goodlett 2001, Guerri 2001, 2009, Ikonomidou 2000, Luo 1998, Olney 2002, West 1987, Guizzetti, 2014, Donald et al, 2015, Leigland et al, 2013). FASD also includes white matter abnormalities, but the mechanisms underlying them are not well understood (Wilhelm and Guizzetti, 2016). In animal models, the pattern of brain injury depends on the developmental stage at EtOH exposure (Mooney and Miller, 2007, Abbott et al, 2016, Gohlke et al, 2008). Oligodendrocytes (OLs) are the last cells generated during development, with maturation and myelination beginning during the second trimester, at 20 weeks gestational age (GA) in humans, and continues postnatally (Tanaka et al, 1995, Jiang and Nardelli J. 2016). Oligodendrocyte precursor cells (OPCs) are produced much earlier (E16 in rats and GA 5.5 weeks in humans). The myelination processes and expression of myelin basic protein (MBP) begins around GA 20 weeks (Abrahám et al, 2010; Nickel and Gu, 2018) and continues postnatally. Many human and animal studies have focused on late gestation effects of EtOH including degeneration and death of neurons, synaptic loss, and activation of microglia and astrocytes (Guizzetti et al, 2014, Gatford et al, 2007, Saito, 2016). However, clinically, first trimester EtOH exposure is more common, occurring during a stage that is more likely to directly affect OL and OPC differentiation and function. In addition, while the role of EtOH-induced neuroinflammation in EtOH-associated neuropathology has been studied in mid to late gestation animal models (Kane et al, 2014, Kane and Drew, 2016, Sowell et al, 2008, Fryer et al, 2008, Newville et al, 2017), less is known regarding human in-vivo effects, particularly in early gestation. Thus, investigation of the expression of cytokines and chemokines that regulate key signaling pathways in the human developing brain, including those that remain expressed in early postnatal life, is very important. Finally, male fetuses are most vulnerable to EtOH exposure (May et al, 2017), but human data regarding the mechanism of these sex differences have been limited.
2. Materials and Methods
2.1. Clinical samples.
A case control study was performed on 20 EtOH-exposed fetuses and 20 unexposed controls, selected from among a total of 153 EtOH-exposed and 71 unexposed control elective pregnancy terminations, in which none of the mothers used illicit drugs or CNS-active medications. Consenting mothers were enrolled between 12 and 21 weeks GA under a protocol approved by our Institutional Review Board. For each part of the study, all or an appropriate subset of these fetuses were analyzed, maintaining GA case control matching with regard to gender and GA. Maternal EtOH exposure was determined via a face-to-face questionnaire that also included questions regarding many types of drugs/medications used as well as tobacco exposure (Goetzl et al, 2016, Goetzl et al, 2019a, 2019b). The questionnaire was adapted from that designed to identify and quantify maternal EtOH exposure in the NIH/NIAAA Prenatal Alcohol and SIDS and Stillbirth (PASS) study (Dukes et al, 2014). EtOH exposure was defined as current daily use. Cases (EtOH users) were matched to controls (non-users) depending on biobank availability by GA (± 2 weeks) and fetal gender. Gender was determined using commercially available SRY primers (Integrated DNA Technologies, Inc., Coralville, IA) and Superscript One-Step RT-PCR with Platinum Taq (Life Technologies). Immediately following elective pregnancy termination, surgical tissue samples were collected by a trained study coordinator; both fresh and snap frozen samples were obtained and transferred to the laboratory within 40-60 minutes. Then aliquots either were used for RNA and protein extraction, or kept in liquid nitrogen for future use. Initial histologic staining of brain tissues from the Biobank confirmed that we had collected mostly cerebral cortex.
2.2. RNA preparation and real-time quantitative polymerase chain reaction (qRT-PCR).
Total RNA was isolated using the RNeasy kit (Qiagen, Valencia, CA) with on-column DNA digestion. The RT-PCR reaction was performed with 1 μg total RNA, using the One-Step FAST RT-PCR SYBR Green PCR Master Mix (Qiagen). The StepOnePlus Real-Time PCR system thermo cycler was used (Applied Biosystems, Waltham, MA). PCR conditions were activation 95°C 5 min, PCR 45 cycles: 95°C 10 sec, 60°C 20 sec, 72°C 30 sec, melting curve (95–65°C), cool to 40°C 30 sec. (Darbinyan et al, 2013). For relative quantification, the expression levels of genes were normalized to the housekeeping gene β-actin. Results are reported as fold regulated (see below: Statistical analysis for qRT-PCR studies).
2.3. Droplet Digital PCR (ddPCR).
For absolute quantitation of gene copies ddPCR was performed using the QX200 ddPCR system. Fifty ng of total RNA was used with the 1st Strand cDNA Synthesis Kit (Qiagen). After reverse transcription, the cDNA (300 dilution) aliquots were added to BioRad master mix to conduct ddPCR (EvaGreen ddPCR Supermix, BioRad). The prepared ddPCR master mix for each sample (20-μl aliquots) was used for droplet formation. PCR conditions: Activation 95°C 5 min, PCR 45 cycles at 95°C 10 sec, 60°C 20 sec, 72°C 30 sec, melting curve (95–65°C), cool to 40°C 30 sec (Darbinyan et al, 2013). The absolute quantity of DNA per sample (copies/μL) was calculated using QuantaSoft Analysis Pro Software (Bio-Rad) to analyze ddPCR data for technical errors (Poisson errors). The Poisson distribution is a function that relates the probability of a given number of events occurring independently in a given sample when the average rate of occurrence is known and very low. The key to accurate Poisson analysis lies in optimizing the ratio of the number of positive events (positive droplets) to the total number of independent events (the total number of droplets). A greater total number of droplets results in higher accuracy for Poisson-based counting. With 20,000 droplets, the ddPCR system yields an accurate starting template estimation from very low to very high target copy levels, providing a linear dynamic range of detection from 1–100,000 target copies. Estimation error is negligible compared with other error sources such as pipetting, sample processing, and biological variation. ddPCR data were exported to Microsoft EXCEL for further statistical analysis.
2.4. Primers (IDT Inc.).
ENA-78/CXCL5: Epithelial-derived neutrophil-activating protein 78, ENA-78, chemokine (C-X-C motif) ligand 5, S: 5’-CTGTGTTGAGAGAGCTGCGTTGC-3’, AS: 5’-GTTTTCCTTGTTTCCACCGTCC-3’;
GCP-2/CXCL6: Granulocyte chemotactic protein 2 (GCP-2)/ Chemokine (C-X-C motif) ligand 6 (CXCL6), S: 5’-GATTGGTAAACTGCAGGTGTTCC-3’; AS: 5’-TCCGG GTCCAGACAAACTTGCTTCCC-3’;
IL-8/CXCL8: Interleukin 8 (IL8 or chemokine (C-X-C motif) ligand 8, CXCL8), S: 5’-ATTTCTGCAGCTCTGTGTGAA-3’, AS: 5’-TGAATTCT CAGCCCTCTTCAA-3’;
GRO-α/CXCL1: Growth regulated protein alpha (GRO-α)/ Chemokine (C-X-C motif) ligand 1 (CXCL1), S: 5’-ATGGCCCGCGCTGCTCTCTCC-3’, AS: 5’-GTTGGATTTGTCACTGTTCAG-3’;
PDGFRα: Platelet derived growth factor receptor alpha, S: 5’-TCAGCT ACAGATGGCTTGATCC-3’, AS: 5’-GCCAAAGTCACAGATCTTCACAAT-3’;
Olig1: Oligodendrocyte Transcription Factor 1, S: 5’-CTAAAATAGGTAACCAGGCGTCTCA-3; AS: 5’-CCCGGTACTCCTGCGTGTT-3’;
Olig2: Oligodendrocyte Transcription Factor 2, S: 5’-TGCGCAAGCTTTCCAAGAT-3’; AS: 5’-CAGCGAGTTGGTGAGCATGA-3’;
NKX2.2: Nuclear transcription factor NK-2 homeobox locus 2, S: 5’-TCTACGACAGCAGCGACAAC-3’, AS: 5’-CTTGGAGCTTGAGTCCTGAG-3’;
MBP: Myelin Basic Protein, S: 5’-ACTATCTCTTCCTCCCAGCTTAAAAA-3’, AS: 5’-TCCGACTATAAATCGGCTCACA-3’,
β-actin: S 5’-CTACAATGAGCTGCG TGTGGC-3’, AS 5’-CAGGTCCAGACGCAGGATGGC-3’,
NANOG: Tír nan Òg (Celtic land of youth) homeobox transcription factor, S: 5’-ATGAGTGTGGATCCAGCTTGTCCCCAAAG-3’, AS: 5’-TCACACGTCTTCAGGTTGCATGTTCATGG-3’,
OCT4A: Octamer binding protein OCT4 (POU5F1) POU family transcription factor, S: 5’-CCCCTGGTGCCGTGAA-3’, AS: 5’-GCAAATTGCTCGAGTTCTTTCTG-3’.
2.5. Flow cytometry.
Fresh brain tissues were washed with cold phosphate-buffered saline (PBS) cocktail with 0.1% BSA and 1% protease inhibitors (Sigma). After dissociation of brain tissue through 70 mM mesh, 10,000 cells were placed onto 96-well plates and incubated with fluorescein isothiocyanate (FITC)-conjugated primary antibody for 1 hour. ßIII-tubulin was used as a neuronal marker, A2B5, glial fibrillary acidic protein (GFAP) as an astrocyte marker, neural/glial antigen 2 (NG2) as an early glial cell progenitor/neural stem cell marker, and oligodendrocyte transcription factor 2 (Olig2) and myelin basic protein (MBP) as late OL differentiation/myelination markers. Early injury in cell populations was quantified based on the proportion of each cell type subset expressing cleaved caspase-3. Proportions were quantified using 5,000 cells and GUAVA FACS software.
The Guava® Nexin Assay (Catalog No. 4500-0450), a sensitive assessment of early apoptosis, was used for monitoring early and late apoptotic events through the binding of Annexin V to the exposed phosphatidylserine (PS). Annexin V is a calcium-dependent phospholipid-binding protein with high affinity for phosphatidylserine (PS), a membrane component normally localized to the internal side of the cell membrane. Early in apoptosis, molecules of PS are translocated to the outer surface of the cell membrane, where Annexin V can readily bind to them. The assay relies on a two-dye strategy - Annexin V-PE (for early apoptosis, in blue), which binds to PS on the external membrane of apoptotic cells, and 7-AAD (for late apoptosis, in green), a fluorescent DNA intercalator that is membrane impermeant and is therefore excluded from live, healthy, and early apoptotic cells, but permeates late-stage apoptotic and dead cells. The following samples were prepared in triplicate: 1) Unexposed controls, 2) EtOH exposed; 3) control, annexin V-PE only; 4) EtOH exposed, annexin V-PE only; 5) control 7-AAD only; 6) EtOH exposed, 7-AAD only; 7) control, annexin V-PE + 7-AAD; 8) EtOH-exposed, annexin V-PE + 7-AAD. The samples were co-stained with cell type-specific markers. First, the samples were resuspended in 0.2 mL of 1X nexin buffer. Test samples were prepared as described in the kit package insert (Catalog No. 4500-0010). Samples were stained with 5 μL of annexin V-PE and 5 μL of nexin 7-AAD. 1X nexin buffer was substituted as appropriate for unexposed control and single stain controls. Samples were stained for 20 minutes on ice, shielded from light exposure. At the end of the incubation period, 150 μL of IX nexin buffer was added to each tube. The following cell categories were distinguished and their cells counted: i) Live & non-committed apoptotic cells (annexin V-PE (−), 7-AAD (−)); ii) early apoptotic cells (annexin V-PE (+), 7-AAD (−)); iii) late apoptotic, dead cells (annexin V-PE (+),7-AAD (+)); and iv) nuclear debris (apoptotic bodies) (annexin V-PE (− or dim), 7-AAD (+)). The percentages of apoptotic cells were determined by the Guava nexin software for control and EtOH-exposed cases. MBP or tubulin were assayed independently with or without caspase-3, while the nexin assay was run for early and late apoptosis. In Nexin Assay, graphs represent 4 quadrant staining populations:
upper left annexin V(−), 7-AAD(+) - nuclear debris
upper right annexin V(+), 7-AAD(+) - late apoptotic cells
lower left Annexin V(−), 7-AAD(−) - live, healthy cells
lower right Annexin V(+), 7-AAD(−) - early apoptotic cells
In graphs, annexin V is represented on the x-axis, and 7-AAD is represented on the y-axis.
2.6. Antibodies.
Alexa Fluor®-labeled neuronal class III β-tubulin (TUJ1, cat # A488-435L) monoclonal antibody was obtained from Covance Inc. (Berkeley, CA). Anti-A2B5 monoclonal antibody clone A2B5-105 (cat # MAB312R), anti-MBP (cat # AB5864), anti-Olig2 (cat # MABN50) and anti-Neuronal Nuclei (NeuN, cat # MAB377, clone A60) were purchased from EMD Millipore (Bedford, MA). Anti-NG2 antibody was purchased from Miltenyi Biotec Inc. (Auburn, CA). Anti-GFAP antibody (Clone 6F2) was purchased from Agilent Dako Denmark (Santa Clara, CA). Anti-GFAP (Cl9) goat polyclonal IgG (cat # sc-6170) antibody was purchased from Santa Cruz Biotechnology (Santa Cruz, CA). Alexa Fluor®-488 labeled anti-cleaved caspase-3 (cat # IC835G, Clone # 269518) was obtained from Life Technologies Corporation (Eugene, OR).
2.7. Statistical analysis.
Statistical analysis was performed in using SPSS (IBM Corp., released 2017). IBM SPSS Statistics for Windows, Version 25.0. Armonk, NY). Means were compared using the Student’s t-test with Bonferroni correction for multiple comparisons, where relevant. Proportions were compared using Fisher’s exact test or Chi-Square test. Statistical significance was defined as p < 0.05. Data from ddPCR, which measures absolute quantities of DNA per sample (copies/μL), was processed using QuantaSoft Analysis Pro Software (Bio-Rad) to analyze data for technical errors (Poisson errors). Data from ddPCR were exported to Microsoft EXCEL for further statistical analysis.
Statistical analysis for qRT-PCR studies.
In analyzing gene expression data from qRT-PCR assays, we compared gene expression between comparison populations using the well-established and widely adopted ΔΔCT method originally published by Livak and Schmittgen (2001). and described in the Qiagen Data Analysis Handbook (2019). We used statistical software purchased from Qiagen to carry out the calculations, which include Fold Regulation (default view), Fold Change, Average ΔCT, 2^–ΔCT, and p-value. For more information, the GeneGlobe Data Analysis Center is a complimentary resource for analyzing real-time PCR. The RT PCR modules transform the threshold number of PCR cycles (CT) to calculated results for gene expression. Fold Change is calculated as the ratio of the relative gene expression between the control group and each test group. Numbers greater than 1 indicate increased gene expression, numbers between 0 and 1 indicate decreased gene expression, and a Fold Change value of 1 indicates no change. ΔCT values (the normalized data), for each gene are calculated by subtracting the normalization factor. In comparing two groups, graphing Fold Change would result in skewed distributions, since if test group values are lower than those of the control group, the values are compressed into the range from 0 to less than 1, whereas when the test group values are greater than controls, the range of Fold Change may be much greater. Therefore, in the present study, data are presented as Fold Regulation, which is the customary default mode. For Fold Change values greater than 1, Fold Regulation and Fold Change values are the same. For Fold Change values less than 1, Fold Regulation is the negative inverse of the Fold Change value. Fold Regulation values less than -1 (or Fold Change less than 1) indicate decreased gene expression, and a Fold Regulation value of 1 indicates no change.
The p-value was calculated based on a Student’s t-test of the triplicate 2-ΔCT values (or linearized normalized gene expression levels) for each gene in each control vs. EtOH-exposed group comparison from two experiments with each tissue sample (6 control brain tissues vs. 6 EtOH brain tissues). Thus for each pairwise comparison, the total number of measurements was 12, and for calculation of t values, degrees of freedom = 10. The p-value calculation used was based on parametric, unpaired, two-sample equal variance, two-tailed distribution – a method widely accepted in the scientific literature. Both Groups in each pairwise comparison had to contain at least 3 samples for the software to calculate p-values for that comparison. Repeated measures ANOVA was used to perform qRT-PCR and flow cytometry statistical analysis.
3. Results
3.1. EtOH exposure was associated with reduced expression of mRNAs for markers of mature OLs, and increased expression of mRNAs for OPCs in the mid-second trimester.
EtOH-exposed fetal brains (n=20) and unexposed age-matched controls (n=20) were compared in these studies. The clinical characteristics of all subjects are shown in Table 1. We analyzed all 20 controls and 20 EtOH-exposed fetuses, which included 1st, early 2nd and late 2nd trimesters. The stages included in each analysis depend on the purpose of that part of the study. We have reported only late 2nd trimester samples in Figures 1, 3, 4 and 6 (n=6 control and 6 EtOH-exposed brain tissues) to study both RNA and protein levels, whereas we used both early 2nd trimester and late 2nd trimester samples in Figure 3D (n=6 for each group). In Figure 2, we report on samples from all 3 trimesters, since we need to compare levels of MBP at early gestational age (GA) with those from later stages of development (n=8), including 1st trimester (n=3), early 2nd trimester (n=3), and late 2nd trimester (n=2). For RNA assays, n=6 subjects for each group (GA=18.6 to 21.3 weeks for the control group and GA=19.3 to 21.4 weeks for the EtOH-exposed group) were studied for late OL markers, and for cytokines/chemokines. EtOH exposure was associated with a pattern of increased expression of mRNA markers for early stage OLs, OL progenitors and stem cells, and decreased expression of mRNA markers for mature OLs (Figure 1B). Downregulation of Olig1 (Figure 1C), O1ig2 (Figure 1D) and MBP (Figure 1E) was confirmed on the same RNA samples using ddPCR. Gene copy number dropped from 2026 to 1093 copies/μl for Olig1, 368 to 350 for O1ig2, and 71 to 54 for MBP.
Table 1.
Clinical characteristics of subjects exposed vs. unexposed to EtOH.
| Controls (n=20) | EtOH Exposure (n=20) | |
|---|---|---|
| Maternal age (years ±SD) | 24.6 ± 2.6 | 25.7 ± 1.4 |
| Parity (±SD) | 0.82 ± 0.41 | 0.82 ± 0.65 |
| GA (weeks ±SD) | 17.1 ± 1.4 | 18.7 ± 0.7 |
| GA range (weeks) | 12.2 to 21.3 | 12.5 to 21.4 |
| Body Mass Index (±SD) | 26.8 ± 1.8 | 26.9 ± 1.4 |
| Hispanic Ethnicity (%) | 15 | 15 |
| Race | ||
| White (%) | 60 | 65 |
| Black (%) | 40 | 35 |
| Tobacco Use (%) | 20 | 25 |
| Cannabinoid Use | 0 | 1/20 – once in early pregnancy |
| Medication Exposures | Albuterol (n=1) | Lisdexamfetamine dimesylate once daily GW 0-4 only (n=1) Coenzyme A (n=1) |
| Male Fetal Sex (%) | 50 | 50 |
Figure 1. EtOH exposure and expression of mRNA for OPC markers.

A, markers of OL lineage progression from immature (left) to mature (right). B, levels of mRNAs for each stage of OL maturation were assayed in whole brain homogenates, determined by qRT-PCR and graphed from left to right in order of maturity. Histogram values are normalized relative to controls (n = 6 per group, GA=18.6 to 21.3 weeks for Control group vs GA=19.3 to 21.4 weeks for EtOH-exposed group). Data presented as Fold Regulation. Student’s t-test was used to determine statistical significance. The p-value calculation used is based on parametric, unpaired, two-sample equal variance, two-tailed distribution. C, absolute quantitation of Olig1 mRNA in brain by ddPCR for EtOH-exposed (n=6) vs. Control (n=6) brains. Olig1 copy numbers varied from 1093 to 2026 copies/μl. D, EtOH-induced downregulation of Olig2 expression is brain, assessed by ddPCR. Brains of 6 EtOH-exposed cases were compared pairwise with 6 untreated controls. Values are shown in copies/μl. E, MBP gene expression in brain analyzed by ddPCR. Error bars are standard deviation.
Figure 3. Selective reduction in OL marker proteins by EtOH exposure.
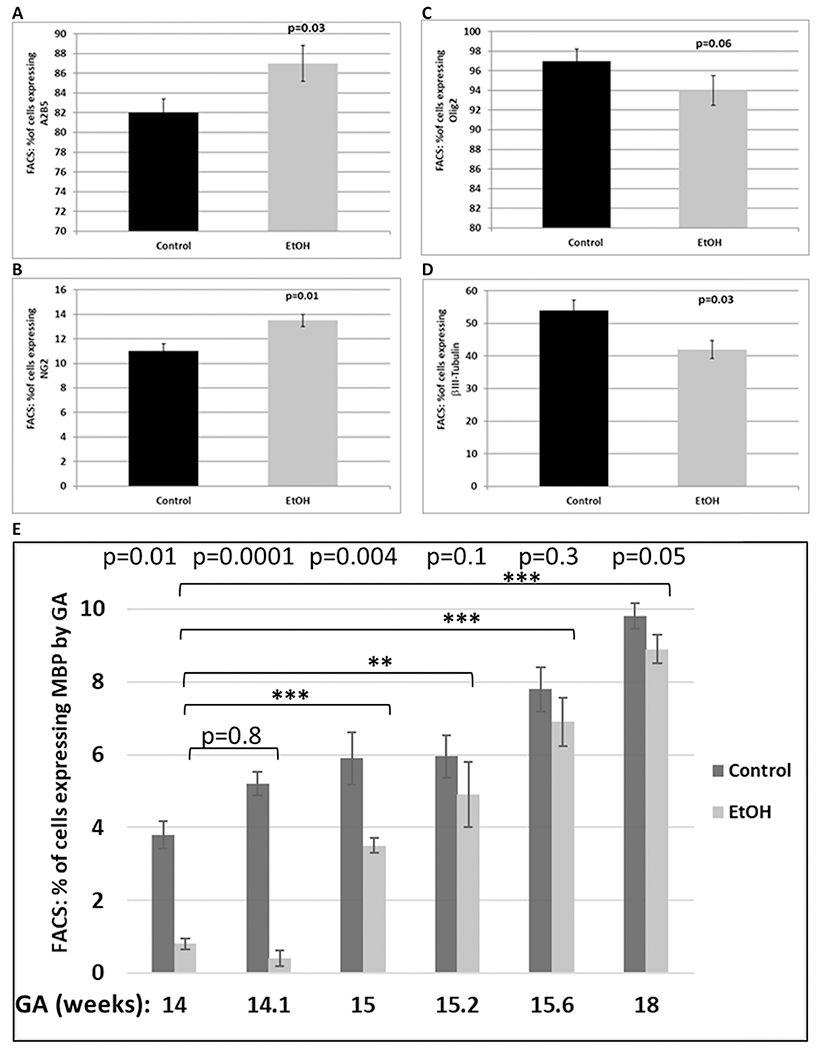
Relative expression of OL-specific markers with EtOH exposure was determined by FACS analysis in 6 EtOH-exposed cases and 6 controls in the late first through mid-second trimester. A, relative proportions of cells expressing the early stage OL marker A2B5, and NG2 (B) in fetal brain, used for Figure 1 (n = 6 per group, GA=18.6 to 21.3 weeks for Control group vs GA=19.3 to 21.4 weeks for EtOH-exposed group). Error bars are for standard deviation. C, relative proportions of cells expressing the late stage OL marker Olig2 in the same samples described in Figure 3A. C, relative proportions of cells expressing neuronal marker βIII-tubulin in the same samples explained in Figure 3A. D, down-regulation of MBP, with the greatest effect seen in early GAs (GA=14 to 18 weeks, n=6). Repeated measures ANOVA was used to perform flow cytometry statistical analysis. Statistical derivations of p-values for EtOH vs. control (p<0.001) at different GAs (p<0.001) are shown in Table 3.
Figure 4. Late injury and cell death is increased in EtOH-exposed fetal brains.
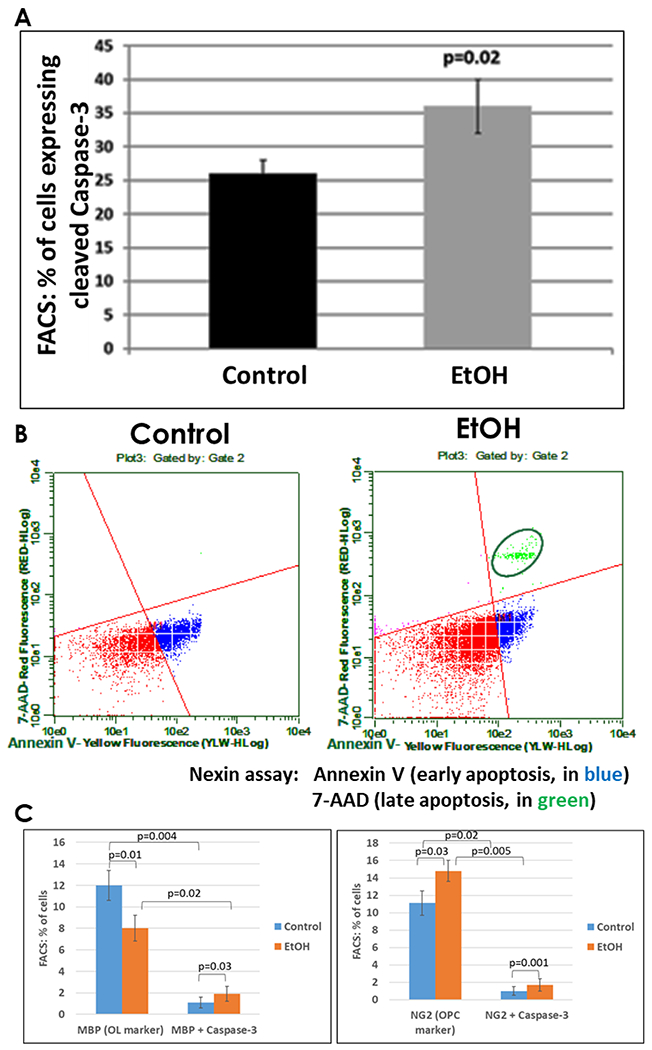
A, the effect of EtOH exposure on relative expression of cleaved caspase-3 was determined by FACS analysis in 6 EtOH-exposed cases and 6 controls in the late second trimester. Relative proportions of all cells (mixed cell types) expressing activated caspase-3 in the fetal brains used for Figures 1 and 3 (n = 6 per group, GA=18.6-21.3 weeks for the Control group vs. GA=19.3-21.4 weeks for EtOH-exposed group) is shown in bar graph. Error bars are for standard deviation. B, measures of early apoptosis and cell death in the same samples used in A. Representative dot-plots of the flow cytometry to measure membrane changes associated with early apoptosis, using annexin V-PE, and 7-AAD to identify dead cells. Three populations are identified with the Guava nexin reagent and analyzed with the Guava nexin software: the lower left quadrant (red) represents the live cells, i.e., 7-AAD and annexin-V-PE negative; the lower right quadrant (blue) represents early apoptotic cells with signs of injury or enhanced vulnerability, i.e., 7-AAD negative and annexin-V-PE positive. The upper right quadrant (green) represents dead or almost dead cells, i.e., 7-AAD and annexin-V-PE positive. C, co-expression of cleaved caspase-3 and the OL marker MBP (left panel), or the OPC marker NG2 (right panel), determined by FACS analysis in the samples used for 4A.
Figure 6. EtOH exposure increases expression of cytotoxic inflammatory cytokines/chemokines more in male fetuses than in females.

A, effects of maternal EtOH consumption on expression of cytokines/chemokines in fetal brain during OL lineage progression. Transcription of critical cytokines was assayed by Real-Time qRT-PCR using identical RNA samples from Figure 1. Dysregulation of the expression of five chemokines: CXC ligands CXCL1/GRO, IL-8, GCP2/CXCL6, ENA-78 and MCP1 were analyzed, using the same RNA preparations tested in Figure 1 (n = 6 per group, GA=18.6-21.3 weeks for the Control group vs. GA=19.3-21.4 weeks for the EtOH-exposed group). The levels of mRNAs for MCP-1, ENA78, GCP-2, GROa, IL-8 cytokines are expressed as fold regulation relative to unexposed controls. B, sex-dependent effect of EtOH exposure on expression of IGF-1 and TNF-α. Levels of mRNA are shown in male fetuses as fold regulation. For gender determination, one-step RT-PCR was performed using total RNA, utilizing forward and reverse primers for Sexdetermining Region Y (SRY), which encodes a protein involved in male sexual development (n = 6 per group; GA = 18.6-21.3 weeks for the Control group vs. GA = 19.3-21.4 weeks for the EtOH-exposed group). C, effect of EtOH exposure on expression of IGF-1 and TNF-α in female fetuses. Levels of mRNA are shown as fold regulation (n = 6 per group, GA = 18.6-21.3 weeks for the Control group vs. GA = 19.3-21.4 weeks for the EtOH-exposed group). Error bars are for standard deviation.
Figure 2. Expression of OL, glial and neuronal marker proteins in control (unexposed) brain tissues.

Expressions of the late stage OL markers Olig2 and MBP, along with the glial and neuronal markers GFAP and NeuN, respectively, were assayed by FACS from unexposed brain tissues (n=9 total) at three GAs: 12.2 (n=3), 16.5 (n=3) and 19.2 weeks (n=3). All proteins showed a developmental increase in expression, but this was not statistically significant for NeuN. Repeated measures ANOVA was used to perform statistical analysis of flow cytometry. The p-values above the graphs are for comparisons between 12.2 weeks and 19.2 weeks. The derivation of p-values for differences in expression of MBP vs. Olig2 (p<0.001), GFAP vs. Olig2 (p<0.001), NeuN vs. Olig2 (p=0.53), and among GAs (p=0.001) are given in Table 2.
3.2. EtOH exposure was associated with an increase in the proportion of cells that express protein markers for early OL progenitors, and a reduced proportion of cells expressing mature OL markers.
During the course of OPC differentiation, cells sequentially express A2B5, NG2 and MBP. To validate mRNA data, we examined OL lineage-specific protein markers by FACS analysis using the same brain samples. First, the expression of Olig2, MBP, GFAP and NeuN expression was assayed in FACS studies of unexposed brain tissues (n=9 total) across the first and second trimester - 12.2 (n=3), 16.5 (n=3) and 19.2 weeks (n=3) (Figure 2). Expression of Olig2 increased progressively from the earliest (12.2 weeks) to the latest (19.2 weeks) GAs (72% to 90%). GFAP also was developmentally regulated. The proportion of cells expressing GFAP increased from 30 to 60% across the same range of GAs. In contrast, NeuN expression was relatively stable throughout gestation (81% - 85%). The p-values for MBP vs. Olig2 (p<0.001), GFAP vs. Olig2 (p<0.001), NeuN vs. Olig2 (p=0.53) and GA (p=0.001) are shown in the Table 2. Fewer brain cells expressed MBP or GFAP than Olig2 (p<0.001 for each) (Figure 2). There was no statistically significant difference between NeuN and Olig2 expression. Repeated measures ANOVA was used to perform flow cytometry statistical analysis. Olig1 and 2 were expressed in both OLs and neurons. Co-expression of Olig2 and NeuN also has been reported by others (Jakovcevski and Zecevic, 2005). The proportions of cells expressing the early OPC markers A2B5 (Figure 3A) and NG2 (Figure 3B) were increased in EtOH-exposed brains when compared with controls. The proportion of cells expressing Olig2 was not significantly changed (Figure 3C). Alterations in protein expression were more modest than the corresponding mRNA changes. Expression of MBP increased with GA, but was reduced in all six EtOH-exposed cases compared to their GA-matched controls (Figure 3E). Of interest, up to 10 % of OLs expressed some degree of MBP by 19 weeks gestation. Changes for EtOH vs. control (p<0.001) and by GA (p<0.001) were statistically significant (Table 3). Finally, EtOH exposure was associated with reduced proportions of neurons (Figure 3D), and increased caspase-3 activation (Figure 4A). Co-expression of the OL marker MBP with cleaved caspase-3, or of the OPC marker NG2 with cleaved caspase-3, indicated that while cell injury was observed in both cell types, caspase activation was more common among OLs (25%) than among OPCs (12.5%) (Figure 4C). There appeared to be fewer cells per high power field in EtOH-exposed fetal brains than in unexposed controls. Moreover, co-expression of NeuN and cleaved Caspase-3 indicated that cell injury also was very prominent in neurons (Table 4). IHC of tissue samples with antibodies for cortical markers indicated that the brain samples used in the study were from cerebral cortex (Figure 5).
Table 2. Statistical treatment of data in Figure 2 for comparisons of expression of OL, glial and neuronal marker proteins in control (unexposed to ETOH) brain tissues of different GAs.
Repeated measures ANOVA was used to analyze flow cytometry data. The p-values are for comparisons of MBP vs. Olig2 (p<0.001), GFAP vs. Olig2 (p<0.001), NeuN vs. Olig2 (p=0.53), and among GAs (p=0.001).
| Solution for Fixed Effects | |||||||
|---|---|---|---|---|---|---|---|
| Effect | Group | Estimate | Standard Error | DF | t Value | Pr > |t| | |
| Intercept | 44.7311 | 6.1754 | 31 | 7.24 | <.0001 | ||
| Group | GFAP | −37.2000 | 2.9659 | 31 | −12.54 | <.0001 | |
| Group | MBP | −59.0000 | 2.9659 | 31 | −19.89 | <.0001 | |
| Group | NeuN | 1.8889 | 2.9659 | 31 | 0.64 | 0.5289 | |
| Group | Olig2 | 0 | |||||
| GestAge | 2.2924 | 0.3638 | 31 | 6.30 | <.0001 | ||
| Differences of Least Squares Means | |||||||
| Effect | Group | Group | Estimate | Standard Error | DF | t Value | Pr > |t| |
| Group | GFAP | MBP | 21.8000 | 2.9659 | 31 | 7.35 | <.0001 |
| Group | GFAP | NeuN | −39.0889 | 2.9659 | 31 | −13.18 | <.0001 |
| Group | GFAP | Olig2 | −37.2000 | 2.9659 | 31 | −12.54 | <.0001 |
| Group | MBP | NeuN | −60.8889 | 2.9659 | 31 | −20.53 | <.0001 |
| Group | MBP | Olig2 | −59.0000 | 2.9659 | 31 | −19.89 | <.0001 |
| Group | NeuN | Olig2 | 1.8889 | 2.9659 | 31 | 0.64 | 0.5289 |
Table 3. Statistical treatment of FACS analysis data from Figure 3, showing down-regulation of MBP by EtOH exposure.
EtOH vs. control (p<0.001); differences by GA (p<0.001).
| Solution for Fixed Effects | |||||||
|---|---|---|---|---|---|---|---|
| Effect | Group | Estimate | Standard Error | DF | t Value | Pr > |t| | |
| Intercept | −20.5213 | 2.3003 | 33 | −8.92 | <.0001 | ||
| Group | EtOH | −2.1500 | 0.3964 | 33 | −5.42 | <.0001 | |
| Group | Control | 0 | |||||
| GestAge | 1.7566 | 0.1491 | 33 | 11.78 | <.0001 | ||
| Differences of Least Squares Means | |||||||
| Effect | Group | Group | Estimate | Standard Error | DF | t Value | Pr > |t| |
| Group | EtOH | Control | −2.1500 | 0.3964 | 33 | −5.42 | <.0001 |
Table 4. Dramatic caspase 3 activation in neurons of EtOH-exposed fetal brains.
In the brains of EtOH-exposed fetuses, there appeared to be fewer cells of all types (at 400x magnification) than in unexposed controls. Co-staining for NeuN and cleaved caspase-3 showed that cell injury was especially common in neurons.
| Controls (n=8) | EtOH Exposure (n=8) | |
|---|---|---|
| Total Cells (DAPI) (%) | 100 | 67 ± 3.2 |
| NeuN (%±SD) | 83 ± 3.7 | 36 ± 2.9 |
| Cleaved Caspase-3 (%±SD) | 19 ± 1.8 | 28 ± 3.1 |
| NeuN + Cleaved Caspase-3 (%±SD) | 9 ± 0.8 | 21 ± 4.4 |
Figure 5. Histological analysis of cortical markers.

Representative histological and marker analysis on the intact human fetal cortex at 15 wks. was performed to confirm that the tissues sampled were of cerebral cortex origin. Laminar organization (left) and analysis with progenitor (Pax6), neuronal (TuJ1), layer specific (Ctip2), ventricular zone (βcatenin and Crb) and M-phase cell (pH3) markers were performed in unexposed control brain tissues.
3.3. Expression of pro-inflammatory and neurotoxic cytokines/chemokines in developing brain was increased with EtOH exposure.
We quantified expression of cytokines that regulate key signaling pathways in the brain (Darbinyan et al, 2013), including those that remain expressed in early postnatal life, as well as of apoptosis-related and developmentally regulated proteins (Figure 6A). There was a significant EtOH-associated upregulation of the expression of 5 chemokines, including CXC ligands CXCL1/GRO (↑ 3.8 fold), IL-8 (↑ 3.1 fold), GCP2/CXCL6 (↑ 5 fold), ENA-78 (↑ 5 fold), and MCP1 (↑ 4.1). These chemokines have been shown to be involved in several neuroinflammatory processes and can be produced by neurons and other brain cells. Recent studies have reported an increase in the brain levels of CXCL1 and several other cytokines and chemokines from the prenatal exposure to alcohol. This suggests that abnormal behaviors observed in FASD may result from morphological and functional abnormalities of the neocortex due to neuro-inflammation, dysregulation of microglial development, and improper morphogenesis of the neocortex (Komada et al, 2017).
3.4. EtOH effects on the neurotoxic cytokine TNFα and the neuroprotective growth factor IGF-1 were more extreme in the male than in the female fetal brain.
IGF-1 and TNF-α mRNAs were assayed in male (Figure 6B) and female (Figure 6C) brain tissues by Real-Time qRT-PCR. EtOH-exposed fetal brains showed upregulation of TNF-α and downregulation of IGF-1. In both cases, the changes were more extreme in males than in females. TNF-α was upregulated 9.8-fold in males, but only 4.7-fold in females; IGF-1 expression was downregulated 4.9-fold in males, but only 2.8-fold in females. Thus the EtOH-induced reductions in TNF-α were 2.1-fold greater in male fetuses than in females (9.8/4.7 = 2.1), and for IGF-1, the difference was 1.8-fold (4.9/2.8 = 1.8). These sex differences were statistically significant.
Discussion
4.1. Population sample.
The present study adds to our knowledge about the pathogenesis of FAS and FASD because it employed well characterized human fetal tissues, meticulously handled and processed to allow high quality RNA retrieval, which has been rare in previous studies. Our characterizations of maternal EtOH consumption were based on self-reports. It is unlikely that women would report significant exposure in the absence of EtOH use, but it is possible that some controls hid EtOH use. Thus if misclassification did occur, differences between groups could be even greater than we report. Women who use EtOH also can be exposed to other substances, as seen in our subjects. This might include tobacco, amphetamines, and cannabinoids, and it was not possible to guarantee that the controls were exquisitely matched. However tobacco use was relatively evenly matched between cases and controls, while cannabinoid and amphetamine use was limited, and occurred multiple weeks prior to sample collection.
4.2. The nature of the fetal OL defect in EtOH-induced demyelination.
Development of improved treatments for FAS and FASD requires a better understanding of the complex pathogenetic mechanisms underlying EtOH-induced CNS damage. Existing human in vitro models of FAS are limited to transformed astrocytic or microglial cell lines and primary human fetal astrocytes or microglia. These models cannot provide a complete understanding the complexity of OL differentiation and cellular interactions in the EtOH-exposed fetal brain in vivo. In particular, studies of OLs have been limited by the lack of data on human embryonic tissue exposed to EtOH in vivo, and where data are available, by a focus on later gestational ages. Our novel data show that EtOH exposure at early stages of development shifts OL cell populations toward more immature stages. Whether this is due to slowed maturation of OPCs or to increased apoptosis in OLs is not yet clear, but it seems likely to involve both, since increased apoptotic activity was found among OL cells at both stages, and the proportion of immature OPCs relative to mature OPCs also was increased. In any case, this EtOH-induced defect in OL generation is likely to have important adverse effects on myelination and structural organization in the developing brain.
4.3. Role of apoptosis in fetal EtOH-induced demyelination.
White matter appears to be particularly susceptible to damage by EtOH. Prenatal EtOH exposure was associated with disorganization or reduced density of myelinated axon tracts in studies using diffusion tensor and T1-weighted magnetic resonance imaging (Sowell et al, 2008). Seventeen children and adolescents with FASD were compared with 19 typically developing age-and gender-matched controls. Lower fractional anisotropy (FA) was observed in the right lateral temporal lobe and bilaterally in the lateral aspects of the splenium of the corpus callosum. Effects of in-utero exposure to EtOH was reported in a non-human primate (NHP) model (Farber et al, 2010, Creeley et al, 2013). A one-time exposure to EtOH was found to trigger acute widespread apoptosis in both neuronal cell bodies in the gray matter and OLs in the white matter during the late second trimester and early third trimester (GA 105-120 days), mid-third trimester (GA 125-140 days), or late third trimester (GA 145-155 days), and the rate of OL apoptosis in alcohol-exposed brains was 12.7 times higher than the natural OL apoptosis rate (Creeley et al, 2013). Full term gestation for this macaque species is 160–165 days (Tarantal and Hendrickx, 1988). Because the single-dose exposure was limited to the third trimester, this does not mimic common human use/abuse patterns. In macaques, OLs become vulnerable to EtOH in the mid-late second trimester. This also is when MBP generation begins, in preparation for axon myelination. Late stage OPCs and early stage OLs are vulnerable to other neurotoxic agents, such as hypoxia/ischemia, and the period of vulnerability for the develoment of periventricular leucomalacia in humans has been correlated with the period when immature OLs or late stage OPCs are committed to an OL fate but are not yet actively myelinating (Back et al, J Neurosci, 2001). In the developing human brain, this occurs 2–3 months earlier than the beginning of myelination (Back et al, 2002). OL apoptosis in EtOH-exposed macaque brains was 12.7 times higher than normal (Creeley et al, 2013). Similarly, we found that second trimester EtOH exposure decreased the survival of cells undergoing OL maturation by 20%, due to apoptosis. Thus, at least part of the OL loss is due to apoptosis, since the percentages of caspase positive cells were increased. Importantly, we confirmed a reduction in MBP gene copy numbers in the EtOH-exposed 2nd trimester fetal brains, using ddPCR.
4.4. Involvement of cytokines/chemokines in EtOH-indnced demyelination.
Previously, we and others have reported in pre-clinical models that chemokines are involved in the development of the OL lineage and myelination (Darbinyan et al, 2013). There is evidence that the chemokine GRO-α regulates the proliferation of OPCs (Robinson et al, 1998; Wu et al, 2000; Robinson and Franic, 2001). Knockout studies suggest that the receptor CXCR2, which binds several CXC ligands, including GRO and IL-8, plays a critical role in OL development. CXCR2 mutants exhibited abnormal migration of OPCs in the developing spinal cord (Tsai et al., 2002). GRO-κ and IL-8 also stimulate MBP synthesis in primary myelinating cultures, and proliferation of A2B5 precursor-like cell lines (Kadi et al, 2006). Several studies reported increased expression of many chemokines in CNS demyelinating disorders, including multiple sclerosis and FAS (Bartosik-Psujek and Stelmasiak, 2005, Crews et al, 2006, He and Crews, 2008). It is now evident that chemokines and their receptors play important roles, not only in the recruitment of inflammatory cells and the initiation of immune-mediated demyelination, but also in remyelination and repair of lesions (Arnett et al, 2003, Omari et al, 2005 a,b; Liu et al, 2010 a,b, Cartier et al, 2005, Bautista, 2002). Less is known regarding the role of cytokines/chemokines on OL lineage progression in the human brain, but the time course of OL maturation with regard to key neurodevelopmental processes in humans has been determined (Herschkowitz et al, 1997, Rice et al, 2000, Darbinyan et al, 2013). Finally, in adult humans, EtOH exposure was associated with increased levels of the chemokine MCP-1 (He and Crews, 2008). The present findings that EtOH-exposed cells show enhanced levels of specific chemokines suggest that deficits in OL differentiation are accompanied by chemokine dysregulation.
4.5. Preferential male fetal susceptibility to EtOH-induced demyelination.
In the present study, male fetal brains exposed to EtOH showed a greater increase in TNFα and reduction in IGF-1 expression than did females. Because of the relatively small sample sizes, these findings must be considered as preliminary, but they are consistent with previous preclinical and clinical observations suggesting a greater susceptibility of male fetuses to the effects of EtOH on the developing brain. In humans, male fetuses are known to be more vulnerable to EtOH exposure and more likely to develop FAS (May et al, 2017). Additional research reports that FASD is more prevalent in young boys than in young girls (12.9 per 1000 males vs. 10.4 per 1000 females). However, sex differences in the rate of FASD diagnosis dissipate in older children (Thanh et al, 2014, Tesche et al, 2014). Thus early diagnosis of more severe forms of FASD may be sex-dependent, while milder forms of FASD are not. Sex differences also have been identified in social recognition and memory tasks after early-life EtOH exposure. EtOH-exposed males exhibit decreases in social investigation, contact behavior and play fighting (Terasaki et al, 2016, Herman et al, 2008, Fast et al, 2013).
5. Conclusions
OLs regulate axonal size, function, and survival, and EtOH-mediated disruption of OL development could affect axon caliber and electrophysiological function. In addition, many neurodegenerative and neurodevelopmental diseases involve OL-neuron interactions (Lobsiger et al, 2007, Meyer and Kaspar, 2017). In developing therapeutic and preventive strategies to combat EtOH-associated neurodevelopmental pathology, it may be important to target not only the OLs themselves, but also the mechanisms of OL-neuron communication. Studies of EtOH effects on brain development have been limited to in vitro preparations, and to animal models, in which, except for non-human primates, the developmental stages equivalent to the human late-term fetus occur postnatally (Walters, 1987). Recent animal studies show that third trimester-equivalent alcohol exposure leads to an acute decrease in OL lineage cell numbers, accompanied by white matter injury (Newville et al, 2017). The present study extends our knowledge to human fetal OL development, and reveals that early EtOH exposure is associated with cytokine dysregulation. Specifically, cytokines/chemokines that are neurotoxic (TNFα), or are induced in various diseases and involved in inflammation (GCP-2, ENA-78, IL-8, MCP-1, GROα), or inhibit migration of oligodendrocyte precursors (GROα), are upregulated. On the other hand, the cytokine IGF-1, which is neuroprotective, is downregulated. This may contribute to the pathogenesis of FAS.
Highlights.
1) EtOH exposure was associated with reduced expression of mRNAs for markers of mature OLs and increased expression of mRNAs for OPCs in the mid-second trimester.
2) EtOH exposure was associated with an increase in the proportion of cells that express protein markers of early OL progenitors and a reduced proportion of cells expressing mature OL markers.
3) Expression of the neuroprotective growth factor IGF-1 was reduced by exposure to EtOH, while expression of the neurotoxic cytokine TNFα was increased. The changes were greater in the male than in female fetal brains.
Acknowledgements
We thank members of the Shriners Hospitals Pediatric Research Center for their support and insightful discussion. We wish to thank Dr. Seonhee Kim for assisting with the immunohistochemistry. We also wish to thank Mr. Yan Nickamin (Millipore) for important suggestions in using of GUAVA FACS software. This work was supported by NIH grant R01HD069238 and Gates Foundation grant OPP1119489 to Dr. Laura Goetzl, and a Pennsylvania State Department grant (Project 10: 420491-04400-02) to Dr. Nune Darbinian.
Footnotes
Publisher's Disclaimer: This is a PDF file of an unedited manuscript that has been accepted for publication. As a service to our customers we are providing this early version of the manuscript. The manuscript will undergo copyediting, typesetting, and review of the resulting proof before it is published in its final form. Please note that during the production process errors may be discovered which could affect the content, and all legal disclaimers that apply to the journal pertain.
Conflict of interest
The authors declare no competing financial interests.
References
- Abbott CW, Kozanian OO, Kanaan J, Wendel KM, Huffman KJ. The Impact of Prenatal Ethanol Exposure on Neuroanatomical and Behavioral Development in Mice. Alcohol Clin Exp Res. 2016. January; 40(1): 122–33. [DOI] [PMC free article] [PubMed] [Google Scholar]
- Abrahám H, Vincze A, Jewgenow I, et al. Myelination in the human hippocampal formation from midgestation to adulthood. International Journal of Developmental Neuroscience. 2010; 28(5):401–410. doi: 10.1016/j.ijdevneu.2010.03.004. [DOI] [PubMed] [Google Scholar]
- Andersen AM, Andersen PK, Olsen J, Grønbæk M, Strandberg-Larsen K. Moderate alcohol intake during pregnancy and risk of fetal death. Int J Epidemiol. 2012; 41:405–13. [DOI] [PubMed] [Google Scholar]
- Arikawa E, Quellhorst G, Han Y, Pan H, Yang J SABiosciences. RT2 Profiler™ PCR arrays: Pathway-focused gene expression profiling with qRT-PCR. 2009. [Google Scholar]
- Arnett HA, Wang Y, Matsushima GK, Suzuki K, Ting JP. 2003. Functional genomic analysis of remyelination reveals importance of inflammation in oligodendrocyte regeneration. J Neurosci 23:9824–9832. [DOI] [PMC free article] [PubMed] [Google Scholar]
- Back SA, Luo NL, Borenstein NS, Volpe JJ, Kinney HC. Arrested oligodendrocyte lineage progression during human cerebral white matter development: dissociation between the timing of progenitor differentiation and myelinogenesis. J Neuropathol Exp Neurol. 2002; 61(2): 197–211. doi: 10.1093/jnen/61.2.197 [DOI] [PubMed] [Google Scholar]
- Bartosik-Psujek H, Stelmasiak Z. 2005. The levels of chemokines CXCL8, CCL2 and CCL5 in multiple sclerosis patients are linked to the activity of the disease. Eur J Neurol 12:49–54. [DOI] [PubMed] [Google Scholar]
- Bautista AP. Acute ethanol binge followed by withdrawal regulates production of reactive oxygen species and cytokine-induced neutrophil chemoattractant and liver injury during reperfusion after hepatic ischemia. Antioxid Redox Signal. 2002. October; 4(5):721–31. [DOI] [PubMed] [Google Scholar]
- Cartier L, Hartley O, Dubois-Dauphin M, Krause KH. 2005. Chemokine receptors in the central nervous system: role in brain inflammation and neurodegenerative diseases. Brain Res Brain Res Rev 48:16–42. [DOI] [PubMed] [Google Scholar]
- Creeley CE, Dikranian KT, Johnson SA, Farber NB, Olney JW. Alcohol-induced apoptosis of oligodendrocytes in the fetal macaque brain. Acta Neuropathol Commun. 2013; 1: 23. [DOI] [PMC free article] [PubMed] [Google Scholar]
- Crews FT, Bechara R, Brown LA, Guidot DM, Mandrekar P, Oak S, Qin L, Szabo G, Wheeler M, Zou J Cytokines and alcohol. Alcohol. Clin. Exp. Res. 2006; 30:720–730. [DOI] [PubMed] [Google Scholar]
- Crews FT, Vetreno RP Mechanisms of neuroimmune gene induction in alcoholism. Psychopharmacology (Berl) 2016; 233:1543–1557. [DOI] [PMC free article] [PubMed] [Google Scholar]
- Darbinyan A, Kaminski R, White MK, Darbinian-Sarkissian N, Khalili K. Polyomavirus JC infection inhibits differentiation of oligodendrocyte progenitor cells. J Neurosci Res. 2013. January;91(1):116–27. [DOI] [PMC free article] [PubMed] [Google Scholar]
- Donald KA, Eastman E, Howells FM, Adnams C, Riley EP, Woods RP, Narr KL, Stein DJ. Neuroimaging effects of prenatal alcohol exposure on the developing human brain: a magnetic resonance imaging review. Acta Neuropsychiatr. 2015. October; 27(5):251–69 [DOI] [PubMed] [Google Scholar]
- Dukes KA, Burd L, Elliott AJ, Fifer WP, Folkerth RD, Hankins GD, Hereld D, Hoffman HJ, Myers MM, Odendaal HJ, Signore C, Sullivan LM, Willinger M, Wright C, Kinney HC; PASS Research Network. The safe passage study: design, methods, recruitment, and follow-up approach. Paediatr Perinat Epidemiol. 2014. September; 28(5):455–65. doi: 10.1111/ppe.12136. Epub 2014 Aug 5. [DOI] [PMC free article] [PubMed] [Google Scholar]
- Farber NB, Creeley CE, Olney JW. Alcohol-induced neuroapoptosis in the fetal macaque brain. Neurobiol Dis. 2010; 40(1):200–206. doi: 10.1016/j.nbd.2010.05.025 [DOI] [PMC free article] [PubMed] [Google Scholar]
- Fast DK. Corry J, Psych R. Understanding the similarities and differences between fetal alcohol spectrum disorder and mental health disorders. Book. 2013. Justice.gc.ca [Google Scholar]
- Fryer SL, Schweinsburg BC, Bjorkquist OA, Frank LR, Mattson SN, Spadoni AD, & Riley EP (2008). Characterization of white matter microstructure in fetal alcohol spectrum disorders. Alcoholism, clinical and experimental research, 33(3), 514–521. doi: 10.1111/j.1530-0277.2008.00864.X [DOI] [PMC free article] [PubMed] [Google Scholar]
- Gatford KL, Dalitz PA, Cock ML, Harding R, Owens JA. Acute ethanol exposure in pregnancy alters the insulin-like growth factor axis of fetal and maternal sheep. Am J Physiol Endocrinol Metab 292: E494–E500, 2007 [DOI] [PubMed] [Google Scholar]
- Goetzl L, Darbinian N, Goetzl EJ. 2016. Novel window on early human neurodevelopment via fetal exosomes in maternal blood. Ann Clin Transl Neurol. 2016; 3(5):381–385. February 25. doi: 10.1002/acn3.296 [DOI] [PMC free article] [PubMed] [Google Scholar]
- Goetzl L, Darbinian N, Merabova N 2019a. Noninvasive Assessment of Fetal Central Nervous System Insult: Potential Application to Prenatal Diagnosis. Prenatal Diagnosis. 2019 July; 39(8):609–615. doi: 10.1002/pd.5474. Epub 2019 Jun 13. [DOI] [PubMed] [Google Scholar]
- Goetzl L, Thompson-Felix T, Darbinian N, Merabova N, Merali S, Merali C, Sanserino K, Tatevosian T, Fant B and Wimmer ME 2019b. Novel Biomarkers to Assess In-Utero Effects of Maternal Opioid Use: First Steps towards Understanding Short and Long Term Neurodevelopmental Sequelae. Genes, Brain and Behavior. Accepted Author Manuscript, doi: 10.1111/gbb.12583 [DOI] [PMC free article] [PubMed] [Google Scholar]
- Gohlke JM, Griffith WC, Faustman EM. Computational models of ethanol-induced neurodevelopmental toxicity across species: Implications for risk assessment. Birth Defects Res B Dev Reprod Toxicol. 2008; 83:1–11. [DOI] [PubMed] [Google Scholar]
- Goodlett CR1, Horn KH. Mechanisms of alcohol-induced damage to the developing nervous system. Alcohol Res Health. 2001; 25(3): 175–84. [PMC free article] [PubMed] [Google Scholar]
- Guerri C, Pascual M, Renau-Piqueras J. Glia and fetal alcohol syndrome. Neurotoxicology (2001)22:593–9. [DOI] [PubMed] [Google Scholar]
- Guerri C, Bazinet A, Riley EP Foetal Alcohol Spectrum Disorders and alterations in brain and behavior. Alcohol. Alcohol. 2009; 44:108–114. [DOI] [PMC free article] [PubMed] [Google Scholar]
- Guizzetti M, Zhang X, Goeke C, Gavin DP. Glia and neurodevelopment: focus on fetal alcohol spectrum disorders. Front Pediatr. 2014. November 11; 2:123. doi: 10.3389/fped.2014.00123. Review. Erratum in: Front Pediatr. 2015; 3:27. [DOI] [PMC free article] [PubMed] [Google Scholar]
- Herman LE, Acosta MC, Chang P. Gender and attention deficits in children diagnosed with a fetal alcohol spectrum disorder. Can J Clin Pharmacol Vol 15(3) Fall 2008:e411–e419; October 24, 2008 [PubMed] [Google Scholar]
- He J, Crews FT Increased MCP-1 and microglia in various regions of the human alcoholic brain. Exp. Neurol. 2008; 210:349–358. [DOI] [PMC free article] [PubMed] [Google Scholar]
- Herschkowitz N, Kagan J, Zilles K. Neurobiological bases of behavioral development in the first year. Neuroped. 1997; 28:296–306. [DOI] [PubMed] [Google Scholar]
- Ikonomidou C, Bittigau P, Ishimaru MJ, Wozniak DF, Koch C, Genz K, Price MT, Stefovska V, Horsier F, Tenkova T, et al. Ethanol-induced apoptotic neurodegeneration and fetal alcohol syndrome. Science. 2000; 287:1056–1060. [DOI] [PubMed] [Google Scholar]
- Jakovcevski I, and Zecevic N. Olig Transcription Factors Are Expressed in Oligodendrocyte and Neuronal Cells in Human Fetal CNS. Journal of Neuroscience, 2005, 25 (44) 10064–10073; Development/Plasticity/Repair [DOI] [PMC free article] [PubMed] [Google Scholar]
- Jiang X, Nardelli J. Cellular and molecular introduction to brain development. Neurobiol Dis. 2016. August; 92(Pt A):3–17. doi: 10.1016/j.nbd.2015.07.007. Epub 2015 Jul 13. [DOI] [PMC free article] [PubMed] [Google Scholar]
- Kadi L, Selvaraju R, de Lys P, Proudfoot AE, Wells TN, Boschert U. 2006. Differential effects of chemokines on oligodendrocyte precursor proliferation and myelin formation in vitro. J Neuroimmunol 174:133–146. [DOI] [PubMed] [Google Scholar]
- Kane CJ, Drew PD Inflammatory responses to alcohol in the CNS: Nuclear receptors as potential therapeutics for alcohol-induced neuropathologies. J. Leukoc Biol. 2016; 100. [DOI] [PMC free article] [PubMed] [Google Scholar]
- Kane CJM, Phelan KD, Douglas JC, Wagoner G, Johnson JW, Xu J, Phelan PS, Drew PD. Effects of Ethanol on Immune Response in the Brain: Region Specific Changes in Adolescent versus Adult Mice. Alcoholism, clinical and experimental research. 2014; 38(2):384–391. doi: 10.1111/acer.12244 [DOI] [PMC free article] [PubMed] [Google Scholar]
- Komada M, Hara N, Kawachi S et al. Mechanisms underlying neuro-inflammation and neurodevelopmental toxicity in the mouse neocortex following prenatal exposure to ethanol. Sci Rep 7, 4934 (2017). doi: 10.1038/s41598-017-04289-1 [DOI] [PMC free article] [PubMed] [Google Scholar]
- Leigland L, Ford MM, Lerch JP, Kroenke CD The influence of fetal ethanol exposure on subsequent development of the cerebral cortex as revealed by magnetic resonance imaging. Alcohol. Clin. Exp. Res. 2013; 37:924–932. [DOI] [PMC free article] [PubMed] [Google Scholar]
- Liu L, Belkadi A, Darnall L, Hu T, Drescher C, Cotleur AC, Padovani-Claudio D, He T, Choi K, Lane TE, Miller RH, Ransohoff RM. 2010a. CXCR2-positive neutrophils are essential for cuprizone-induced demyelination: relevance to multiple sclerosis. Nat Neurosci 13:319–326. [DOI] [PMC free article] [PubMed] [Google Scholar]
- Liu L, Darnall L, Hu T, Choi K, Lane TE, Ransohoff RM. 2010b. Myelin repair is accelerated by inactivating CXCR2 on nonhematopoietic cells. J Neurosci 30:9074–9083. [DOI] [PMC free article] [PubMed] [Google Scholar]
- Livak KJ, Schmittgen TD. Analysis of relative gene expression data using real-time quantitative PCR and the 2(-Delta C(T)) Method. Methods. 2001; 25(4):402–408. doi: 10.1006/meth.2001.1262 [DOI] [PubMed] [Google Scholar]
- Lobsiger CS, Cleveland DW. Glial cells as intrinsic components of non-cell-autonomous neurodegenerative disease. Nat Neurosci (2007) 10:1355–60. doi: 10.1038/nn1988. [DOI] [PMC free article] [PubMed] [Google Scholar]
- Luo J, and Miller MW Growth factor–mediated neural proliferation: Target of ethanol toxicity. Brain Research Reviews 27(2): 157–167, 1998. [DOI] [PubMed] [Google Scholar]
- May PA, Chambers CD, Kalberg WO, Zellner J, Feldman H, Buckley D, Kopald D, Hasken JM, Xu R, Honerkamp-Smith G, Taras H, Manning MA, Robinson LK, Adam MP, Abdul-Rahman O, Vaux K, Jewett T, Elliott AJ, Kable JA, Akshoomoff N, Falk D, Arroyo JA, Hereld D, Riley EP, Charness ME, Coles CD, Warren KR, Jones KL, Hoyme HE. Prevalence of Fetal Alcohol Spectrum Disorders in 4 US Communities. JAMA. 2018. February 6; 319(5):474–482. [DOI] [PMC free article] [PubMed] [Google Scholar]
- May PA, Tabachnick B, Hasken JM, Marais AS, de Vries MM, Barnard R, Joubert B, Cloete M, Botha I, Kalberg WO, Buckley D, Burroughs ZR, Bezuidenhout H, Robinson LK, Manning MA, Adnams CM, Seedat S, Parry CDH, Hoyme HE. Who is most affected by prenatal alcohol exposure: Boys or girls? Drug Alcohol Depend. 2017. August 1; 177:258–267. doi: 10.1016/j.drugalcdep.2017.04.010. Epub 2017 Jun 15. [DOI] [PubMed] [Google Scholar]
- McCarthy DJ, Smyth GK. Testing significance relative to a fold-change threshold is a TREAT. Bioinformatics. 2009;25(6):765–771. doi: 10.1093/bioinformatics/btp053 [DOI] [PMC free article] [PubMed] [Google Scholar]
- Meyer K and Kaspar BK. Glia - Neuron Interactions in Neurological Diseases: Testing Non-cell Autonomy in a Dish. Brain Res. 2017. February 1; 1656: 27–39. [DOI] [PMC free article] [PubMed] [Google Scholar]
- MMWR. Alcohol Use and Binge Drinking Among Women of Childbearing Age-United States, 2006-2010. MMWR Morb Mortal Wkly Rep. 2012; 61:534–8 Centers for Disease Control and Prevention (CDC) [PubMed] [Google Scholar]
- Mooney SM, Miller MW. Time-specific effects of ethanol exposure on cranial nerve nuclei: Gastrulation and neurogenesis. Exp Neurol. 2007; 205:56–63. [DOI] [PMC free article] [PubMed] [Google Scholar]
- Mutch RC, Jones HM, Bower C, Watkins RE. Fetal Alcohol Spectrum Disorders: Using Knowledge, Attitudes and Practice of Justice Professionals to Support their Educational Needs. J Popul Ther Clin Pharmacol. 2016; 23(l):e77–89. Epub 2016 Apr 22. [PubMed] [Google Scholar]
- Newville J, Valenzuela CF, Li L, Jantzie LL, Cunningham LA. Acute oligodendrocyte loss with persistent white matter injury in a third trimester equivalent mouse model of fetal alcohol spectrum disorder. Glia. 2017. August;65(8):1317–1332. doi: 10.1002/glia.23164. Epub 2017 May 18. [DOI] [PMC free article] [PubMed] [Google Scholar]
- Nickel M, Gu C. Regulation of Central Nervous System Myelination in Higher Brain Functions. [DOI] [PMC free article] [PubMed]
- Olney JW New insights and new issues in developmental neurotoxicology. Neurotoxicology. 2002; 23:659–668. [DOI] [PubMed] [Google Scholar]
- Omari KM, John G, Lango R, Raine CS. 2005a. Role for CXCR2 and CXCL1 on glia in multiple sclerosis. Glia 53:24–31. [DOI] [PubMed] [Google Scholar]
- Omari KM, John GR, Sealfon SC, Raine CS. 2005b. CXC chemokine receptors on human oligodendrocytes: implications for multiple sclerosis. Brain 128:1003–1015. [DOI] [PubMed] [Google Scholar]
- Ornoy A, Ergaz E. Alcohol Abuse in Pregnant Women: Effects on the Fetus and Newborn, Mode of Action and Maternal Treatment. Int. J. Environ. Res. Public Health 2010, 7, 364–379 [DOI] [PMC free article] [PubMed] [Google Scholar]
- Popova S, Lange S, Probst C, Gmel G, Rehm J. Estimation of national, regional, and global prevalence of alcohol use during pregnancy and fetal alcohol syndrome: a systematic review and meta-analysis. The Lancet Global Health, 2017; DOI: 10.1016/S2214-109X(17)30021-9 [DOI] [PubMed] [Google Scholar]
- Rice D, Barone S Jr. Critical periods of vulnerability for the developing nervous system: evidence from humans and animal models. Environ Health Perspect. 2000. June; 108 Suppl 3:511–33. [DOI] [PMC free article] [PubMed] [Google Scholar]
- Robinson S, Franic LA. 2001. Chemokine GRO1 and the spatial and temporal regulation of oligodendrocyte precursor proliferation. Dev Neurosci 23:338–345. [DOI] [PubMed] [Google Scholar]
- Robinson S, Tani M, Stricter RM, Ransohoff RM, Miller RH. 1998. The chemokine growth-regulated oncogene-alpha promotes spinal cord oligodendrocyte precursor proliferation. J Neurosci 18:10457–10463. [DOI] [PMC free article] [PubMed] [Google Scholar]
- RT2 Profiler PCR Arrays & Assays Data Analysis Handbook, 09/2019, https://geneglobe.qiagen.com/us/analyze/; https://dataanalysis2.qiagen.com/pcr; www.qiagen.com/RefDB/search.asp.
- Saito M, Chakraborty G, Hui M, Masiello K, Saito M,Basavarajappa BS. Ethanol-Induced Neurodegeneration and Glial Activation in the Developing Brain. Brain Sci. 2016; 6 (3): 31. [DOI] [PMC free article] [PubMed] [Google Scholar]
- Sampson PD, Streissguth AP, Bookstein FL, Little RE, Clarren SK, Dehaene P, Hanson JW, Graham JM Jr. Incidence of fetal alcohol syndrome and prevalence of alcohol-related neurodevelopmental disorder. Teratology, 1997. 56(5): p. 317–26. [DOI] [PubMed] [Google Scholar]
- Sowell ER, Johnson A, Kan E, Lu LH, Van Horn JD, Toga AW, et al. Mapping white matter integrity and neurobehavioral correlates in children with fetal alcohol spectrum disorders. J Neurosci (2008) 28:1313–9. [DOI] [PMC free article] [PubMed] [Google Scholar]
- Sowell ER, Mattson SN, Thompson PM, Jemigan TL, Riley EP, Toga AW. (2001a) Mapping callosal morphology and cognitive correlates: effects of heavy prenatal alcohol exposure. Neurology 57:235–244. [DOI] [PubMed] [Google Scholar]
- Sowell ER, Thompson PM, Mattson SN, Tessner KD, Jernigan TL, Riley EP, Toga AW. (2001b) Voxel-based morphometric analyses of the brain in children and adolescents prenatally exposed to alcohol. NeuroReport 12:515–523. [DOI] [PubMed] [Google Scholar]
- Sowell ER, Mattson SN, Kan E, Thompson PM, Riley EP, Toga AW. (2008) Abnormal cortical thickness and brain-behavior correlation patterns in individuals with heavy prenatal alcohol exposure. Cereb Cortex 18:136–144 [DOI] [PMC free article] [PubMed] [Google Scholar]
- Tanaka SI, Mito T, Takashima S. Progress of myelination in the human fetal spinal nerve roots, spinal cord and brainstem with myelin basic protein immunohistochemistry. Early Hum Dev. 1995. March 17; 41(l):49–59. [DOI] [PubMed] [Google Scholar]
- Tarantal AF, Hendrickx AG: Characterization of prenatal growth and development in the crab-eating macaque (Macaca fascicularis) by ultrasound. Anat Rec 1988, 222: 177–184. 10.1002/ar.1092220210 [DOI] [PubMed] [Google Scholar]
- Terasaki LS, Gomez J, Schwarz JM. An examination of sex differences in the effects of early-life opiate and alcohol exposure. Philos Trans R Soc Lond B Biol Sci. 2016; 371(1688):20150123. doi: 10.1098/rstb.2015.0123 [DOI] [PMC free article] [PubMed] [Google Scholar]
- Tesche CD, Kodituwakku PW, Garcia CM, Houck JM. Sex-related differences in auditory processing in adolescents with fetal alcohol spectrum disorder: A magnetoencephalographic study. Neuroimage Clin. 2014; 7:571–587. Published 2014 December 17. doi: 10.1016/j.nicl.2014.12.007 [DOI] [PMC free article] [PubMed] [Google Scholar]
- Thanh NX, Jonsson E, Salmon A, Sebastianski M. 2014. Incidence and prevalence of fetal alcohol spectrum disorder by sex and age group in Alberta, Canada. J. Popul. Ther. Clin. Pharmacol. 21, e395–e404. [PubMed] [Google Scholar]
- Tsai HH, Frost E, To V, Robinson S, Ffrench-Constant C, Geertman R, Ransohoff RM, Miller RH. 2002. The chemokine receptor CXCR2 controls positioning of oligodendrocyte precursors in developing spinal cord by arresting their migration. Cell 110:373–383 [DOI] [PubMed] [Google Scholar]
- Walters JR. Transition to adulthood In: Smuts BB, Cheney DL, Seyfarth RM, Wrangham RW, Struhsaker TT, editors. Primate Societies. Chicago: University of Chicago Press; 1987. pp. 358–369. [Google Scholar]
- West JR Fetal alcohol-induced brain damage and the problem of determining temporal vulnerability: A review. Alcohol and Drug Research 7: 423 441, 1987 [PubMed] [Google Scholar]
- Wilhelm CJ, Guizzetti M. Fetal Alcohol Spectrum Disorders: An Overview from the Glia Perspective. Front Integr Neurosci. 2016. January 11; 9:65. [DOI] [PMC free article] [PubMed] [Google Scholar]
- Wu Q, Miller RH, Ransohoff RM, Robinson S, Bu J, Nishiyama A. 2000. Elevated levels of the chemokine GRO-1 correlate with elevated oligodendrocyte progenitor proliferation in the jimpy mutant. J Neurosci 20:2609–2617. [DOI] [PMC free article] [PubMed] [Google Scholar]