

Abstract
Background:
Diffusion-weighted imaging (DWI) is common for evaluating pediatric musculoskeletal lesions, but suffers from geometric distortion and intense acoustic noise.
Purpose:
To investigate the performance of a near-silent and distortion-free DWI sequence (DW-SD) relative to standard echo-planar DWI (DW-EPI) in pediatric extremity MRI.
Study Type:
Prospective validation study.
Subjects:
Thirty-nine children referred for extremity MRI.
Field Strength/Sequence:
DW-EPI and DW-SD, based on a rotating ultrafast sequence modified with sinusoidal diffusion preparation gradients, at 3T.
Assessment:
DW-SD image quality (Sanat) was assessed from 0 (nondiagnostic) to 5 (outstanding) and comparative image quality (Scomp) (from −2 = DW-EPI more delineated to +2 = DW-SD more delineated, 0 = same). ADC measured by DW-SD and DW-EPI were compared in bone marrow, muscle, and lesions.
Statistical Tests:
Wilcoxon rank-sum test and confidence interval of proportions (CIOP) were calculated for Scomp, Student’s t-test, coefficient of variation (COV), and Bland-Altman analysis for ADC values, and intraclass correlation coefficient (ICC) for interreader agreement.
Results:
DW-SD and DW-EPI ADC values for bone marrow, muscle, and lesions were not significantly different (P = 0.3, P = 0.2, and P = 0.27, respectively) and had an overall ADC COV of 14.8% (95% confidence interval: 12.3%, 16.9%) and no significant proportional bias on Bland-Altman analysis. Sanat CIOP was rated diagnostic or better (score of 3, 4, or 5) in 72–98% of cases for bone marrow, muscle, and soft tissues. DW-SD was equivalent to or preferred over DW-EPI in muscles and soft tissues, with CIOP 86–93% and 93%, respectively. Lesions were equally visualized on DW-SD and DW-EPI in 40–51%, with DW-SD preferred in 44–56% of cases. DW-SD was rated significantly better than DW-EPI across all comparative variables that included bone marrow, muscle, soft tissue, cartilage, and lesions (P < 0.05). Readers had moderate to near-perfect (ICC range = 0.45–0.85).
Data Conclusion:
DW-SD of the extremities provided similar ADC values and improved image quality compared with conventional DW-EPI.
DIFFUSION-WEIGHTED IMAGING (DWI) is useful for the evaluation of many pediatric musculoskeletal disease processes.1–5 The most-used DWI technique is a single-shot, 2D echo-planar imaging (EPI) sequence using two symmetric diffusion-sensitizing gradient pulses about a 180° refocusing pulse. However, the fast-switching steep gradients of the EPI readout produce high acoustic noise,6 resulting in patient discomfort and motion, particularly in children. Based on institutional experience, this could possibly result in pre-mature termination of the examination, particularly in children. A second issue with single-shot 2D EPI is that the readout is susceptible to field inhomogeneities resulting in image distortion.7 This image distortion can be particularly severe in the neck and extremities, particularly in pediatric patients with small anatomic structures.
Multiple approaches to reduce acoustic noise and geometric distortion have been proposed.8–10 To reduce acoustic noise, “Soft gradients”8,9 and optimized gradient hardware10 have been proposed. In particular, it has been shown that sinusoidal gradients with a single fundamental frequency decrease acoustic noise without affecting image quality or apparent diffusion coefficient (ADC) measurements.11 To reduce geometric image distortion, one approach is multishot EPI12–14; however, this often suffers from artifacts due to motion-induced phase inconsistency and requires advanced corrective measures, such as acquisition of a navigator,15 parallel imaging,13 and/or low-rank regularization methods.16,17 A second approach is to use non-EPI acquisition methods with diffusion-weighted driven-equilibrium preparation.18–22 This involves at least one 180° RF pulse and surrounding diffusion gradients; the subsequent spins tipped back into the longitudinal axis allows an independent choice of readout, such as fast spin echo18,19 or gradient echo.20–22 Overall improved image quality compared to conventional DWI acquisitions has been shown when diffusion-weighted-driven equilibrium was applied to vascular/cardiac19,23 and prostate18,24 magnetic resonance imaging (MRI) examinations. Third, distortion may be reduced by using shorter echo spacing and reducing the field of view (FOCUS or ZOOM).
The purpose of this study was to evaluate a distortion-free and near-silent diffusion-weighted (DW-SD) sequence25,26 and compare it with the standard 2D EPI diffusion-weighted (DW-EPI) sequence in the setting of pediatric extremity MRI. We hypothesized that the ADCs measured from each sequence would not be significantly different and that qualitatively DW-SD will be equivalent or preferred over DW-EPI.
Materials and Methods
Patient Recruitment
With Institutional Review Board approval and informed patient consent, a DW-SD sequence was added to all pediatric musculoskeletal (MSK) MRI exams requested for suspicion for a malignant/benign lesion, an infectious/inflammatory process, and/or vascular malformation from October 2018 to January 2020. Although DWI has been described in assessing for anterior cruciate ligament (ACL) injury,3 for the purposes of this study those patients presenting with nonspecific, activity, and/or sports-related extremity pain were excluded. Final diagnosis for the MSK MRI extremity examinations was noted from a review of the patients’ electronic medical records and categorized as malignant osseous lesion, benign osseous lesion, soft-tissue lesion, osseous infectious/inflammatory process, soft-tissue infectious/inflammatory process, or other. Diagnosis was made either from biopsy or clinical judgment of the referring clinical team and/or the pediatric radiologist. Examinations in which no lesion was identified on any sequence in the exam were omitted from subsequent analysis.
Imaging
Images were acquired at 3T (MR750, GE Healthcare, Waukesha, WI). Diffusion imaging utilizing the standard echo planar technique (DW-EPI) was acquired with the application of an additional standard vendor algorithm allowing for a smaller field-of-view (FOV), which utilizes inner volume excitation with two perpendicularly applied RF pulses (FOCUS). The DW-SD sequence employed a multisegmented approach, combining a driven-equilibrium diffusion preparation and a rotating ultrafast imaging sequence (RUFIS) readout, with diffusion gradients applied on all three axes.25 A chemical shift-selective pulse was used for fat saturation before the diffusion-weighted preparation pulse. At the end of the fat-saturation pulse, a trapezoidal spoiler gradient with a low slew rate (2.9 T/m/s) was used to minimize acoustic noise. The diffusion-weighted preparation pulse utilizes a sinusoidal bipolar gradient to reduce acoustic noise and eddy currents. Acoustic noise has previously been measured,25 with DW-EPI significantly louder than DW-SD (85 ± 2.4 dB vs. 54 ± 2.4 dB; P < 0.05); for reference ambient noise of MRI machine when idle it is 51 ± 2.8 dB.
A radial acquisition in k-space was then performed, and the entire k-space was acquired in two parts: water- and fat-suppressed solid-state proton projection imaging (WASPI)27 and non-WASPI readout. The center of k-space was acquired by a two-segment WASPI readout, while the outer k-space was acquired by a number of segments (radial spokes) calculated based on the given scanning matrix and Nyquist sampling requirement. Additional T1 recovery compensation and image reconstruction using the second-order total generalized variation method28 were utilized to optimize image contrast and reduce aliasing artifacts.
For both the DW-SD and DW-EPI sequences, two b-values (50 and 600 s/mm2) were acquired. ADC maps were generated using standard calculation of −log (SI/SIb = 50)/b, where b is the diffusion weighting, SI is the signal intensity on the b-600 images, and SIb = 50 is the signal intensity on the b-50 images. The diffusion sequences were acquired before the administration of gadolinium contrast. Although a variety of coils were utilized, depending on patient anatomy and size, the smallest coil possible was used; for example, a 16-channel flexible extremity coil was used for knee scans. Both DW-SD and DW-EPI sequences were acquired with scan planes along the long axis of the imaged extremity/joint (eg, sagittal plane for knee joint). Diffusion sequence parameters for the knee are shown in Table 1, with FOV and matrix adjusted to the anatomic location being scanned.
TABLE 1.
Diffusion Scan Parameters
| DW-SD | DW-EPI | |
|---|---|---|
| TR | 528 msec | 3850 msec |
| TE | 54 msec | 46.1 msec |
| FOV (knee)a | 160 × 160 mm | 160 × 160 mm |
| Matrix | 128 × 128 | 128 × 128 |
| Slice thickness | 4 mm | 4 mm |
| NEX | 2.5 | 2.5b |
| b-value (s/mm2) | 50 and 600 | 50 and 600 |
| Flip angle for RUFIS readout | 3° | |
| k-space center: Number of segments | 2 | |
| k-space center: Total spokesc | 768 | |
| k-space outer: Number of segments | 34 | |
| k-space outer: Total spokesc | 13,056 | |
| Scan time | 5 min | 2 min |
TR = time of repetition; TE = time of echo; NEX = number of excitations; FOV = field-of-view; DW-SD = diffusion weighted: near silent and distortion-free; DW-EPI = diffusion weighted: echo planar imaging; RUFIS = rotating ultrafast sequence.
FOV varied depending on patient region scanned.
NEX was 2.5 at b = 50 s/mm2, NEX was 8 at b = 600 s/mm2.
384 spokes per segment.
Image Analysis
All DW-SD and DW-EPI images were reviewed in a blinded fashion independently by three board-certified radiologists (J.S., V.Y., and A.S.), each with 5 years of experience. For DW-SD, image quality (Sanat) was rated on a five-point scale ranging from 1 (nondiagnostic) to 5 (outstanding) for four anatomic structures: bone marrow, muscle, superficial soft tissues, and cartilage. Both b = 50 s/mm2 and b = 600 s/mm2 acquisitions were viewed together. DW-SD was then compared to standard DW-EPI (Scomp) and rated on a five-point scale ranging from −2 (DW-EPI provided better delineation) to +2 (DW-SD provided better delineation) for the four anatomic structures listed above, as well as the appearance of lesions on the b = 50 s/mm2 images and the ADC map. Details of the rating scales used for both evaluations are listed in Table 2.
TABLE 2.
Image Rating Criteria
| DW-SD image quality (Sanat) rating scale |
| 1. Nondiagnostic: cannot see structure |
| 2. Limited: can see structure but cannot evaluate for lesions |
| 3. Diagnostic: can evaluate structure with some confidence |
| 4. Good: can evaluate structure with high confidence |
| 5. Outstanding: best quality of delineation |
| DW-SD and DW-EPI comparative image quality (Scomp) scale |
| −2. Conventional EPI greater anatomic delineation |
| −1. Conventional EPI preferred |
| 0. Same |
| 1. SD preferred |
| 2. SD greater anatomic delineation |
DW-SD = diffusion weighted: near silent and distortion-free; DW-EPI = diffusion weighted: echo planar imaging.
A radiologist (J.S.) placed separate regions-of-interest (ROIs) with an area of ~0.8 cm2 (1 cm diameter) in the bone marrow (metaphysis if possible), muscle, and target lesion on the DW-SD and DW-EPI ADC maps. For bone marrow and muscle, the ROIs were placed on normal-appearing regions.
Statistical Analysis
Data organization and statistical analysis were performed using SPSS v. 25 software (IBM, Armonk, NY). A Kolmogorov-Smirnov test was performed on all datasets to assess for normality. Parametric and nonparametric data are presented as mean or median and compared by unpaired t-test or the Wilcoxon test, respectively. Patient demographics were noted.
Three readers individually assessed DW-SD image quality (Sanat) and also individually compared DW-SD with standard DW-EPI (Scomp). Interrater agreement was assessed with the intraclass correlation coefficients (ICC) calculated for each image quality and comparative anatomic variable (bone marrow, muscle, soft tissue, cartilage, and pathology) category using a two-way random model, absolute agreement, and average measures. ICC values were interpreted as poor (0.2 or less), fair (0.21–0.4), moderate (0.41–0.6), strong (0.61–0.8), or near perfect (0.81 and greater) agreement. Sub-analysis utilizing confidence interval of proportions (CIOP) with a 95% confidence interval (CI) was performed when grouping Sanat scores for DW-SD as diagnostic or better (score = 3 to 5) and grouping Scomp scores of the same or better for DW-SD (score = 0 to +2). A two-sided Wilcoxon rank sum test was performed to assess the null hypothesis that there was no preference between DW-SD and DW-EPI. ADC comparison (bone marrow, muscle, and lesion) between DW-SD and DW-EPI was performed using a two-tailed paired Student’s t-test, coefficient of variation (COV) from duplicate measurements using the logarithmic method and Bland-Altman analysis. Limits of agreement for the Bland-Altman analysis were set at ±2 standard deviations above and below the bias. Ideal limits for ADC COV was set at 14% (95% CI: 13–15%), based on an ADC reproducible study.29 The threshold for type 1 error (P-value) was set to 0.05.
Results
During the enrollment period, a total of 1330 MSK examinations were performed, of which 482 declined informed consent, and 805 were excluded for sports-related indications. In total, 39 subjects, 20 boys and 19 girls (mean age 11.2 ± 5.2 years, range 0.6–20.3 years), satisfying the inclusion criteria were enrolled. Four patients had follow-up MRI examinations, resulting in 43 MSK MRI examinations with both DW-SD and DW-EPI sequences performed. Table 3 shows a summary of the MRI examinations performed and the associated lesions. The most common extremity exam performed was a knee MRI (n = 17), and the most common disease process identified was an osseous infectious/inflammatory process (n = 13).
TABLE 3.
Examinations Performed and Patient Lesions
| Number of cases | |
|---|---|
| Examinations performed | |
| Knee | 17 |
| Humerus | 7 |
| Femur | 6 |
| Hip | 4 |
| Ankle | 3 |
| Tibia-fibula | 3 |
| Foot | 1 |
| Forearm | 1 |
| Hand | 1 |
| Lesion categories | |
| Malignant osseous lesiona | 9 |
| Benign osseous lesionb | 10 |
| Soft-tissue lesionc | 4 |
| Osseous infectious / inflammatory processd | 13 |
| Soft-tissue infectious / inflammatory processe | 4 |
| Otherf | 4 |
Acute lymphoblastic leukemia (2), Ewing sarcoma (1), osteosarcoma (4), chondroblastoma (1), indeterminate malignancy (1).
Aneurysmal bone cyst (3), cortical desmoid (1), enchondroma (1), nonossifying fibroma (1), osteofibrous dysplasia (1), osteonecrosis (1), unicameral bone cyst (2).
Desmoid fibromatosis (3), intramuscular hemangioma (1).
Brodie’s abscess (2), chronic recurrent multifocal osteomyelitis (1), stress reaction (1), osteomyelitis (9).
Septic arthritis (1), soft-tissue infection (3).
Soft-tissue vascular/lymphatic malformation (2), fibro-adipose vascular anomaly (FAVA) (1).
There was no significant difference in ADC values between the DW-SD and DW-EPI sequences when measuring bone marrow, muscle, and lesions (P = 0.3, P = 0.2, and P = 0.27, respectively). Table 4 summarizes the ADC values of DW-SD and DW-EPI for normal bone marrow, normal muscle, and lesion. Many lesions did not exhibit restricted diffusion, resulting in a mean ADC value of 1390 ± 560 × 10−6 mm2/s (range 400–2620 × 10−6 mm2/s) for DW-SD and 1450 ± 680 × 10−6 mm2/s (range 120–3840 × 10−6 mm2/s) for DW-EPI. The overall COV for the reproducibility of ADC between the two diffusion methods was 14.8% (95% CI: 12.3%, 16.9%). Individual COV measurements can be seen in Table 4. Bias and limits of agreement for the Bland-Altman analysis (Fig. 1) were 29.5 (−329.5, 388.6) × 10−6 mm2/s, 46.9 (−401.2, 494.9) × 10−6 mm2/s, and 58.6 (−378.9, 496) × 10−6 mm2/s for bone marrow, normal muscle, and lesions, respectively. There was no corresponding proportional bias upon preforming regression analysis, R = −0.2 (P = 0.073), R = −0.12 (P = 0.18), and R = 0.03 (P = 0.87) for bone marrow, muscle, and target lesion, respectively.
TABLE 4.
ADC (×10−6 mm2/s) for Normal Anatomy and Lesions
| DW-SDa | DW-EPIa | P value | COV (%)b | |
|---|---|---|---|---|
| Bone Marrow | 840 ± 31 (310–1630) | 860 ± 780 (360–1510) | 0.3 | 18.4 (12.7–22.7) |
| Muscle | 1430 ± 243 (1000–1980) | 1480 ± 205 (1030–1970) | 0.2 | 11.1 (8.9–12.8) |
| Lesions | 1390 ± 560 (400–2620) | 1450 ± 680 (120–3840) | 0.27 | 14 (10.5–16.8) |
| Overall | 14.8 (12.3–16.9) |
ADC = apparent diffusion coefficient; DW-SD = diffusion weighted: near silent and distortion-free; DW-EPI = diffusion weighted: echo planar imaging; COV = coefficient of variation.
Data shown as mean ± standard deviation (range).
Coefficient of variation from duplicate measurements using logarithmic method, 95% confidence interval in parenthesis.
FIGURE 1:
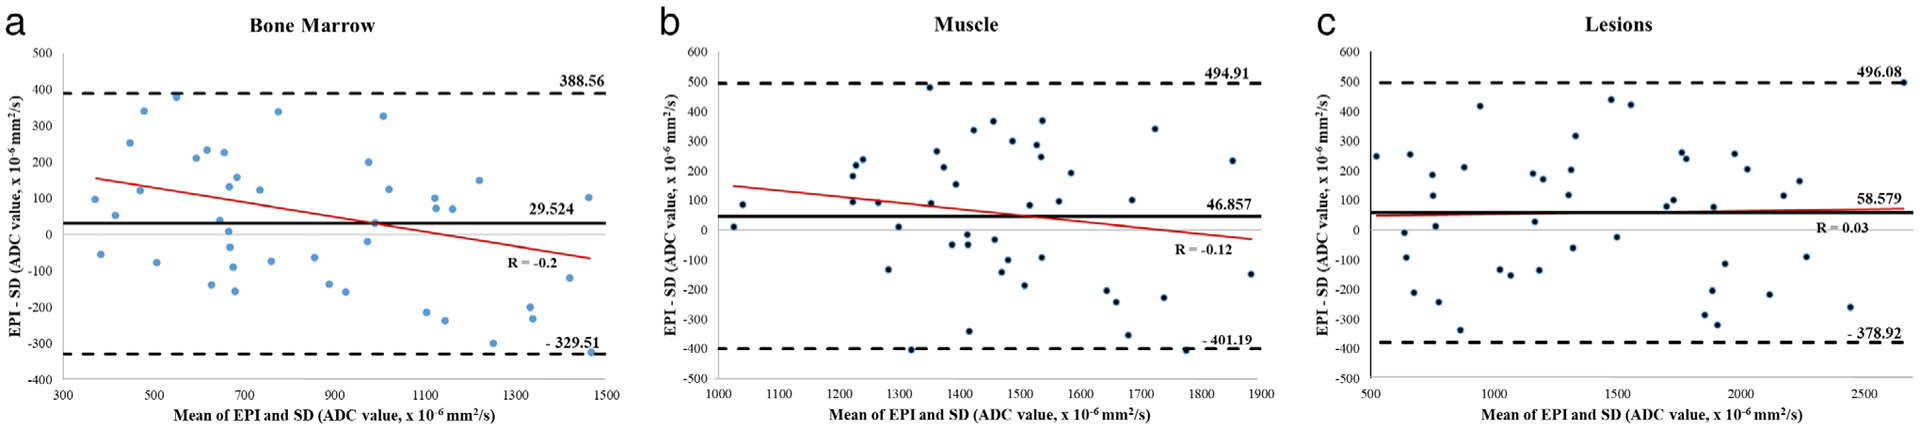
Bland-Altman analysis for ADC distribution in (a) bone marrow, (b) muscle, and (c) lesions. Although there is a negative trend on regression analysis (solid red lines) for bone marrow and muscle, there was no significant proportional bias (P-values 0.074 and 0.18, respectively). SD, near-silent and distortion-free; EPI, echo planar imaging; ADC, apparent diffusion coefficient.
Figure 2a shows the distribution of Sanat ratings for DW-SD for all readers. For reader 1, the predominance of anatomical structures was rated diagnostic or better (score = 3 +), 98% (CI: 93–100%) of bone marrow, 95% (CI: 83–100%) of muscle, and 91% (CI: 64–100%) of soft tissues cases. Cartilage delineation was more limited, rated diagnostic or better in 17% (CI: 0–64%) of cases. There were two cases in which a joint was not included in the FOV. Apart from cartilage, the most frequent rating given for all anatomic structures was “good”; 20–23 cases for reader 1, 17–21 cases for reader 2, and 15–19 cases out of 43 for reader 3. Inter-observer agreement was moderate to strong; 0.77, 0.79, 0.59, and 0.45 for bone marrow, muscle, soft tissues, and cartilage, respectively.
FIGURE 2:
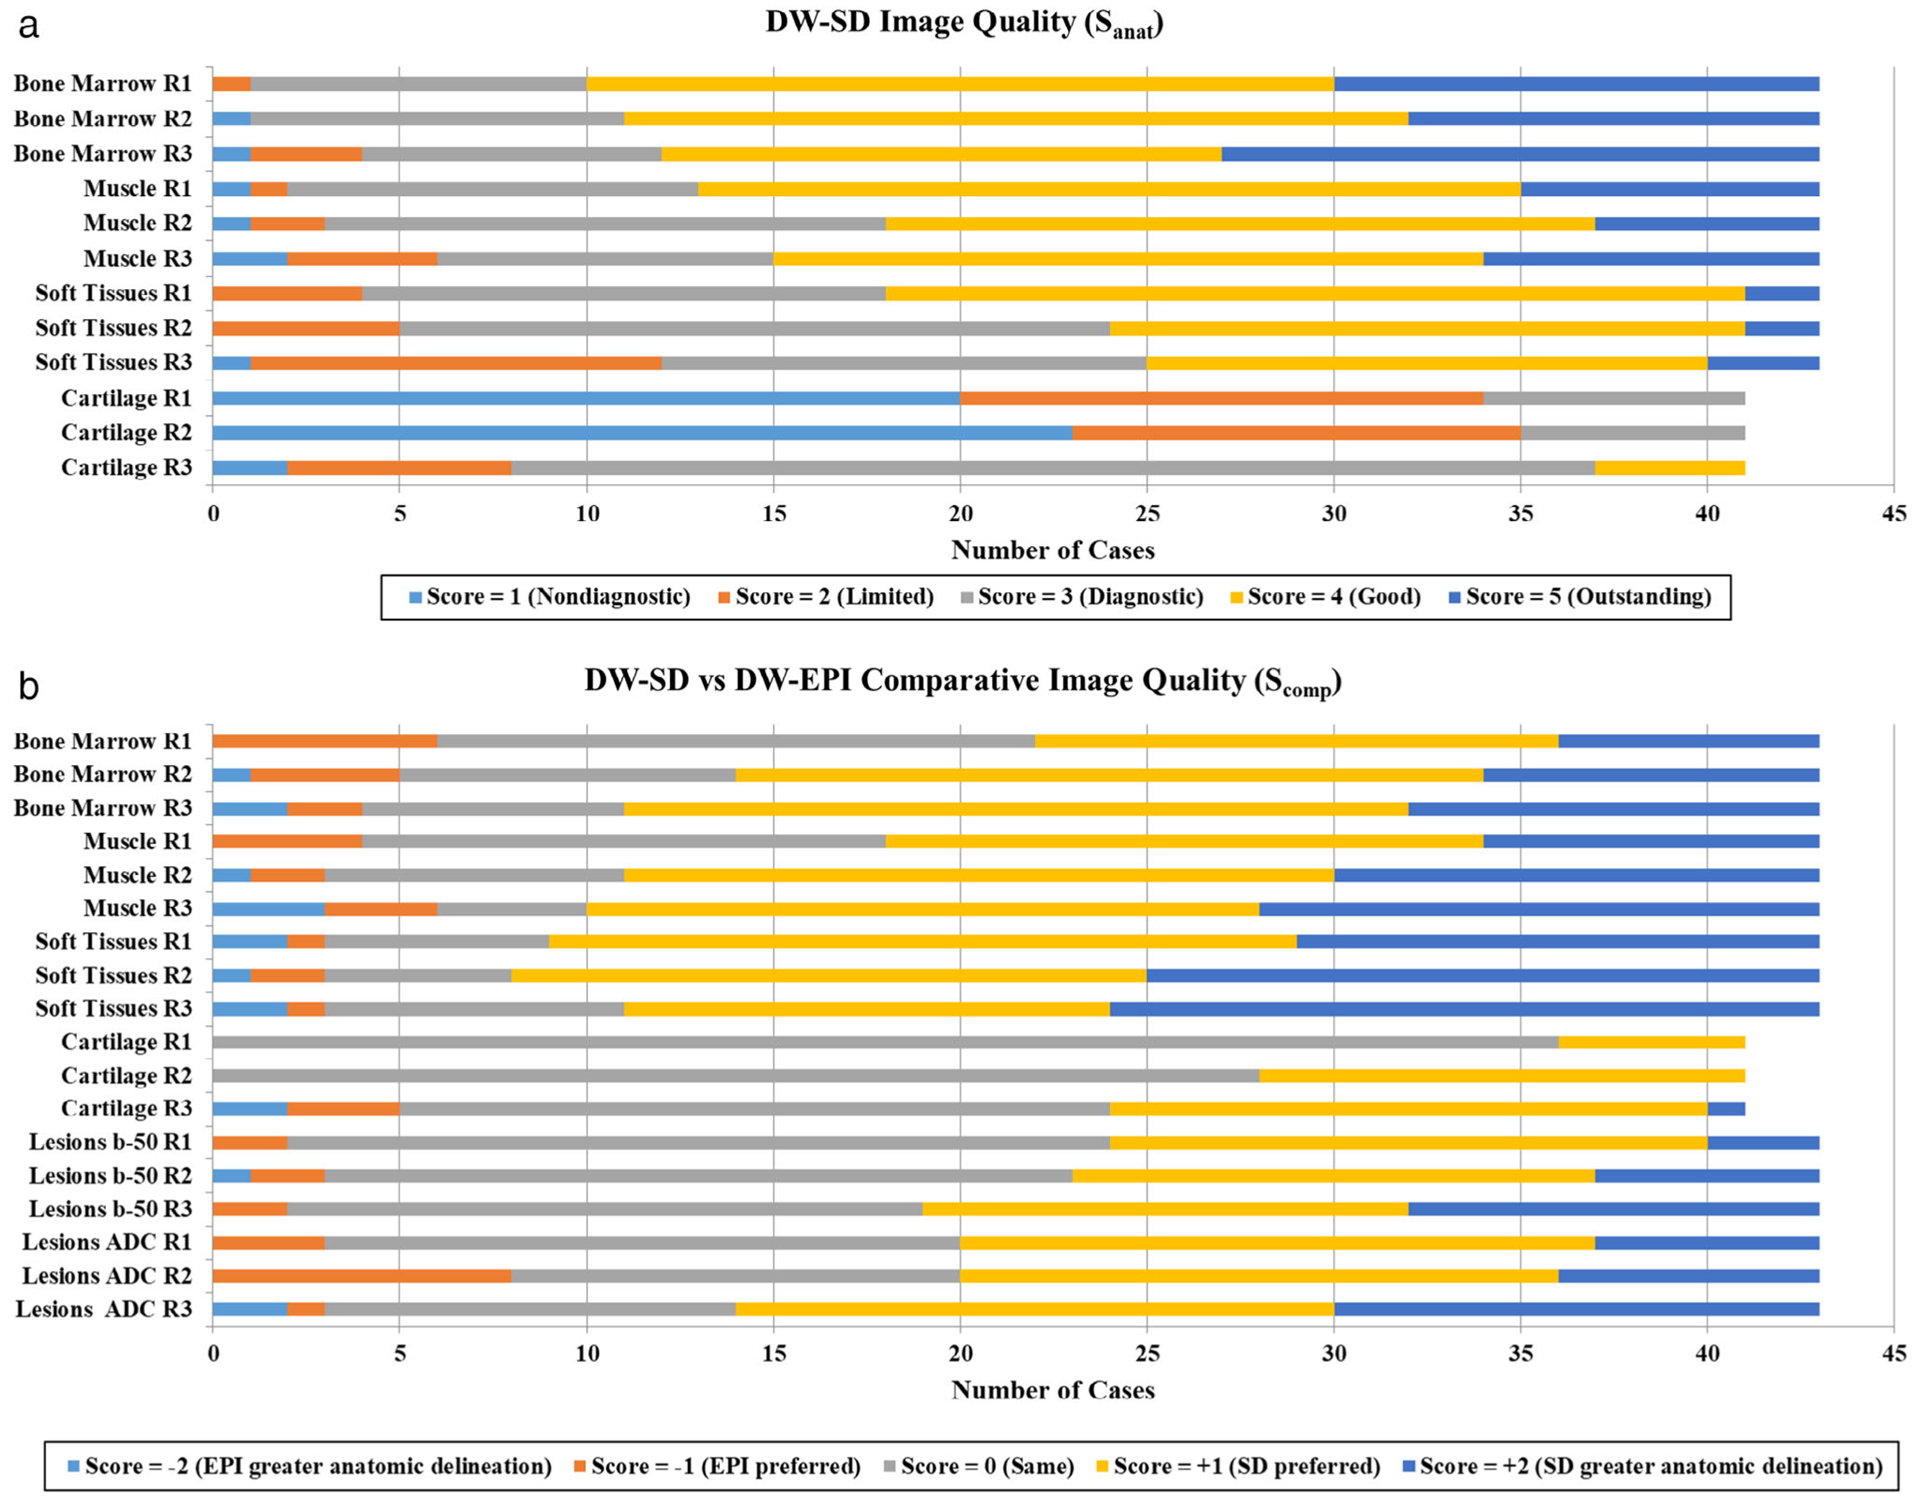
Frequency of scores for each anatomic structure for (a) DW-SD image quality (Sanat), and (b) comparative image quality (Scomp) between DW-SD and conventional DW-EPI. (a) Besides cartilage, note the higher proportion of scores rated 3+ for DW-SD image quality. (b) DW-SD was rated equivalent to or better than DW-EPI in most of the cases. Of note, two cases did not span a joint, and thus were excluded from cartilage evaluation. R1, reader 1; R2, reader 2; R3, reader 3; SD, near-silent and distortion-free; EPI, echo planar imaging.
Figure 2b shows the range of all readers’ Scomp ratings, with the predominance of scores reflecting either no difference or DW-SD preferred over DW-EPI. DW-SD was rated significantly better (P < 0.05) than DW-EPI for all readers across all anatomic and disease process variables (Table 5). Between the readers, DW-SD was preferred or better (score of +1 or +2) over DW-EPI in muscle and soft tissues 58–77% and 74–81%, respectively. For bone marrow, DW-SD and DW-EPI were equally preferred in 16–37% and DW-SD preferred or better in 49–74% of cases. For lesions, DW-SD and DW-EPI were equally preferred in 40–51%, with DW-SD preferred or better in 44–56% of cases. Across all variables, CIOP (score 0, +1 or +2) for reader 1 ranged from 86–100%, for reader 2 ranged from 81–100%, and reader 3 ranged from 86–95% (Table 5). There was moderate to near perfect agreement among the readers (ICC range = 0.64–0.88).
TABLE 5.
ICC and CIOP and Wilcoxon P-value for Scomp Analysis (DW-SD vs. DW-EPI)
| Bone marrow | Muscle | Soft tissues | Cartilage | Lesion: b-50 | Lesion: ADC | |
|---|---|---|---|---|---|---|
| ICCa | 0.71 (0.47–0.84) | 0.75 (0.53–0.86) | 0.85 (0.72–0.92) | 0.64 (0.3–0.81) | 0.75 (0.53–0.86) | 0.77 (0.87–0.63) |
| R1: CIOPa,c (%) | 86 (76–96) | 91 (73–100) | 93 (7–100) | 100 (100–100) | 95 (67–100) | 93 (47–100) |
| R1: P-valueb | 0.001 | <0.001 | <0.001 | 0.025 | <0.001 | <0.001 |
| R2: CIOPa,c (%) | 88 (74–100) | 93 (74–100) | 93 (66–100) | 100 (100–100) | 93 (54–100) | 81 (4–100) |
| R2: P-valueb | <0.001 | <0.001 | <0.001 | <0.001 | 0.001 | <0.001 |
| R3: CIOPa,c (%) | 91 (73–100) | 86 (49–100) | 93 (54–100) | 88 (22–100) | 95 (60–100) | 93 (39–100) |
| R3: P-valueb | <0.001 | <0.001 | <0.001 | <0.001 | <0.001 | <0.001 |
ICC = intraclass correlation; CIOP = confidence interval of proportions; R1 = reader 1; R2 = reader 2; R3 = reader 3; DW-SD = diffusion weighted: near silent and distortion-free; DW-EPI = diffusion weighted: echo planar imaging.
95% confidence interval in parentheses.
Wilcoxon rank-sum test.
CIOP: The proportion of cases with a score of diagnostic or better (score = 3, 4, or 5).
Figures 3–7 show representative patient data.
FIGURE 3:
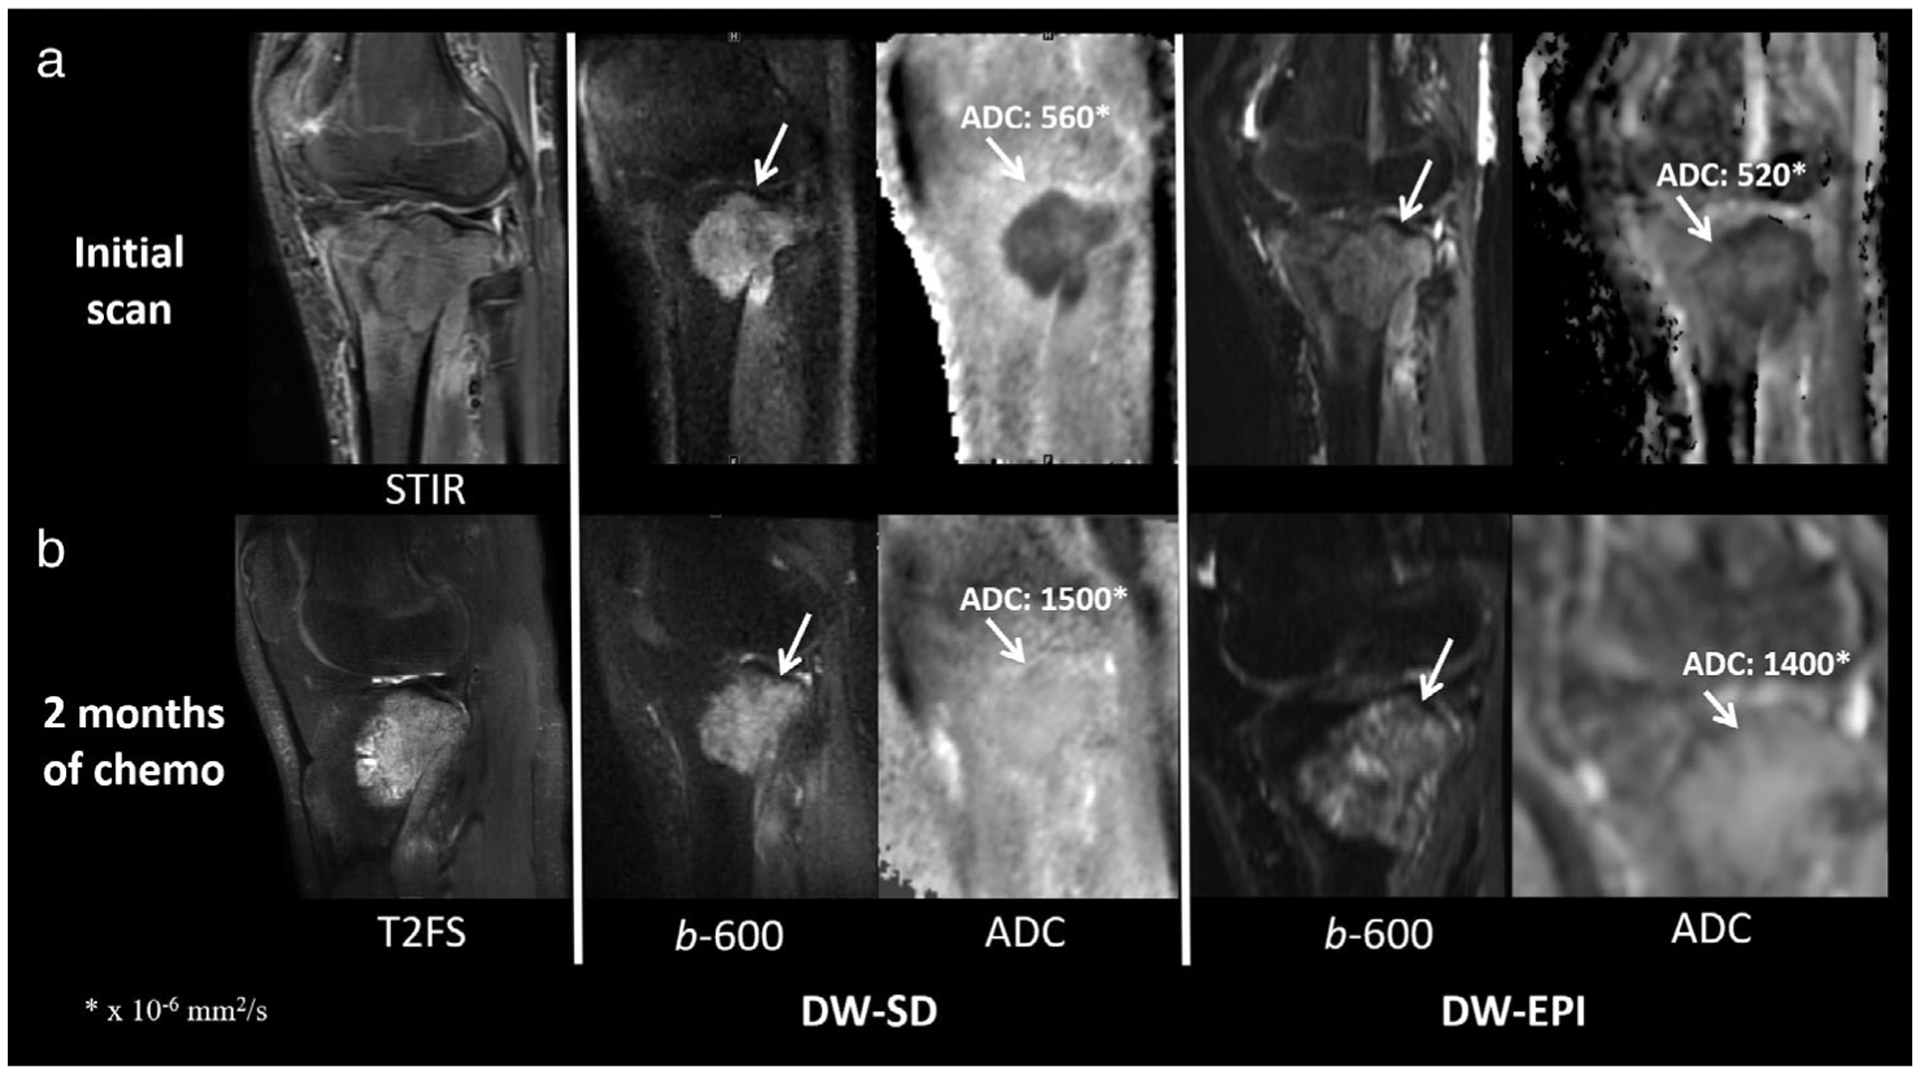
A 17-year-old boy patient with right proximal tibial osteosarcoma (white arrow) at initial presentation (a) and 2 months after chemotherapy (b). The mean ADC value was similar for DW-SD to that of the standard DW-EPI sequence. (a) Sanat for readers 1/2/3 for bone marrow, muscle, soft tissues, and cartilage was 4/4/4, 4/3/3, 4/4/2, and 1/1/2, respectively. Scomp for readers 1/2/3 for bone marrow, muscle, soft tissues, cartilage, lesion b-50 s/mm2 and lesion ADC was 0/0/2, 1/0/1, 1/0/1, 0/0/0, 1/1/0, and 1/0/2, respectively. Of note, the scan was performed in a sagittal plane relative to magnet, not patient anatomy. ADC, apparent diffusion coefficient; STIR, short-TI inversion recovery; T2FS, T2-weighted fat-suppressed image.
FIGURE 7:
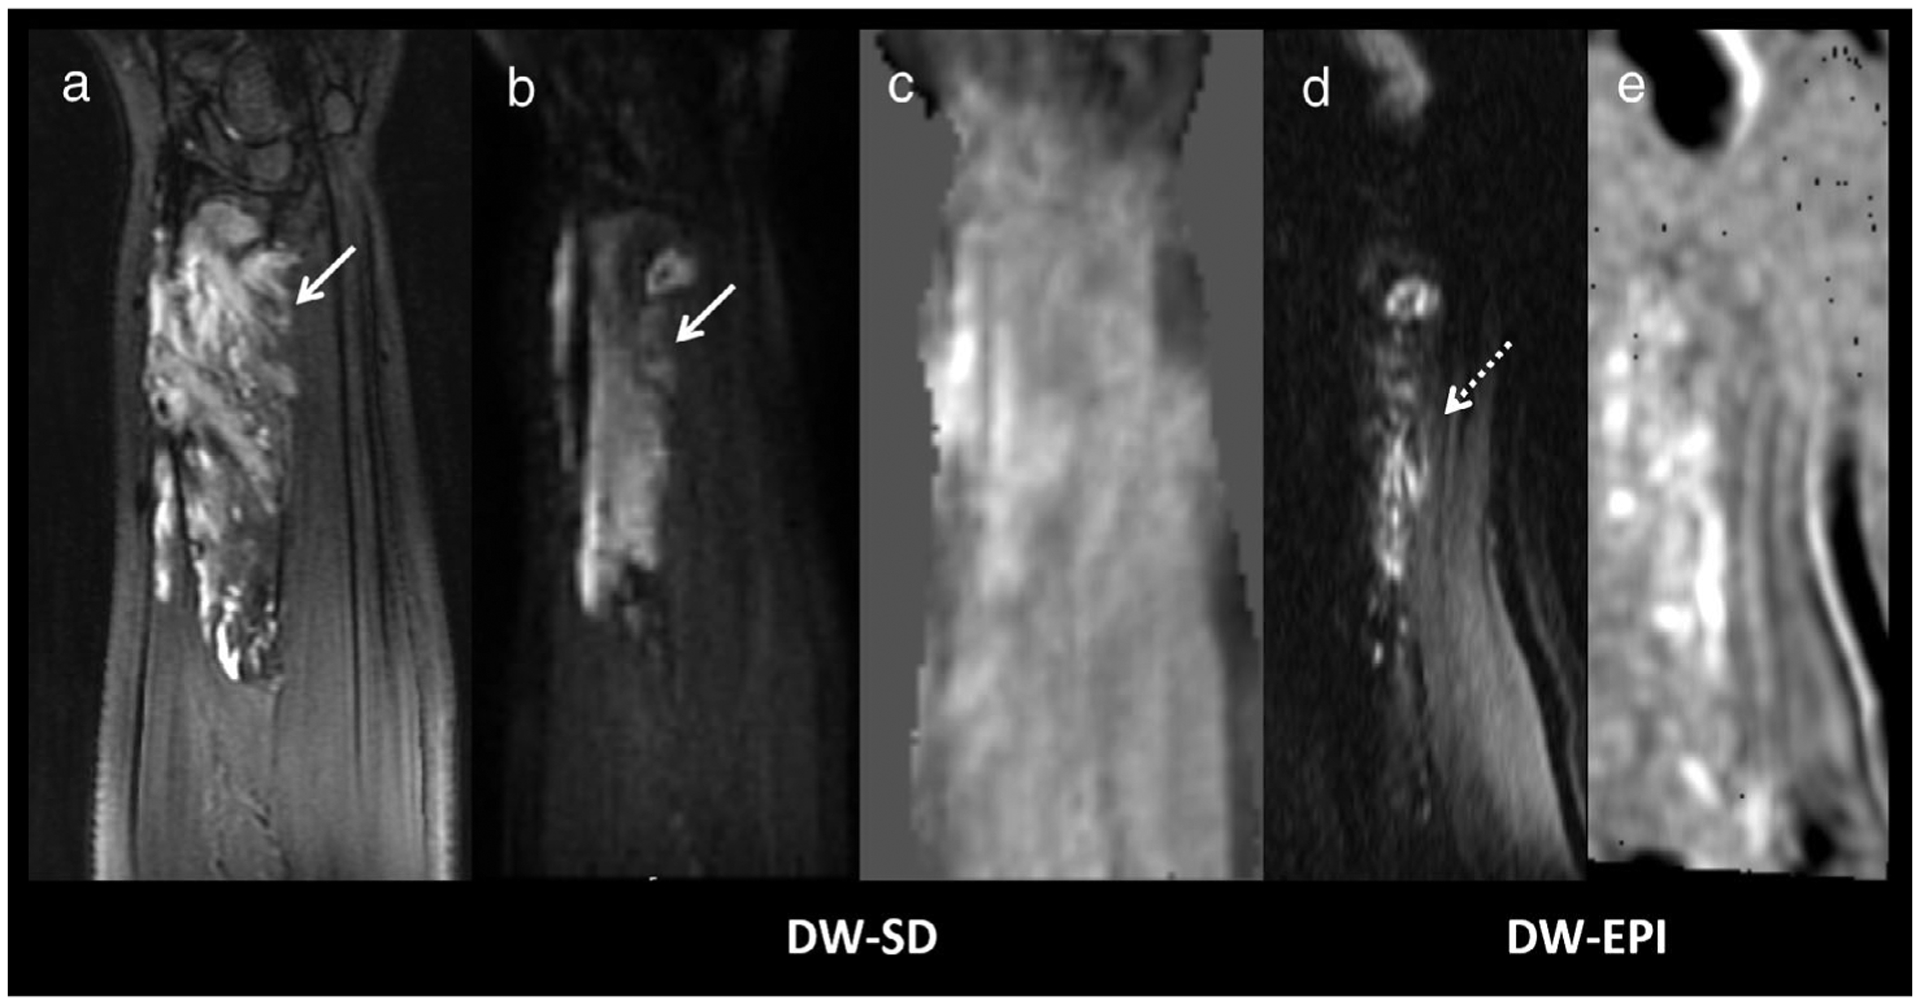
A 12-year-old girl with right forearm venolymphatic malformation. (a) Coronal T2FS of the forearm shows a hyperintense soft-tissue lesion. (b) Although the lesion was hyperintense on the DW-SD b = 50 s/mm2 image (white arrow), (c) there was no increased diffusion on the ADC map. The anatomy was heavily distorted on DW-EPI, (d) hyperintense signal was seen on the b = 50 s/mm2 image but anatomy cannot be confidently discerned (e) on the ADC map, and thus was rated as nondiagnostic. Sanat for readers 1/2/3 for bone marrow, muscle, soft tissues, and cartilage was 3/3/3, 4/3/4, 4/3/3, and 1/1/2, respectively. Scomp for readers 1/2/3 for bone marrow, muscle, soft tissues, cartilage, lesion b = 50 s/mm2 and lesion ADC was 2/2/1, 2/2/2, 2/2/2, 0/1/1, 2/2/2, and 2/2/1, respectively. DW-SD, diffusion weighted: near silent and distortion-free; DW-EPI, diffusion weighted: echo planar imaging; ADC, apparent diffusion coefficient; T2FS, T2-weighted fat suppressed image.
Discussion
Two common problems in traditional clinical DW-EPI are high acoustic noise and geometric distortion. Imaging with a reduced field of view reduces distortion, and has found applications in spine and prostate imaging, but distortion remains challenging in areas of greater field inhomogeneity. To reduce scanning noise, “soft gradients” utilizing sinusoidal preparation pulses have been explored.8,9 To reduce image distortion, the proposed methods have included a multishot interleaved EPI with navigation and other non-EPI acquisition sequences.18,19 The DW-SD sequence uses a modified sinusoidal bipolar gradient that both reduces acoustic noise and eddy currents. The sequence has previously been shown to significantly reduce image noise to near ambient idle MRI levels.25 Finally, the use of a multisegmented center-out radial sampling of k-space using RUFIS enables reconstruction of nondistorted images.
In our cohort of 43 pediatric extremity cases, the image quality of DW-SD was not inferior to that of conventional DW-EPI. Basic anatomic structures were largely visualized on DW-SD equally or better than on conventional DW-EPI, with DW-SD more often preferred in soft tissues. The few cases in which DW-SD anatomy were not as well delineated when compared to conventional DW-EPI either occurred in larger patients and/or those with excessive patient motion. There was also some variation in image quality, which could be at least partially explained by the different processing algorithms used. First, the ADC map from the conventional DW-EPI is generated by a standard vendor-implemented ADC processing algorithm that uses a 3×3 pixel convolution kernel resulting in a smoother and less noisy image, while DW-SD does not. Second, as large FOV increases image distortion in DW-EPI acquisitions, a vendor-available algorithm utilizing inner volume excitation with two perpendicularly applied RF pulses (FOCUS) allowing for a smaller FOV and thus decreased distortion is routinely performed at our institution.
There was no statistically significant difference in ADC measurements between DW-SD and DW-EPI when measuring bone marrow, muscle, and lesions. The COV of ADC measurement between DW-SD and DW-EPI was similar to a prior publication in which the COV was calculated by repeating the same DW-EPI acquisition.29 Bone marrow COV was higher than muscle and target lesion, and may be explained by bone marrow’s inherent lower water signal. Bland-Altman analysis demonstrated a small positive bias for bone marrow, muscle, and lesions corresponding to DW-EPI ADC measuring slightly higher than DW-SD. However, the small degree of bias is unlikely to impact assessment of whether a target region is or is not restricting diffusion. Despite there being a negative trend for bone marrow and muscle, no significant proportional bias was identified.
Lesions were visualized on all cases using DW-SD. There was no statistically significant difference in ADC measurements between DW-SD and DW-EPI. The single case in which the target lesion and anatomy had greater delineation on DW-EPI (intramuscular hemangioma of the right biceps in a 10-year-old male) was attributed to motion artifact from a nonsedated partially cooperative patient. Conversely, an isolated case of a venolymphatic malformation of the forearm could not be confidently identified on the DW-EPI sequence due to marked geometric distortion; however, it was visualized and measured on the DW-SD sequence. Thus, the absence of geometric distortion of DW-SD has a potential to be more advantageous in the evaluation of disease processes in areas of the body with smaller anatomy or more air-tissue interfaces (eg, hands and feet).
Limitations
The long scan time of DW-SD is a limitation, requiring ~5 minutes to run two b-values, as each b-value requires four phase cycles. In comparison, DW-EPI only takes 2 minutes to run both b-values. DW-SD is thus more susceptible to patient and physiologic motion, especially since any variation in the different phase cycle repetitions will bring error to the final reconstructed image. However, in the clinical context of extremity imaging, physiologic motion is less of an issue, and in our experience, the use of a small extremity coil limits movement. When applying this sequence to other parts of the body (eg, brain), it has been shown that random pulsatile brain motion from blood vessels results in decreased image quality.25 There are other specific factors contributing to scan time, such as matrix-size and spokes-per-segment; thus, it is also a tradeoff between longer-scan times and increased spatial resolution. Given this limitation, the spatial resolution set for the DW-SD sequence was found to be inadequate to confidently assess cartilage.
In some cases, the DW-SD images exhibited peripheral soft-tissue signal heterogeneity, more so on the higher b-values, potentially resulting in incorrect ADC measurements. This can be the result of magnetic field inhomogeneity at air-tissue interfaces. Methods to possibly limit B0 and B1 inhomogeneity include using adiabatic refocusing pulses21 or double refocusing pulses.21,30
Another limitation in this sequence is decreased robustness at higher b-values (>1000 s/mm2) due to phase incoherence from using only two segments to acquire the center of k-space.25 Although this would be a limitation in regions of the body such as the brain, lower b-values (ie, 600 s/mm2) are typically used in musculoskeletal imaging.31
Finally, study design limitations include small sample size, nonstandardized imaging location, and inclusion of varied clinical conditions (heterogeneous disorders and body parts were scanned).
Conclusion
The results of our study demonstrated that a near-silent, distortion-free diffusion sequence (DW-SD) applied in pediatric extremity soft-tissue and bone imaging indications provides similar ADC measurements and potentially improved delineation of lesions, muscles, and other soft tissues when compared to a conventional 2D EPI diffusion (DW-EPI) sequence.
FIGURE 4:
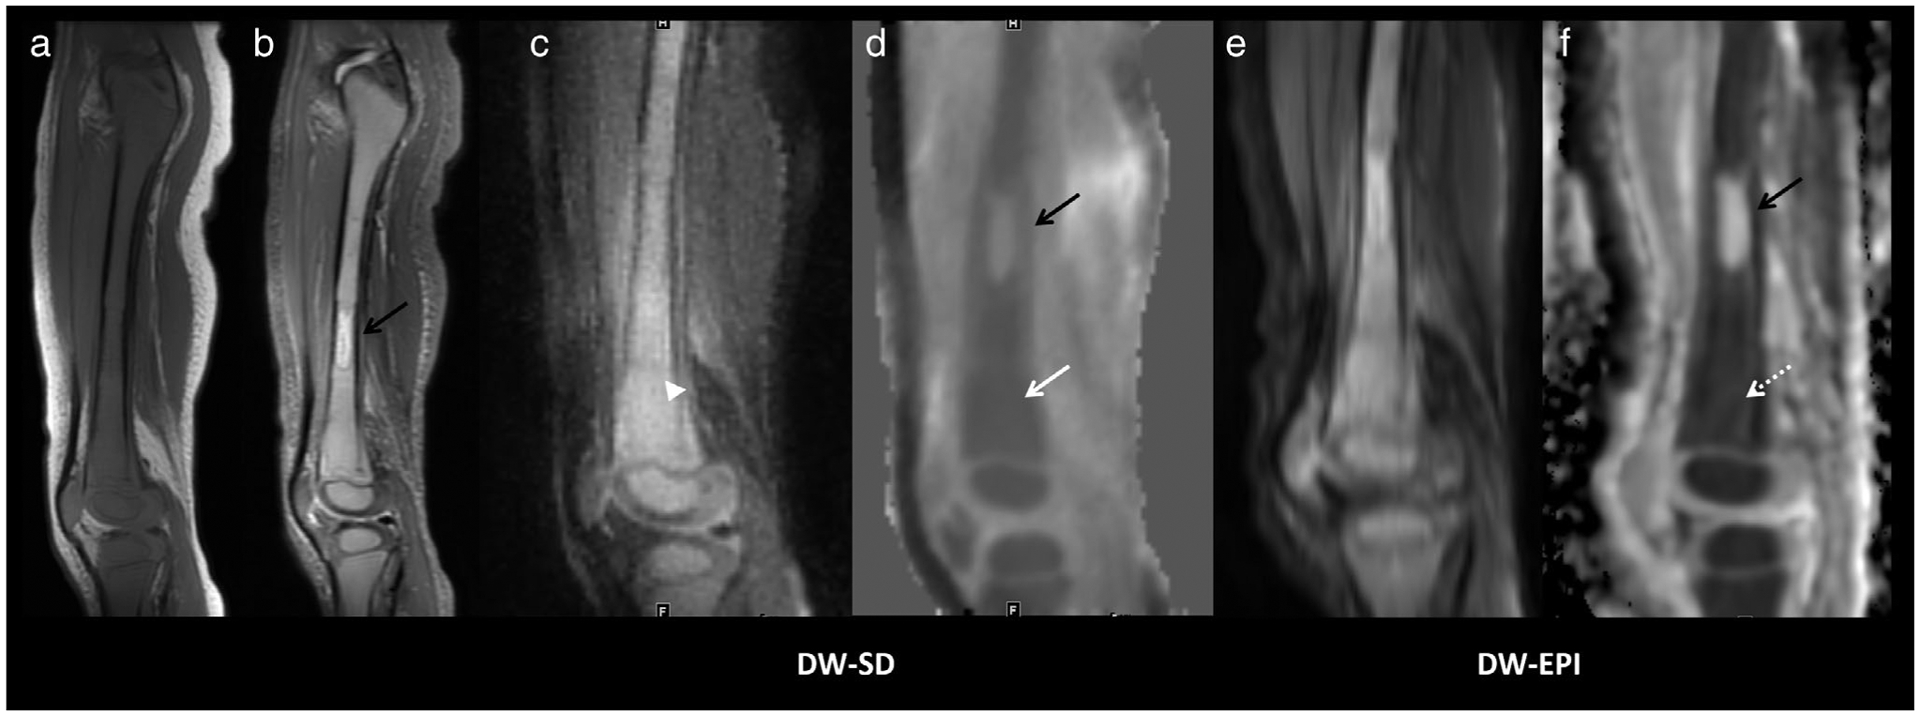
A 2-year-old boy presenting with right knee pain and found to have pre-B-ALL. Sagittal T1 (a) and STIR (b) images show diffuse marrow replacement with T1 hypointensity relative to muscle and increased signal intensity on STIR. (c) DW-SD in a sagittal plane on the b = 50 s/mm2 image shows apparent increased diffusion restriction (white arrowhead). (d) The ADC map shows diffuse decreased ADC of 480 × 10−6 mm2/s (solid white arrow). Increased geometric distortion is seen on DW-EPI, (e,f) but with similar ADC =500 × 10−6 mm2/s (dashed white arrow). Sanat for readers 1/2/3 for bone marrow, muscle, soft tissues, and cartilage was 5/4/5, 5/4/5, 4/5/5, and 2/2/4, respectively. Scomp for readers 1/2/3 for bone marrow, muscle, soft tissues, cartilage, lesion b = 50 s/mm2 and lesion ADC was 1/1/2, 0/1/2, 1/1/2, 1/1/1, 1/1/1, 1/1/2, respectively. Of note, the T2 hyperintense diaphyseal lesion (solid black arrow) does not restrict diffusion and was thought to represent spared red marrow; the lesion was not visualized on follow-up imaging. Pre-B-ALL, pre B-cell acute lymphoblastic leukemia; STIR, short-TI inversion recovery; T1, T1-weighted image; ADC, apparent diffusion coefficient.
FIGURE 5:
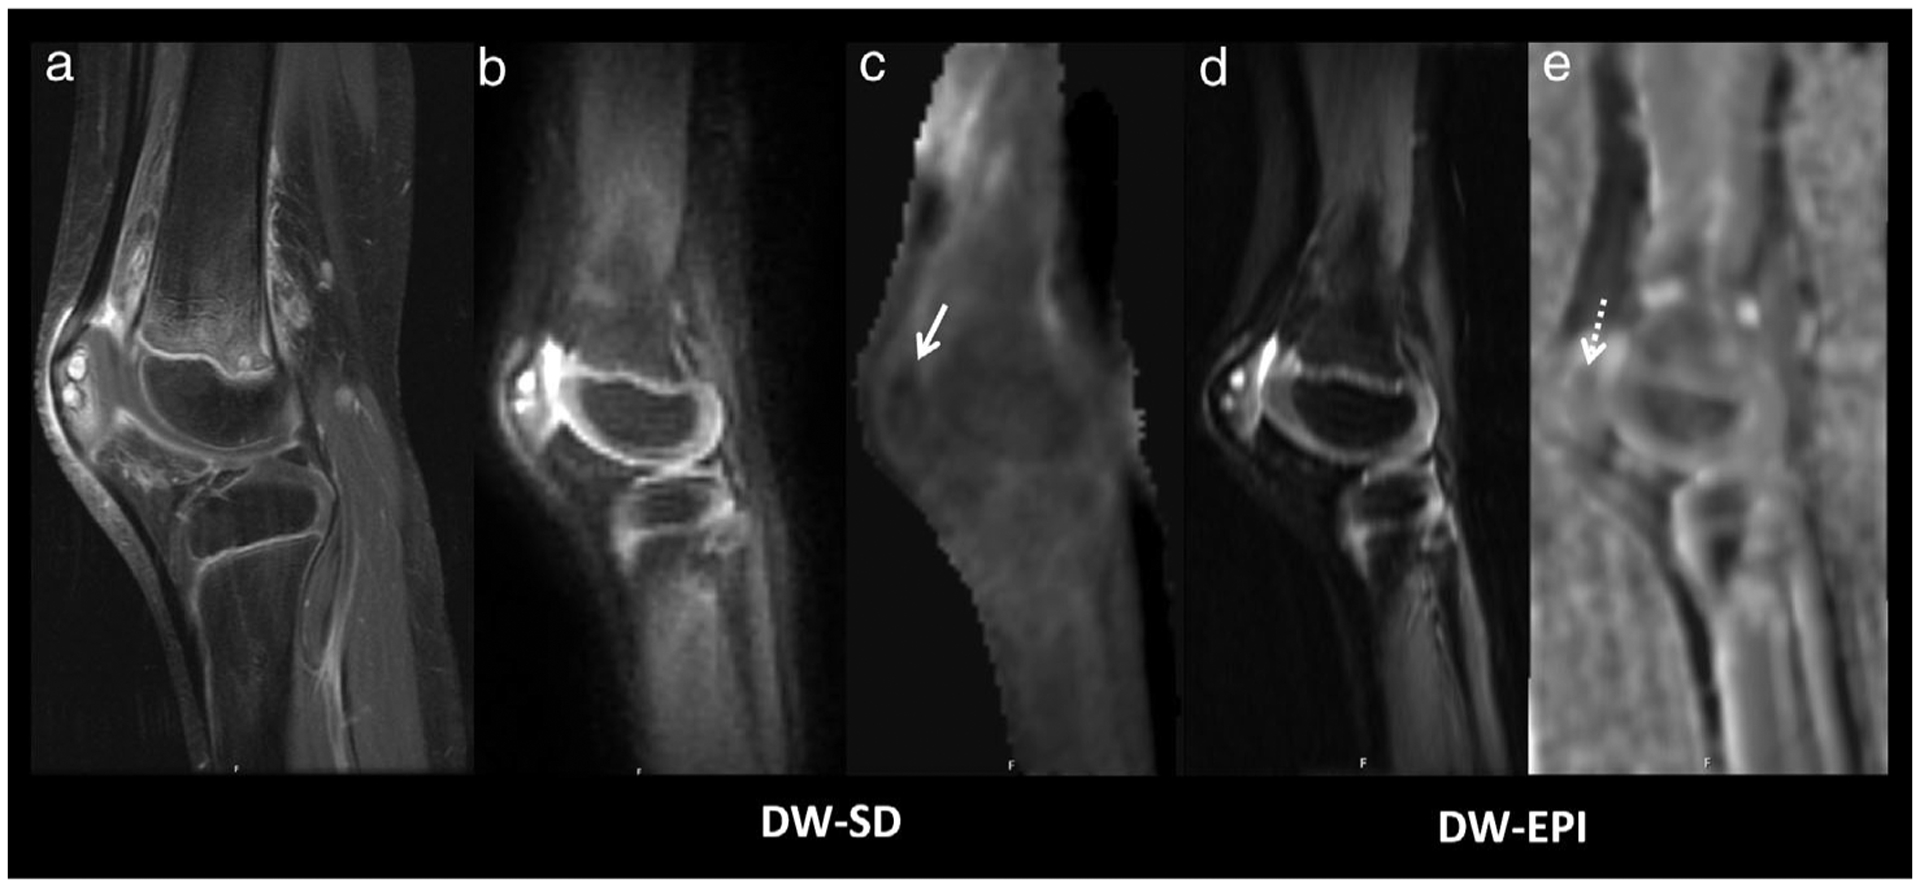
A 5-year-old girl with left knee pain and decreased motility, diagnosed with chronic recurrent multifocal osteomyelitis. (a) Multiple enhancing foci in the patella are visualized on the sagittal T1-weighted fat-saturated postcontrast image. (b) b = 50 s/mm2 and (c) ADC DW-SD images and (d) b = 50 s/mm2 and (e) ADC DW-EPI images show similar increased signal on the b = 50 s/mm2 images and decreased ADC, DW-SD ADC = 550 × 10−6 mm2/s (solid white arrow) and DW-EPI ADC = 600 × 10−6 mm2/s (dashed white arrow). DW-EPI shows increased distortion but remains diagnostic. Sanat for readers 1/2/3 for bone marrow, muscle, soft tissues, and cartilage was 5/5/5, 5/5/5, 4/3/4, and 3/2/3, respectively. Scomp for readers 1/2/3 for bone marrow, muscle, soft tissues, cartilage, lesion b = 50 s/mm2 and lesion ADC was 0/1/1, 1/2/2, 2/2/1, 1/1/1, 0/0/0, and 1/1/1, respectively. DW-SD, diffusion weighted: near silent and distortion-free; DW-EPI, diffusion weighted: echo planar imaging; ADC, apparent diffusion coefficient.
FIGURE 6:
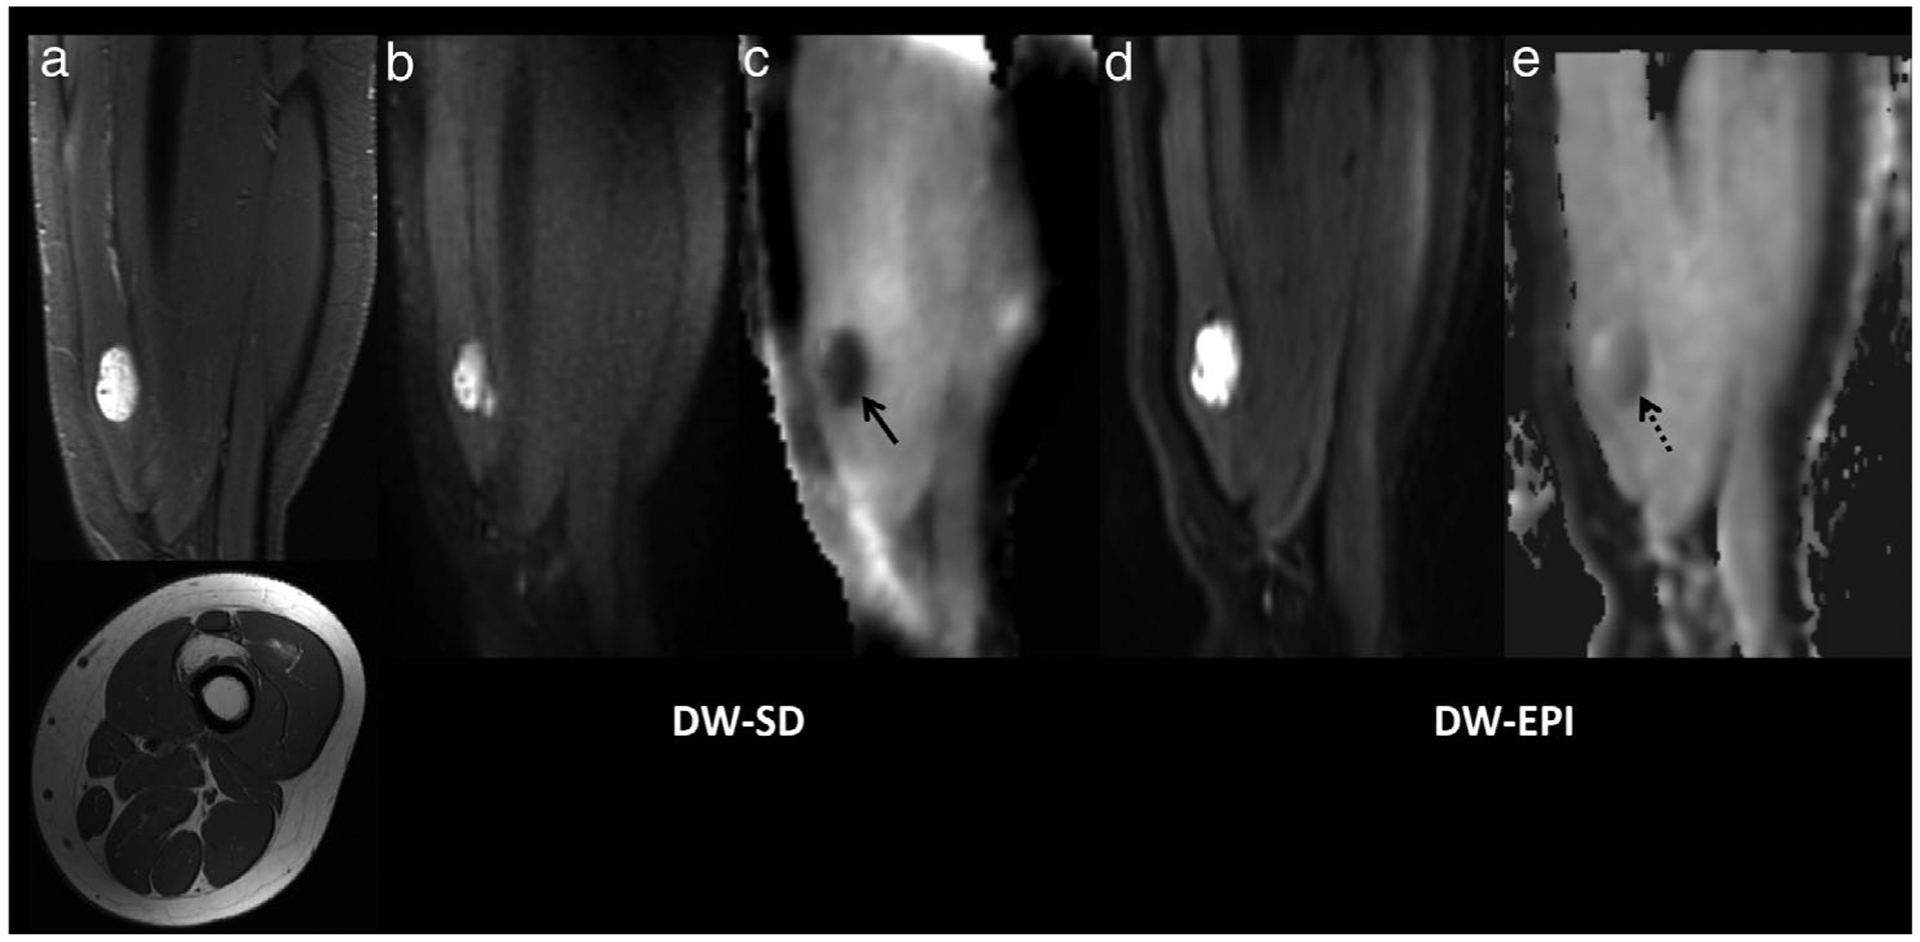
Fibro-adipose vascular anomaly (FAVA) in the left anterior thigh in a 15-year-old girl. (a) Sagittal STIR (upper) and axial T1-weighted (lower) images centered in the lower thigh show an irregular, fatty, and water-sensitive lesion centered in the vastus intermedius muscle. The lesion demonstrated restricted diffusion (b) on the DW-SD b = 50 s/mm2 image with a low ADC (c) with ADC = 520 × 10−6 mm2/s (solid black arrow). The lesion is also seen on the DW-EPI (d) b = 50 s/mm2 image, and (e) ADC map with an ADC of 640 × 10−6 mm2/s (dashed black arrow). Sanat for readers 1/2/3 for bone marrow, muscle, soft tissues, and cartilage was 5/5/4, 5/4/5, 4/4/4, and 2/2/2, respectively. Scomp for readers 1/2/3 for bone marrow, muscle, soft tissues, cartilage, lesion b = 50 s/mm2 and lesion ADC was 1/1/0, 1/1/2, 2/2/1, 0/0/0, 0/0/0, and 1/1/1, respectively. STIR, short-TI inversion recovery; DW-SD, diffusion weighted: near silent and distortion-free; DW-EPI, diffusion weighted: echo planar imaging; ADC, apparent diffusion coefficient.
Acknowledgments
Contract grant sponsor: GE Healthcare and National Institutes of Health; Contract grant numbers: R01 EB009690, R01 EB026136, and R01 HL136965).
REFERENCES
- 1.Bhojwani N, Szpakowski P, Partovi S, et al. Diffusion-weighted imaging in musculoskeletal radiology-clinical applications and future directions. Quant Imaging Med Surg 2015;5(5):740–753. [DOI] [PMC free article] [PubMed] [Google Scholar]
- 2.Subhawong TK, Jacobs MA, Fayad LM. Diffusion-weighted MR imaging for characterizing musculoskeletal lesions. Radiographics 2014;34(5): 1163–1177. [DOI] [PMC free article] [PubMed] [Google Scholar]
- 3.Delin C, Silvera S, Coste J, et al. Reliability and diagnostic accuracy of qualitative evaluation of diffusion-weighted MRI combined with conventional MRI in differentiating between complete and partial anterior cruciate ligament tears. Eur Radiol 2013;23(3):845–854. [DOI] [PubMed] [Google Scholar]
- 4.MacKenzie JD, Gonzalez L, Hernandez A, Ruppert K, Jaramillo D. Diffusion-weighted and diffusion tensor imaging for pediatric musculoskeletal disorders. Pediatr Radiol 2007;37(8):781–788. [DOI] [PubMed] [Google Scholar]
- 5.Neubauer H, Evangelista L, Hassold N, et al. Diffusion-weighted MRI for detection and differentiation of musculoskeletal tumorous and tumor-like lesions in pediatric patients. World J Pediatr 2012;8(4): 342–349. [DOI] [PubMed] [Google Scholar]
- 6.Miyati T, Banno T, Fujita H, et al. Acoustic noise analysis in echo planar imaging: Multicenter trial and comparison with other pulse sequences. IEEE Trans Med Imaging 1999;18(8):733–736. [DOI] [PubMed] [Google Scholar]
- 7.Le Bihan D, Poupon C, Amadon A, Lethimonnier F. Artifacts and pitfalls in diffusion MRI. J Magn Reson Imaging 2006;24(3):478–488. [DOI] [PubMed] [Google Scholar]
- 8.Rösch J, Ott M, Heismann B, et al. Quiet diffusion-weighted head scanning: Initial clinical evaluation in ischemic stroke patients at 1.5T. J Magn Reson Imaging 2016;44(5):1238–1243. [DOI] [PubMed] [Google Scholar]
- 9.Hennel F, Girard F, Loenneker T. “Silent” MRI with soft gradient pulses. Magn Reson Med 1999;42(1):6–10. [DOI] [PubMed] [Google Scholar]
- 10.Edelstein WA, Hedeen RA, Mallozzi RP, El-Hamamsy SA, Ackermann RA, Havens TJ. Making MRI quieter. Magn Reson Imaging 2002;20(2):155–163. [DOI] [PubMed] [Google Scholar]
- 11.Hutter J, Price AN, Cordero-Grande L, et al. Quiet echo planar imaging for functional and diffusion MRI. Magn Reson Med 2018;79(3):1447–1459. [DOI] [PMC free article] [PubMed] [Google Scholar]
- 12.Porter DA, Heidemann RM. High resolution diffusion-weighted imaging using readout-segmented echo-planar imaging, parallel imaging and a two-dimensional navigator-based reacquisition. Magn Reson Med 2009;62(2):468–475. [DOI] [PubMed] [Google Scholar]
- 13.Chen NK, Guidon A, Chang HC, Song AW. A robust multi-shot scan strategy for high-resolution diffusion weighted MRI enabled by multiplexed sensitivity-encoding (MUSE). Neuroimage 2013;72:41–47. [DOI] [PMC free article] [PubMed] [Google Scholar]
- 14.Dong Z, Wang F, Reese TG, et al. Tilted-CAIPI for highly accelerated distortion-free EPI with point spread function (PSF) encoding. Magn Reson Med 2019;81(1):377–392. [DOI] [PMC free article] [PubMed] [Google Scholar]
- 15.Butts K, de Crespigny A, Pauly JM, Moseley M. Diffusion-weighted interleaved echo-planar imaging with a pair of orthogonal navigator echoes. Magn Reson Med 1996;35(5):763–770. [DOI] [PubMed] [Google Scholar]
- 16.Hu Y, Levine EG, Tian Q, et al. Motion-robust reconstruction of multishot diffusion-weighted images without phase estimation through locally low-rank regularization. Magn Reson Med 2019;81(2):1181–1190. [DOI] [PMC free article] [PubMed] [Google Scholar]
- 17.Mani M, Jacob M, Kelley D, Magnotta V. Multi-shot sensitivity-encoded diffusion data recovery using structured low-rank matrix completion (MUSSELS). Magn Reson Med 2017;78(2):494–507. [DOI] [PMC free article] [PubMed] [Google Scholar]
- 18.Zhang Q, Coolen BF, Versluis MJ, Strijkers GJ, Nederveen AJ. Diffusion-prepared stimulated-echo turbo spin echo (DPsti-TSE): An eddy current-insensitive sequence for three-dimensional high-resolution and undistorted diffusion-weighted imaging. NMR Biomed 2017;30(7). doi: 10.1002/nbm.3719. [DOI] [PubMed] [Google Scholar]
- 19.Xie Y, Yu W, Fan Z, et al. High resolution 3D diffusion cardiovascular magnetic resonance of carotid vessel wall to detect lipid core without contrast media. J Cardiovasc Magn Reson 2014;16(1):67. [DOI] [PMC free article] [PubMed] [Google Scholar]
- 20.Jeong EK, Kim SE, Parker DL. High-resolution diffusion-weighted 3D MRI, using diffusion-weighted driven-equilibrium (DW-DE) and multishot segmented 3D-SSFP without navigator echoes. Magn Reson Med 2003;50(4):821–829. [DOI] [PubMed] [Google Scholar]
- 21.Yamashita K, Yoshiura T, Hiwatashi A, et al. High-resolution three-dimensional diffusion-weighted imaging of middle ear cholesteatoma at 3.0 T MRI: Usefulness of 3D turbo field-echo with diffusion-sensitized driven-equilibrium preparation (TFE-DSDE) compared to single-shot echo-planar imaging. Eur J Radiol 2013;82(9):e471–e475. [DOI] [PubMed] [Google Scholar]
- 22.Numano T, Homma K, Hirose T. Diffusion-weighted three-dimensional MP-RAGE MR imaging. Magn Reson Imaging 2005;23(3):463–468. [DOI] [PubMed] [Google Scholar]
- 23.Nguyen C, Fan Z, Sharif B, et al. In vivo three-dimensional high resolution cardiac diffusion-weighted MRI: A motion compensated diffusion-prepared balanced steady-state free precession approach. Magn Reson Med 2014;72(5):1257–1267. [DOI] [PubMed] [Google Scholar]
- 24.Nguyen C, Sharif-Afshar AR, Fan Z, et al. 3D high-resolution diffusion-weighted MRI at 3T: Preliminary application in prostate cancer patients undergoing active surveillance protocol for low-risk prostate cancer. Magn Reson Med 2016;75(2):616–626. [DOI] [PubMed] [Google Scholar]
- 25.Yuan J, Hu Y, Menini A, et al. Near-silent distortionless DWI using magnetization-prepared RUFIS. Magn Reson Med 2020;84(1):170–181. [DOI] [PMC free article] [PubMed] [Google Scholar]
- 26.Madio DP, Lowe IJ. Ultra-fast imaging using low flip angles and FIDs. Magn Reson Med 1995;34(4):525–529. [DOI] [PubMed] [Google Scholar]
- 27.Wu Y, Dai G, Ackerman JL, et al. Water- and fat-suppressed proton projection MRI (WASPI) of rat femur bone. Magn Reson Med 2007;57 (3):554–567. [DOI] [PubMed] [Google Scholar]
- 28.Knoll F, Bredies K, Pock T, Stollberger R. Second order total generalized variation (TGV) for MRI. Magn Reson Med 2011;65(2):480–491. [DOI] [PMC free article] [PubMed] [Google Scholar]
- 29.Braithwaite AC, Dale BM, Boll DT, Merkle EM. Short- and midterm reproducibility of apparent diffusion coefficient measurements at 3.0-T diffusion-weighted imaging of the abdomen. Radiology 2009;250(2): 459–465. [DOI] [PubMed] [Google Scholar]
- 30.Cervantes B, Kirschke JS, Klupp E, et al. Orthogonally combined motion- and diffusion-sensitized driven equilibrium (OC-MDSDE) preparation for vessel signal suppression in 3D turbo spin echo imaging of peripheral nerves in the extremities. Magn Reson Med 2018;79(1):407–415. [DOI] [PubMed] [Google Scholar]
- 31.Dietrich O, Biffar A, Reiser MF, Baur-Melnyk A. Diffusion-weighted imaging of bone marrow. Semin Musculoskelet Radiol 2009;13(2): 134–144. [DOI] [PubMed] [Google Scholar]