

1. Introduction
Exposure to environmental chemicals during fetal development, a critical period of heightened susceptibility and programming, may increase the risk of obesity and cardiometabolic disease later in life (Braun 2016; Braun et al. 2016; Braun and Gray 2017; Heindel and Blumberg 2018; Janesick and Blumberg 2016; Navas-Acien et al. 2006; Trasande et al. 2018). Of particular concern is exposure to per- and polyfluoroalkyl substances (PFAS), a class of endocrine disrupting chemicals used in some oil/water-resistant coatings, industrial processes, food packaging, cleaning/personal care products, and firefighting foams (Buck et al. 2011; European Food Safety Authority 2008; Organisation for Economic Co-operation and Development 2018). PFAS are almost universally detected among pregnant women, infants and children, and readily cross the placenta to potentially affect the developing fetus (Apelberg et al. 2007b; Braun et al. 2016; Høyer et al. 2015; Jain 2013; Johnson et al. 2014; Maisonet et al. 2012; Manzano-Salgado et al. 2015; Woodruff et al. 2011). Some PFAS have long biological half-lives in humans (3.8–7.3 years) (Olsen et al. 2007). PFAS are routinely detected in food and drinking water in the United States (U.S.) due to their release from landfills, airports, fire training areas, and manufacturing facilities (Agency for Toxic Substances and Disease Registry 2017). Numerous communities (>6 million residents) nationwide have perfluorooctanoate (PFOA) and/or perfluorooctane sulfonate (PFOS) - contaminated drinking water in excess of the Environmental Protection Agency health advisory level of 70 ng/L (Guelfo and Adamson 2018; Hu et al. 2016; The United States Environmental Protection Agency 2018)
Early life PFAS exposure may increase cardiometabolic risk later in life. Compelling evidence from experimental animal and epidemiological studies suggests that gestational PFAS exposure may increase obesity risk (Braun et al. 2016; Halldorsson et al. 2012; Hines et al. 2009; Høyer et al. 2015; Johnson et al. 2014; Maisonet et al. 2012; Mora et al. 2017). Rodent studies suggest that perinatal or early postnatal PFAS exposure may increase insulin levels, impair glucose tolerance, alter lipid homeostasis, and increase leptin levels in offspring (Hines et al. 2009; Lv et al. 2013; Steenland et al. 2010; Tan et al. 2013; Wan et al. 2014; Zhao et al. 2011). A potential mechanism underlying the above-mentioned associations is that PFAS have a similar chemical structure to fatty acids and can activate peroxisome proliferator-activated receptors (PPAR) α and γ to disturb glucose metabolism, lipid metabolism, and energy homeostasis (Berger et al. 2005; Staels and Fruchart 2005; Takacs and Abbott 2007).
Cardiometabolic risk factors are a cluster of conditions – elevated abdominal obesity, dyslipidemia, disturbed glucose and insulin metabolism, and high blood pressure – that increase the risk of developing cardiovascular disease and type 2 diabetes, which are both among the leading causes of death worldwide and in the U.S. (Heron 2018; Isomaa et al. 2001; Lakka et al. 2002; Liese et al. 1998; Watson 2007; World Health Organization 2018). Cardiometabolic risk has origins in early life and tracks from childhood into adulthood (Bao et al. 1994; Bao et al. 1995; Barker 2000; Chen et al. 2000; Costa-Silva et al. 2016; Hales and Barker 2013; Webber et al. 1991). Cardiometabolic risk factors tend to cluster together (Anderson et al. 2016; Brambilla et al. 2007; Jousilahti et al. 1994). While metabolic syndrome, a dichotomous measure, is often used to predict the cardiometabolic risk in adults (Alberti et al. 2009), continuous cardiometabolic risk summary scores in adolescents and young adults predict later life cardiovascular disease risk and may detect more subtle or earlier manifestations of cardiometabolic disease (Expert Panel on Integrated Guidelines for Cardiovascular Health and Risk Reduction in Children and Adolescents 2011; Kelly et al. 2011).
Some prospective studies have examined the impact of early life PFAS exposure on children’s cardiometabolic risk; however, the findings were inconclusive in terms of particular PFAS and distinctive cardiometabolic risk factors (Alderete et al. 2019; Domazet et al. 2016; Fleisch et al. 2017; Halldorsson et al. 2012; Lin et al. 2020; Maisonet et al. 2015; Manzano-Salgado et al. 2017; Mora et al. 2018; Shelly et al. 2019; Warembourg et al. 2019). Most studies did not comprehensively study overall cardiometabolic risk, only examining some components separately. Only one study to date has examined overall cardiometabolic risk associated with early life PFAS exposure, and found that perfluorononanoate (PFNA) was associated with higher cardiometabolic risk scores in Spanish children at age 4 years (Manzano-Salgado et al. 2017). However, that study did not assess glucose/insulin homeostasis. Thus, prior studies may not accurately estimate the influence of PFAS exposure on children’s overall cardiometabolic risk. In addition, most previous studies focused on PFAS exposure during gestation and did not examine potential periods of heightened susceptibility during childhood.
To better understand the potential influence of gestational and childhood PFAS exposure on cardiometabolic risk in children, we investigated the associations of repeated measures of gestational and childhood serum PFAS concentrations with two different cardiometabolic risk summary scores based on traditional or novel cardiometabolic risk factors in adolescents using data from a cohort of children with higher gestational PFOA exposure.
2. Materials and Methods
2.1. Study Participants
We used data from a longitudinal pregnancy and birth cohort, the Health Outcomes and Measures of the Environment (HOME) Study. The HOME Study recruited pregnant women from Cincinnati, Ohio between 2003 and 2006, and conducted follow-up visits with the mothers and their children through age 12 years (Braun et al. 2017). The inclusion criteria included: ≥18 years old; 16±3 weeks of gestation; living in the Cincinnati, Ohio area in a home built before 1978; no diagnosis of diabetes, schizophrenia, bipolar disorder, or cancer; no history of HIV infection; and not taking any medications for thyroid disorders or seizure. Of 1,263 eligible women, 468 agreed to participate in the study, and 421 actually participated in the study and had live singleton births. More details regarding the HOME Study eligibility criteria, recruitment, and follow up were published elsewhere (Braun et al. 2017). A total of 221 mother-child pairs who had at least one serum PFAS concentration measurement during gestation or childhood, assessment of at least one individual cardiometabolic risk factor at age 12 years, and relevant covariate data were included in the current analysis.
The institutional review boards (IRBs) at Cincinnati Children’s Hospital Medical Center (CCHMC) and participating delivery hospitals approved the HOME Study protocols. Brown University and the Centers for Disease Control and Prevention (CDC) IRBs deferred to the CCHMC IRB. All mothers provided informed consent for themselves and their children at all visits; children provided informed assent at the age 12 year visit.
2.2. PFAS Exposure Assessment
Trained phlebotomists collected maternal, umbilical cord, and child blood samples at gestation, delivery, and ages 3, 8, and 12 years via venipuncture. Gestational serum PFAS concentrations were measured at 16 weeks of pregnancy for 86% of women; when 16-week blood samples were unavailable, 26-week (9.5%) or maternal delivery samples (4.5%) were used. After separating serum from whole blood, the samples were stored at −80 °C until PFAS quantification. The CDC laboratory staff quantified serum concentrations of PFOA, PFOS, PFNA, and perfluorohexane sulfonate (PFHxS) using online solid phase extraction coupled to high performance liquid chromatography-isotope dilution tandem mass spectrometry (Kato et al. 2011). PFAS concentrations were measured in a 100 μL serum aliquot diluted with formic acid and fortified with isotopically-labeled PFAS internal standards (Kato et al. 2011; Kuklenyik et al. 2005). Each analytic batch included reagent blanks and low- and high-concentration quality control materials that were evaluated using standard statistical probability rules. The limits of detection (LOD) for PFAS were ~0.1 to 0.2 ng/mL. Concentrations below the LOD were replaced with the LOD/√2 (Hornung and Reed 1990). Serum PFAS concentrations (ng/mL) were log2-transformed in statistical analyses. We standardized the concentrations of each PFAS by its interquartile range (IQR) across visits to make effect sizes comparable across different PFAS (Buckley et al. 2016).
2.3. Adolescent Cardiometabolic Risk Outcomes
All cardiometabolic risk factors were measured at the 12-year follow-up visit (Braun et al. 2020). We obtained an overnight-fasting blood sample from adolescents via venipuncture. Using a combination of valid and reliable immunoassays, we measured serum glucose, insulin, triglycerides, high density lipoprotein (HDL), leptin and adiponectin concentrations. Trained laboratory technicians in the Cincinnati Children’s Hospital Medical Center NIH-funded Clinical Translational Research Center Core Laboratory conducted all assays. The coefficient of variations for leptin and adiponectin were 11.1% and 13.1%, respectively. We calculated homeostatic model assessment for insulin resistance (HOMA-IR) using standard formulas - HOMA-IR = fasting insulin (mIU/L) x fasting glucose (mg/dL)/405, with higher values of HOMA-IR representing more severe insulin resistance (Matthews et al. 1985). We also calculated triglyceride to HDL ratio and adiponectin to leptin ratio. We took 3 sitting blood pressure measurements from adolescents, each one minute apart, using a Dinamap Pro100 automated monitor and previously described methods (Gillman and Cook 1995; Perloff et al. 1993). For statistical analyses, we excluded the first measure of blood pressure and took the average of the second and third measures (Lacruz et al. 2017). We measured iliac waist circumference around a horizontal plane defined by the iliac crests. Cross-sectional area of fat inside abdominal cavity (cm2) were measured using dual x-ray absorptiometry (DXA, Hologic Horizon densitometer) (Wang et al. 2010). Whole body DXA scans were analyzed using the National Health and Nutrition Examination Survey (NHANES) body composition analysis option.
We constructed two different continuous cardiometabolic risk summary scores with one based on traditional cardiometabolic risk factors and the other based on novel cardiometabolic risk factors. We calculated the traditional cardiometabolic risk score by summing standardized z-scores for glucose, insulin, triglycerides, HDL (multiplied by −1), the mean of systolic blood pressure and diastolic blood pressure, and waist circumference (Väistöet al. 2014). The novel cardiometabolic risk score was calculated by summing standardized z-scores for HOMA-IR, triglyceride to HDL ratio, adiponectin to leptin ratio (multiplied by −1, higher adiponectin to leptin ratio is associated with more favorable cardiometabolic outcome), systolic blood pressure, and cross-sectional area of fat inside abdominal cavity. Higher cardiometabolic risk scores indicate higher cardiometabolic risk. We calculated sex-, age-, and height- standardized blood pressure z-scores and percentiles according to the nationally-based childhood blood pressure database in the Fourth Report on the Diagnosis, Evaluation, and Treatment of High Blood Pressure in Children and Adolescents (Expert Panel on Integrated Guidelines for Cardiovascular Health and Risk Reduction in Children and Adolescents 2011; National Institutes of Health National Heart, Lung, and Blood Institute, 2005). We additionally standardized these blood pressure z-scores to our study participants for consistency and comparability across individual components of the cardiometabolic risk score. For other components without representative U.S. references, we calculated age- and sex-standardized z-scores according to our own study participants. To do so, we ran linear regression models of each individual cardiometabolic risk component as the dependent variable, and age and sex as predictors. We then standardized the residuals to derive the age- and sex-specific z-scores (Eisenmann 2008). Insulin, triglycerides, waist circumference, HOMA-IR, triglycerides to HDL ratio, adiponectin to leptin ratio, and the cross-sectional area of fat inside the abdominal cavity were not normally distributed (right-skewed) and thus were log2-transformed before standardization.
2.4. Covariate Assessment
We used the previous literature and directed acyclic graphs to identify potential confounders that may be associated with both PFAS exposure and adolescent cardiometabolic risk, but not causal intermediates or colliders (Supplemental Figures S1–S2). Trained interviewers administered standardized questionnaires at baseline to assess maternal age, education, parity, maternal prenatal fish intake frequency, at the postpartum visit to assess children’s race, and at the 3-year visit to assess breastfeeding duration. We abstracted data on child sex from hospital medical charts. We used self-reported height and weight (or imputed weight if missing) to calculate pre-pregnancy body mass index (BMI) (van der Laan et al. 2007). We used the average of the log10-transformed serum cotinine concentrations measured at 16- and 26-weeks of gestation to assess gestational tobacco smoke exposure. At the 12-year visit, we provided adolescents with standardized instructions for them to self-evaluate their pubertal stage (stages I-V) based on pubic hair growth in a private room with full-length mirror. We assessed adolescents’ physical activity level by administering the validated Physical Activity Questionnaire for Older Children and calculating the activity summary score (Kowalski et al. 1997). Trained research staff at the NIH-funded Clinical Translational Research Center Bionutrition Core collected three 24-hour food recalls (2 weekdays and 1 weekend day) from adolescents. We analyzed food recalls using the Nutrition Data Systems for Research software and foods database (University of Minnesota, MN) and calculated Healthy Eating Index scores (2010) - a measure of diet quality in terms of conformance with federal dietary guidance (Guenther et al. 2013; University of Minnesota Nutrition Coordinating Center).
2.5. Statistical Analyses
We first explored the distribution of serum PFAS concentrations at each visit by calculating univariate statistics. We then calculated the Pearson correlation coefficient for gestational and cord serum PFAS concentrations and the intraclass correlation coefficients (ICC) of childhood PFAS concentrations. We also calculated the Pearson correlation coefficient for traditional and novel cardiometabolic risk scores. Additionally, we calculated mean traditional and novel cardiometabolic risk scores by strata of the key covariates. Further, we calculated univariate statistics for traditional and novel cardiometabolic risk scores and individual components, stratified by sex.
2.5.1. Main Analyses.
We used the multiple informant method to estimate covariate-adjusted associations of gestational and childhood serum PFAS concentrations at each visit (gestation, birth, ages 3, 8, and 12 years) with adolescents’ cardiometabolic risk scores and individual cardiometabolic risk components at age 12 years. Details on the multiple informant method have been previously described (Buckley et al. 2019; Jackson-Browne et al. 2018; Li et al. 2019; Sanchez et al. 2011; Stacy et al. 2017). Briefly, the multiple informant model utilizes generalized estimating equations to jointly estimate the exposure-outcome association for each exposure period, and tests whether the estimates for exposure-outcome association are equal across all exposure periods (Buckley et al. 2019; Jackson-Browne et al. 2018; Li et al. 2019; Sanchez et al. 2011; Stacy et al. 2017). The multiple informant method can be used when there are repeated and sparsely sampled environmental exposure measures at different time points and information gathered from multiple sources is used to measure the same construct (Sanchez et al. 2011).
We estimated the difference in cardiometabolic risk outcomes per IQR increase in log2-transformed serum concentrations of a specific PFAS (e.g., PFOA, PFOS, PFNA, PFHxS) for each time period. The two differently constructed cardiometabolic risk scores (traditional and novel cardiometabolic risk scores) and each of the individual cardiometabolic risk components (glucose, insulin, triglycerides, HDL, mean of systolic and diastolic blood pressure, waist circumference; and HOMA-IR, triglyceride to HDL ratio, adiponectin to leptin ratio, systolic blood pressure, cross-sectional area of fat inside abdominal cavity) were examined separately as outcomes. Insulin, triglycerides, waist circumference, HOMA-IR, triglycerides to HDL ratio, adiponectin to leptin ratio, and the cross-sectional area of fat inside the abdominal cavity were not normally distributed (right-skewed) and thus were log2-transformed to satisfy normality assumptions.
The multiple informant model included visit, PFAS x visit, and covariates, allowing us to test whether PFAS-cardiometabolic risk associations differed by exposure period. The null hypothesis is that the associations are the same across all time periods, and we considered those with heterogeneity p-values <0.05 as evidence that at least one of the PFAS-cardiometabolic risk association differed from the rest. In all multiple informant models, we adjusted for mother’s age, education, parity, pre-pregnancy BMI, gestational serum cotinine concentrations; and child’s age, sex, race, and pubertal stage. For childhood PFAS exposure only, we also adjusted for breastfeeding duration.
2.5.2. Secondary Analyses.
First, we used the three-way visit x PFAS x sex interaction term p-value from our multiple informant models to determine if the PFAS-cardiometabolic risk associations across visits differed by sex; a P value for this term <0.05 was considered as evidence for interaction. Second, we graphically examined the dose-response relations using 3-knot restricted cubic polynomial splines for select associations between PFAS and novel cardiometabolic risk scores (Desquilbet and Mariotti 2010). Third, we jointly adjusted for PFOA and PFHxS concentrations measured at gestation or birth in the model to assess potential confounding (post hoc analysis). Finally, we specified a weighted quantile sum (WQS) regression model to examine gestation exposure to PFAS mixture (i.e., PFOA, PFOS, PFNA, and PFHxS) in association with adolescent’s novel cardiometabolic risk score (Czarnota et al. 2015). The WQS regression model constructs a weighted index within a set of correlated exposures (e.g., PFAS mixture) and estimates its overall association with the outcome. The weights that the model assigns to the individual exposure reflect the relative variable importance of the individual exposure (Czarnota et al. 2015). We implemented WQS regression in an iterative fashion (N=1,000 iterations) within a parallel-processing computing environment to capture weight uncertainty (Tanner et al. 2019). In each iteration, we randomly sampled 40% of the observations to estimate weights that maximized the association across B=100 bootstrap sub-samples. We used the remaining 60% of the observations to fit a linear regression model to estimate a standardized coefficient that assessed the exposure-outcome association.
2.5.3. Sensitivity Analyses.
To account for the influence of pubertal stage on the outcome, we examined the associations between PFAS and the age-, sex-, and pubertal stage-standardized novel cardiometabolic risk scores. Further, we conducted sensitivity analyses by additionally adjusting for child’s Healthy Eating Index 2010 total scores, physical activity summary scores, and maternal prenatal fish intake frequency (≥ once a week vs. < once a week), or removing pubertal stage from the covariate adjustment set since the presence or directionality of the associations of these covariates with PFAS exposure or outcome is unclear. We performed all analyses using SAS version 9.4 (SAS Institute Inc., U.S.).
3. Results
Gestational serum PFAS concentrations were generally higher than childhood PFAS concentrations. Children’s PFAS concentrations peaked at age 3 years and were lowest at age 12 years (Supplemental Table S1). Gestational serum PFAS concentrations were highly correlated with cord serum PFAS concentrations (Pearson’s r ranges 0.78–0.96). The ICCs of childhood PFAS concentrations were ≤0.4. PFAS concentrations of women and children in our cohort are comparable to those of pregnant women and children in other studies, except that gestational and cord serum PFOA concentrations were somewhat higher in our cohort, possibly due to the elevated drinking water PFOA levels in the Ohio River that was contaminated by a West Virginia fluoropolymer plant (Andersen et al. 2013; Apelberg et al. 2007a; Apelberg et al. 2007b; Casas et al. 2013; Darrow et al. 2013; Emmett et al. 2006; Fei et al. 2010; Frisbee et al. 2009; Fromme et al. 2010; Grandjean et al. 2012; Halldorsson et al. 2012; Hamm et al. 2010; Inoue et al. 2004; Jain 2013; 2018; Javins et al. 2013; Kato et al. 2009; Kim et al. 2011; Lee et al. 2013; Monroy et al. 2008; Schecter et al. 2012; Whitworth et al. 2012; Ye et al. 2018).
The mean ± standard deviation (SD) of traditional and novel cardiometabolic risk scores were 0.1 ± 3.4 and 0 ± 3.4, respectively. The traditional and novel cardiometabolic risk scores were highly correlated (Pearson’s r=0.93). On average, mean traditional and novel cardiometabolic risk scores were higher among adolescents who were non-Hispanic Black, not breastfed, at more advanced pubertal stage, or were born to mothers with less education (≤high school education), actively smoked during pregnancy, or had higher pre-pregnancy BMI (≥30 kg/m2) (Table 1). Among the 221 adolescents included in our analysis, individual cardiometabolic risk components were measured among 184–221 adolescents, with adiponectin to leptin ratio measured among 184 adolescents and blood pressure and waist circumference measured among 221 adolescents (Table 2). Compared to males, females had lower adiponectin to leptin ratio and smaller cross-sectional area of fat inside abdominal cavity, and higher insulin, HOMA-IR, and waist circumference.
Table 1.
Traditional and Novel Cardiometabolic Risk Scores at Age 12 Years According to Covariates among Children from the Health Outcomes and Measures of the Environment (HOME) Study.
| N | Traditional Cardiometabolic Risk Score | N | Novel Cardiometabolic Risk Score | |
|---|---|---|---|---|
| Mean ± SD | Mean ± SD | |||
| Overall | 186 | 0.1 ± 3.4 | 180 | 0 ± 3.4 |
| Child Sex | ||||
| Female | 97 | 0 ± 3.3 | 96 | 0 ± 3.7 |
| Male | 89 | 0.2 ± 3.4 | 84 | 0.1 ± 3.1 |
| Child Race | ||||
| Non-Hispanic White | 103 | −0.3 ± 3.5 | 100 | −0.5 ± 3.5 |
| Non-Hispanic Black | 71 | 0.7 ± 3.3 | 69 | 0.9 ± 3.3 |
| Other | 12 | −1.1 ± 2.7 | 11 | −1.0 ± 2.4 |
| Child Pubertal Stage | ||||
| Stage 1 | 19 | −0.9 ± 3.9 | 17 | −0.8 ± 3.5 |
| Stage 2 | 47 | −0.5 ± 3.5 | 47 | −0.6 ± 3.7 |
| Stage 3 | 55 | 0.2 ± 3.4 | 52 | 0 ± 3.4 |
| Stage 4 | 38 | 1.0 ± 3.2 | 38 | 0.9 ± 3.4 |
| Stage 5 | 27 | 0 ± 2.7 | 26 | 0.4 ± 2.8 |
| Breastfeeding Duration (Any) | ||||
| 0 month | 35 | 1.4 ± 3.0 | 34 | 1.1 ± 3.3 |
| >0–6 months | 74 | −0.3 ± 3.0 | 73 | −0.4 ± 3.1 |
| >6 months | 73 | −0.5 ± 3.6 | 70 | −0.2 ± 3.7 |
| Maternal Age | ||||
| 18–25 Years | 46 | 0.1 ± 3.0 | 45 | 0.2 ± 3.0 |
| >25–35 Years | 112 | −0.1 ± 3.5 | 109 | −0.1 ± 3.6 |
| >35 Years | 28 | 0.5 ± 3.5 | 26 | 0.3 ± 3.6 |
| Maternal Education | ||||
| High School or Less | 41 | 1.1 ± 3.5 | 41 | 1.4 ± 3.2 |
| Tech School/Some College | 59 | −0.3 ± 3.4 | 57 | −0.7 ± 3.7 |
| Bachelor’s or More | 86 | −0.2 ± 3.3 | 82 | −0.1 ± 3.2 |
| Pre-Pregnancy BMI (kg/m2) | ||||
| <25 | 96 | −0.4 ± 3.3 | 92 | −0.4 ± 3.3 |
| ≥25–30 | 50 | −0.3 ± 3.3 | 49 | −0.3 ± 3.3 |
| >30 | 40 | 1.5 ± 3.4 | 39 | 1.6 ± 3.5 |
| Gestational Serum Cotinine (ng/ml) | ||||
| <0.015 (Unexposed) | 56 | −0.1 ± 2.9 | 51 | −0.3 ± 3.1 |
| 0.015–3 (Secondhand) | 112 | −0.1 ± 3.5 | 111 | −0.1 ± 3.6 |
| >3 (Active Smoker) | 18 | 1.7 ± 3.8 | 18 | 1.6 ± 3.3 |
| Parity | ||||
| 0 | 73 | −0.6 ± 3.5 | 71 | −0.5 ± 3.6 |
| 1 | 62 | 0.7 ± 3.4 | 59 | 0.5 ± 3.3 |
| ≥2 | 51 | 0.3 ± 3.0 | 50 | 0.2 ± 3.2 |
Note: We enrolled pregnant women in their second trimester and have conducted two visits (at ~16 week and ~26 week of gestation) to collect maternal baseline information.
Traditional cardiometabolic risk score was the sum of the standardized z-scores for waist circumference, glucose, insulin, triglycerides, high-density lipoproteins (multiplied by −1), and the mean of systolic and diastolic blood pressure.
Novel cardiometabolic risk score was the sum of the standardized z-scores for Homeostatic Model Assessment of Insulin Resistance, triglyceride to high-density lipoproteins ratio, adiponectin to leptin ratio (multiplied by −1), systolic blood pressure, and cross-sectional area of fat inside the abdominal cavity.
SD: standard deviation; BMI: body mass index.
Table 2.
Descriptive Statistics of Cardiometabolic Risk Outcomes among the HOME Study Adolescents at the 12 Year Study Visit: Stratified by Sex (Total N=221).
| Measurement | All | Boys | Girls | |||
|---|---|---|---|---|---|---|
| N | Median (25th, 75th) | N | Median (25th, 75th) | N | Median (25th, 75th) | |
| Traditional Cardiometabolic (CM) Risk Score | 186 | 0.1 (−2.4, 2.2) | 89 | 0.2 (−2.2, 1.6) | 97 | 0.1 (−2.6, 2.3) |
| Glucose (mg/dL) | 186 | 91 (88, 96) | 89 | 93 (89, 98) | 97 | 90 (87, 94) |
| Insulin (mlU/L) | 187 | 12 (8.2, 19) | 89 | 10 (6.8, 13) | 98 | 16 (11, 21) |
| Triglycerides (mg/dL) | 186 | 75 (59, 100) | 89 | 74 (60, 94) | 97 | 77 (59, 102) |
| High Density Lipoprotein (HDL, mg/dL) | 186 | 53 (45, 60) | 89 | 53 (45, 62) | 97 | 52 (45, 58) |
| Mean of Systolic and Diastolic Blood Pressure (Z-Score) | 221 | −0.6 (−0.9, −0.2) | 100 | −0.5 (−0.9, −0.2) | 121 | −0.6 (−1.0, −0.2) |
| Waist Circumference (Iliac, cm) | 221 | 71 (64, 79) | 100 | 67 (63, 76) | 121 | 72 (66, 82) |
| Novel CM Risk Score | 180 | −0.4 (−2.2, 1.9) | 84 | −0.2 (−1.8, 1.6) | 96 | −0.6 (−2.4, 2.6) |
| HOMA-IR | 186 | 2.8 (1.9, 4.3) | 89 | 2.4 (1.6, 3.1) | 97 | 3.5 (2.5, 5.2) |
| Triglyceride to HDL Ratio | 186 | 1.4 (1.1, 2.1) | 89 | 1.4 (1.0, 1.8) | 97 | 1.4 (1.1, 2.1) |
| Adiponectin to Leptin Ratio | 184 | 1.4 (0.6, 4.2) | 88 | 2.3 (0.9, 5.5) | 96 | 1.0 (0.4, 2.5) |
| Systolic Blood Pressure (Z-Score) | 221 | −0.6 (−1.1, −0.1) | 100 | −0.6 (−1.0, 0.0) | 121 | −0.6 (−1.1, −0.1) |
| Cross-sectional Area of Fat Inside the Abdominal Cavity (cm2) | 214 | 41 (31, 55) | 96 | 48 (41, 56) | 118 | 34 (26, 52) |
Note: Traditional CM risk score was the sum of the standardized z-scores for waist circumference, glucose, insulin, triglycerides, HDL (multiplied by −1), and the mean of systolic and diastolic blood pressure.
Blood Pressure z-scores were sex-, age-, and height- standardized according to the Fourth Report on the Diagnosis, Evaluation, and Treatment of High Blood Pressure in Children and Adolescents.
HOMA-IR: Homeostatic Model Assessment of Insulin Resistance. HOMA-IR = Fasting insulin (mIU/L) x Fasting glucose (mg/dL)/405.
Novel CM risk score was the sum of the standardized z-scores for HOMA-IR, triglyceride to HDL ratio, adiponectin to leptin ratio (multiplied by −1), systolic blood pressure, and cross-sectional area of fat inside the abdominal cavity.
After adjusting for covariates, the association of serum PFOA concentrations with the traditional cardiometabolic risk score differed across visits (P for heterogeneity=0.04), with serum PFOA concentrations at gestation and birth being positively associated with traditional cardiometabolic risk scores (Figure 1, Supplemental Tables S2–S3). In particular, with 1-IQR increase in log2-transformed gestational and cord serum PFOA concentrations, traditional cardiometabolic risk scores increased 0.5 SDs (95% confidence interval [CI]=−0.3, 1.3) and 1.0 SDs (95%CI=−0.1, 2.0), respectively. Associations of serum PFHxS concentrations with traditional cardiometabolic risk scores were uniformly positive across visits (P for heterogeneity=0.56), but were stronger at gestation and birth (gestational β=0.5, 95%CI=−0.2, 1.2; cord β=0.7, 95%CI=−0.1, 1.6). These positive associations of gestational and cord PFOA and PFHxS concentrations with traditional cardiometabolic risk scores were mainly driven by their positive associations with insulin, waist circumference, and mean of systolic and diastolic blood pressure (PFHxS only). Generally, gestational and childhood serum PFOS and PFNA concentrations were not associated with traditional cardiometabolic risk scores, except that PFOS and PFNA at age 3 years were associated with lower traditional cardiometabolic risk scores. Serum PFOS concentrations at ages 3, 8 and 12 years was associated with higher HDL levels.
Figure 1.

Adjusted Differences in Traditional Cardiometabolic Risk Scores and the Individual Components with 1-Interquartile Range (IQR) Increase in Log2-Transformed Serum Per- and Polyfluoroalkyl Substance (PFAS) Concentrations: The HOME Study.
Note: PFOA: perfluorooctanoate; PFOS: perfluorooctane sulfonate; PFNA: perfluorononanoate; PFHxS: perfluorohexane sulfonate; trad: traditional; CM: cardiometabolic; HDL: high-density lipoproteins; Mean of BP: mean of systolic and diastolic blood pressure z-scores; Cir: circumference.
The y-axis units were standard deviation for traditional CM score and mean of blood pressure, mg/dL for glucose, triglycerides and HDL, mIU/L for insulin, and centimeter for waist circumference.
Blood Pressure z-scores were sex-, age-, and height- standardized according to the Fourth Report on the Diagnosis, Evaluation, and Treatment of High Blood Pressure in Children and Adolescents.
Traditional CM risk score was the sum of the standardized z-scores for waist circumference, glucose, insulin, triglycerides, HDL (multiplied by −1), and the mean of systolic and diastolic blood pressure.
All models adjusted for visit, visit*PFAS, maternal age, maternal education, maternal pre-pregnancy BMI, gestational serum cotinine concentrations, and parity; and child age, sex, race, and pubertal stage. For childhood PFAS exposure, we also adjusted for breastfeeding duration.
Insulin, triglycerides, and waist circumference were not normally distributed and thus were log2-transformed in the model.
After adjusting for covariates, the association of serum PFOA concentrations with novel cardiometabolic risk scores differed across visits (P for heterogeneity=0.03), with only serum PFOA concentrations at gestation and birth having significantly positive associations with novel cardiometabolic risk scores (gestational β=0.8, 95%CI=0.0, 1.6; cord β=0.9, 95%CI=−0.1, 1.9) (Figure 2, Supplemental Tables S2–S3). The positive associations for gestational PFOA were primarily driven by HOMA-IR (β=0.3; 95%CI=0.1, 0.5) and adiponectin/leptin ratio (β=−0.5; 95%CI=−1.0, 0.0). Serum PFHxS concentrations with novel cardiometabolic risk scores were uniformly positive across visits (P for heterogeneity=0.57) and were again stronger for gestational and cord PFHxS concentrations (gestational β=0.9, 95%CI=0.2, 1.6; cord β=0.9, 95%CI=0.1, 1.7). These associations were driven by similar individual components as PFOA, as well as systolic blood pressure and cross-sectional area of fat inside the abdominal cavity. Gestational and childhood serum PFOS and PFNA concentrations were in general not associated with novel cardiometabolic risk scores, except that PFOS and PFNA at age 3 years were associated with lower novel cardiometabolic risk scores.
Figure 2.
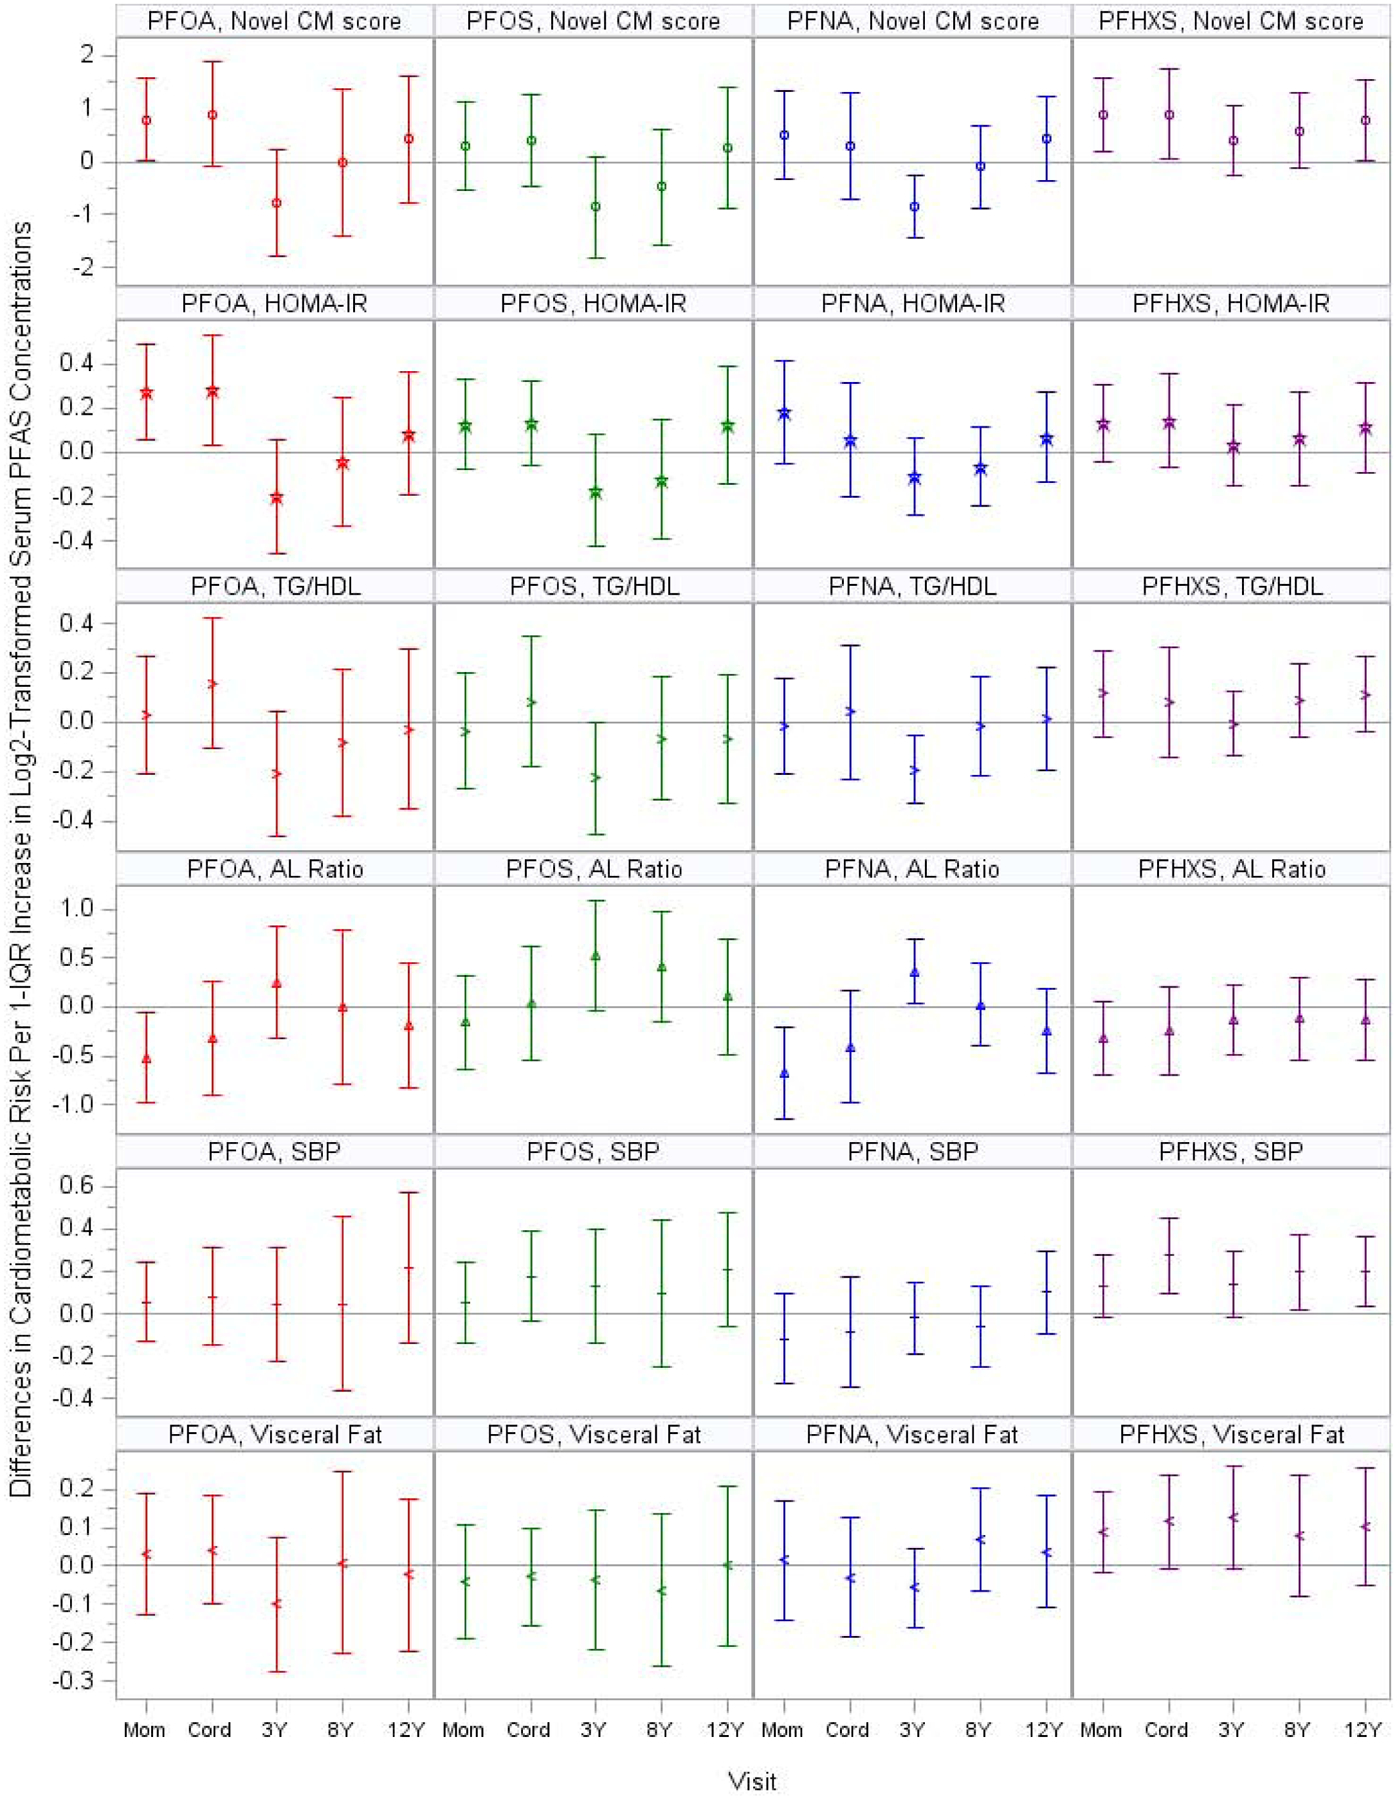
Adjusted Differences in Novel Cardiometabolic Risk Scores and the Individual Components with 1-IQR Increase in Log2-Transformed Serum PFAS Concentrations: The HOME Study.
Note: PFOA: perfluorooctanoate; PFOS: perfluorooctane sulfonate; PFNA: perfluorononanoate; PFHxS: perfluorohexane sulfonate; CM: cardiometabolic; HOMA-IR: Homeostatic Model Assessment of Insulin Resistance; TG/HDL: triglyceride to high-density lipoproteins ratio; AL: adiponectin to leptin; SBP: systolic blood pressure z-score; visceral fat: cross-sectional area of fat inside the abdominal cavity.
The y-axis units were standard deviation for novel CM score and systolic blood pressure and square centimeters for visceral fat. Blood Pressure z scores were sex-, age-, and height- standardized according to the Fourth Report on the Diagnosis, Evaluation, and Treatment of High Blood Pressure in Children and Adolescents.
Novel CM risk score was the sum of the standardized z-scores for HOMA-IR, triglyceride to HDL ratio, adiponectin to leptin ratio (multiplied by −1), systolic blood pressure, and cross-sectional area of fat inside the abdominal cavity.
All models adjusted for visit, visit*PFAS, maternal age, maternal education, maternal pre-pregnancy BMI, gestational serum cotinine concentrations, and parity; and child age, sex, race, and pubertal stage. For childhood PFAS exposure, we also adjusted for breastfeeding duration.
HOMA-IR, triglyceride to HDL ratio, adiponectin to leptin ratio, and cross-sectional area of fat inside the abdominal cavity were not normally distributed and thus were log2-transformed in the model.
The associations between PFAS concentrations and cardiometabolic risk across visits in general did not differ by sex (Supplemental Figures S3–S4 and Table S4). The dose-response relation of gestational and cord PFOA concentrations with novel cardiometabolic risk scores were close to non-linear (inverted U-shape), although not at a statistically significant level (non-linearity p-values were 0.05 and 0.19, respectively). We observed linear increases in adolescents’ novel cardiometabolic risk scores with increasing gestational and cord serum concentrations of PFHxS (non-linearity p-values were 0.41 and 0.67, respectively) (Supplemental Figure S5). When we jointly adjusted for gestational or cord serum PFOA and PFHxS concentrations, the associations were slightly attenuated. Gestational or cord PFOA was more strongly associated with insulin and HOMA-IR than PFHxS, whereas gestational and cord PFHxS was more strongly associated with waist circumference than PFOA (Supplemental Figure S6). When examining the aggregate impact of the four PFAS using WQS regression, an IQR increase in the weighted gestational PFAS index was positively associated with the novel cardiometabolic risk score (β=0.23, 95%CI=0.18, 0.29). PFOA and PFHxS (relative weights=0.80 and 0.16, respectively) contributed largely to these associations compared to PFOS and PFNA (relative weights=0.01 and 0.03, respectively) (Figure 3). The results were not substantially different from our main analysis when we used the age-, sex-, and pubertal stage-adjusted novel cardiometabolic risk scores, additionally adjusted for Healthy Eating Index 2010 total scores, physical activity summary scores, maternal prenatal fish intake frequency, or removed pubertal staging from the covariate adjustment set.
Figure 3.

Weighted Quantile Sum Regression Analysis with 1,000 Iterations on Gestational Exposure to PFAS Mixture and Novel Cardiometabolic Risk Score: Relative Weights of Each PFAS (N=168).
Note: each individual dot represents weight for a given PFAS from a single repeated holdout; and box-and-whisker plots describe univariate statistics of the weights from 1,000 repeated holdouts.
PFOA: perfluorooctanoate; PFHxS: perfluorohexane sulfonate; PFNA: perfluorononanoate; PFOS: perfluorooctane sulfonate.
All models adjusted for maternal age, maternal education, maternal pre-pregnancy BMI, gestational serum cotinine concentrations, and parity; and child age, sex, race, and pubertal stage.
4. Discussion
Using data from a pregnancy and birth cohort, we examined the associations of repeated measures of serum PFAS concentrations from gestation to age 12 years with adolescents’ cardiometabolic risk at age 12 years. Gestational and cord PFOA and PFHxS concentrations were positively associated with both cardiometabolic risk scores. The positive associations with traditional cardiometabolic risk scores were driven by insulin, waist circumference, and mean systolic and diastolic blood pressure (PFHxS only); associations with novel cardiometabolic risk scores were primarily driven by HOMA-IR, adiponectin to leptin ratio, systolic blood pressure (PFHxS only), and cross-sectional area of fat inside abdominal cavity (PFHxS only).
PFAS are structurally similar to fatty acids, and thus may alter fatty acid metabolism and lipid synthesis in the liver (Pilz et al. 2006). With their similar structure, PFAS can act as agonists of PPAR α and γ, key regulators of metabolic functions in both rodents and humans (Berger et al. 2005; Staels and Fruchart 2005; Takacs and Abbott 2007). Thus, one potential mechanism is that PFAS may disturb glucose metabolism, lipid metabolism, and energy homeostasis by activating PPAR α and γ (Berger et al. 2005; Staels and Fruchart 2005; Takacs and Abbott 2007). PFAS also interfere with the signaling pathways of the thyroid hormones, which play a key role in regulating metabolism (Lau et al. 2007; Mullur et al. 2014). In addition, PFAS exposure increase oxidative stress, which in turn contributes to metabolic dysfunction (Liu et al. 2007; Mahjoub and Masrour-Roudsari 2012). Evidence from an experimental study suggests that in utero PFOA exposure, but not adult exposure, was associated with mid-life overweight in mice, suggesting that gestation is a unique period of heightened susceptibility to PFOA exposure (Hines et al. 2009). Besides obesity, early life PFAS exposure may also be associated with other cardiometabolic risk factors. Rodent studies suggest that perinatal or early postnatal exposure to PFOA, PFOS and PFHxS increases insulin and leptin levels, and impairs glucose tolerance in offspring (Hines et al. 2009; Lv et al. 2013; Steenland et al. 2010; Tan et al. 2013; Wan et al. 2014; Zhao et al. 2011). Early life PFAS exposure may also disrupt lipid metabolism and induce hepatotoxic effects (Kennedy et al. 2004; Lau et al. 2007; White et al. 2011), as well as increase oxidative stress and impair vasodilation, which in turn could increase blood pressure (Ceriello 2008; Huang et al. 2013; Panaretakis et al. 2001; Wielsøe et al. 2015).
Because pediatric cardiometabolic risk factors tend to cluster, continuous cardiometabolic risk scores may be an important outcome that can be measured before adult disease onset and provide opportunities for disease prevention (Anderson et al. 2016; Brambilla et al. 2007; Jousilahti et al. 1994). However, despite the growing use of continuous cardiometabolic risk summary score in pediatrics, there is currently no validated or harmonized consensus definition (Eisenmann 2008; Kamel et al. 2018; Sovio et al. 2013). Thus, we constructed cardiometabolic risk scores that included either traditional or relatively novel cardiometabolic risk markers. Our novel risk score is likely a better predictor of subsequent cardiometabolic risk. For example, HOMA-IR, which plays an essential role in initiating and perpetuating the pathologic manifestations of metabolic syndrome, is a robust surrogate measure of insulin resistance (Antuna-Puente et al. 2011; Lann and LeRoith 2007; Matthews et al. 1985). Growing evidence supports that triglyceride to HDL ratio and adiponectin to leptin ratio are closely related to insulin resistance and metabolic syndrome, and are good predictors of cardiovascular disease and type 2 diabetes risk or mortality (Ayina et al. 2017; Chen et al. 2020; Cordero et al. 2008; Dai et al. 2019; Frithioff-Bøjsøe et al. 2020; Frühbeck et al. 2018; Inoue et al. 2006; Kim et al. 2019; López-Jaramillo et al. 2014; McLaughlin et al. 2005; Vega et al. 2014). Fasting HOMA-IR (compared to fasting insulin) and triglycerides to HDL ratio (compared to triglycerides and HDL individually) had higher predictive values when assessing metabolic syndrome in adolescents (Chu et al. 2019; Piña-Aguero et al. 2018). Systolic blood pressure is a major risk factor for cardiovascular disease in later life (Strandberg and Pitkala 2003). Finally, we directly measured visceral fat, which is an important predictor of cardiometabolic risk (Nakamura et al. 1994; Snijder et al. 2006; Zhang et al. 2015).
Only one previous study has examined the associations between early life PFAS exposure and children’s cardiometabolic risk scores, reporting that gestational exposure to PFNA, but not PFOA, PFOS, or PFHxS, was positively associated with cardiometabolic risk in Spanish children at age 4 years (Manzano-Salgado et al. 2017). In contrast, in our cohort, gestational PFOA and PFHxS concentrations were positively associated with cardiometabolic risk scores. The cardiometabolic risk score calculated in the Spanish study included waist circumference, blood pressure, HDL, and triglycerides, but not markers of glucose-insulin homeostasis, which is typically used to define metabolic syndrome (Alberti et al. 2009). Thus, the findings may not comprehensively estimate the potential impact of gestational PFAS on children’s cardiometabolic risk at age 4 years. The inconsistent findings between the Spanish study (INMA) and ours may also be partly due to differences in gestational PFOA concentration distributions. Gestational PFOA concentrations were higher in our cohort, perhaps because of contamination from a West Virginia fluoropolymer plant (IQR: HOME: 3.7–7.2 ng/mL; INMA:1.6–3.3 ng/mL) (Emmett et al. 2006; Frisbee et al. 2009). However, we observed that the association between gestational PFOA and novel cardiometabolic risk score was linear and positive at the lower range of PFOA concentrations. Therefore, it is unlikely the inconsistent findings were solely due to the different distributions of gestational PFOA concentrations. In addition, the age difference of outcome assessment may also partly explain the discrepancy in results, where some unfavorable cardiometabolic risk factors have not yet manifested at age 4 years.
We found that gestational and cord PFOA and PFHxS concentrations were positively associated with insulin and HOMA-IR in adolescents at age 12 years. Consistent with our findings, a Danish Study found that gestational PFOA concentrations were positively associated with insulin in young adults aged 20 years (Halldorsson et al. 2012). In contrast, a study using data from the Project Viva cohort (based in Boston, Massachusetts, U.S.) reported that gestational PFAS (including PFOA, PFOS, PFNA, and PFHxS) were not associated with HOMA-IR in mid-childhood (median age: 7.7 years) (Fleisch et al. 2017); the distribution of gestational plasma PFOA concentrations in the Project Viva cohort was comparable to that in our cohort. The Project Viva (1999–2002) and HOME Study (2002–2006) cohorts enrolled participants several years before the US Environmental Protection Agency PFOA Stewardship Program, which asked the eight major leading companies in the PFAS industry to commit to reducing PFOA emissions. Thus, the participants in these two studies presumably had higher PFOA exposure. The differences in study design and participant demographics (e.g., children’s age, family socioeconomic status) between the two studies may explain the inconsistent findings.
Gestational and childhood PFAS were generally not associated with triglycerides, HDL, or triglyceride to HDL ratio in our study. The Spanish study found that gestational PFHxS, but not PFOA, PFOS, or PFNA were positively associated with triglycerides at age 4 years (Manzano-Salgado et al. 2017). In our study, gestational PFHxS was marginally associated with higher triglycerides at age 12 years, although the 95% CI included the null. Another study using data from the Project Viva cohort reported that gestational PFAS were not associated with triglycerides or HDL in mid-childhood (median age: 7.7 years) (Mora et al. 2018). Many cross-sectional studies reported that higher PFOA concentrations are associated with unfavorable lipid profiles, including higher total cholesterol and low-density lipoprotein cholesterol in both children and adults (Frisbee et al. 2010; Matilla-Santander et al. 2017; Mora et al. 2018; Nelson et al. 2010; Skuladottir et al. 2015). It is unclear why we did not observe this association in our cohort.
We found that gestational PFOA and PFHxS were associated with higher leptin levels and lower adiponectin to leptin ratio. Consistently, the Danish study also found that gestational PFOA were associated with higher leptin levels and leptin to adiponectin ratio in adults at age 20 years (Halldorsson et al. 2012). The Project Viva study found null associations of gestational PFAS with leptin or adiponectin levels in mid-childhood (Fleisch et al. 2017). Similarly, a study in the Faroe Islands reported that gestational PFAS were associated with neither leptin nor adiponectin concentrations at age 13 years (Shelly et al. 2019). However, the latter two studies only examined the impact of gestational PFAS on individual adipocytokines but not the ratio of the two adipocytokines. It is noteworthy that individual adipocytokines may not be a good predictor of cardiometabolic risk. Growing evidence shows that adiponectin to leptin ratio (or leptin to adiponectin ratio) is a better predictor of insulin resistance and cardiometabolic risk in children than individual adipocytokines (Ayina et al. 2017; Frithioff-Bøjsøe et al. 2020; Frühbeck et al. 2018; Inoue et al. 2006; López-Jaramillo et al. 2014).
Gestational and childhood exposure to PFHxS, but not to PFOA, PFOS, or PFNA was associated with adolescents’ blood pressure in our study. Gestational PFHxS was not associated with blood pressure in the Spanish (INMA) study (Manzano-Salgado et al. 2017). It is noteworthy that the adolescents in our cohort have lower average blood pressure than the U.S. general population at the same age range (possibly partly due to overnight fasting), which may to some extent reduce the generalizability of our findings. Regardless, two previous studies have examined childhood blood pressure in associations with gestational exposure to PFOA, PFOS, or PFNA, and reported findings consistent with ours (Manzano-Salgado et al. 2017; Warembourg et al. 2019).
We found that gestational PFOA and PFHxS were both positively associated with waist circumference, and gestational PFHxS was also positively associated with cross-sectional area of fat inside abdominal cavity. Consistently, two other studies reported that gestational PFOA was positively associated with adolescents’ waist circumference (Halldorsson et al. 2012; Mora et al. 2017). In contrast, the Spanish study found that gestational PFAS were not associated with waist circumference at age 7 years. Gestational PFOA was positively associated with waist circumference, but not with cross-sectional area of fat inside abdominal cavity. Our findings on PFOA are not contradictory. The cross-sectional area of fat inside abdominal cavity we measured using DXA is a direct measure of visceral fat. In contrast, waist circumference is an indirect method to assess central adiposity and cannot disentangle visceral fat from abdominal subcutaneous fat (Bigornia et al. 2013; Bosy-Westphal et al. 2010). Given that this is the first study to date that examined the associations between early life PFAS and directly measured visceral fat, future studies are needed to confirm our findings.
PFOS and PFNA at 3 years old were associated with decreased cardiometabolic risk in our cohort, and these associations were driven by several components such as HDL, triglycerides, HOMA-IR, and adiponectin to leptin ratio. No previous studies have examined the impact of PFOS and PFNA at age 3 years on children’s cardiometabolic risk, and thus we do not have a basis for comparison. However, and to some extent consistent with our findings, in Project Viva mid-childhood PFOS was associated with increased HDL and decreased triglycerides, as well as mid-childhood PFOS and PFNA were associated with decreased HOMA-IR (Mora et al. 2018). Future studies are needed to confirm these findings and investigate the underlying mechanisms.
Few studies have examined the impact of gestational PFAS mixtures on adolescent’s cardiometabolic risk, and thus we do not have a basis for comparison. In our WQS analysis, PFAS mixture was positively associated with the novel cardiometabolic risk score, with gestational PFOA and PFHxS as the more important variables contributing to this association. This finding is consistent with our findings from single PFAS analysis where gestational PFOA and PFHxS were positively associated with the cardiometabolic risk.
We did not observe sex-specific patterns of associations between PFAS and cardiometabolic risk in our cohort. Most previous studies either did not examine or did not observe effect measure modification by sex (Alderete et al. 2019; Domazet et al. 2016; Fleisch et al. 2017; Halldorsson et al. 2012; Lin et al. 2020; Maisonet et al. 2015; Manzano-Salgado et al. 2017; Mora et al. 2018; Shelly et al. 2019; Warembourg et al. 2019). Two studies found slightly stronger associations in girls (Halldorsson et al. 2012; Mora et al. 2018). It is noteworthy that most of these studies, including ours, had limited statistical power to study differences by sex so these results need to be interpreted with caution.
There are some strengths and limitations to our study. First, because cardiometabolic risk factors tend to cluster, we used cardiometabolic risk summary scores to assess the influence of PFAS on adolescents’ overall cardiometabolic risk. Given that there is currently no consensus on the definition for the score, in addition to constructing a score using traditional cardiometabolic risk factors according to the definition of metabolic syndrome in adults, we also constructed a score using relatively novel, but likely better predictors to assess risk. However, it is noteworthy that our calculation of cardiometabolic risk score is based on the assumption that each individual component has equal weights/contribution to the overall cardiometabolic risk, which is consistent with current definition of metabolic syndrome. Nonetheless, it is possible that some individual components are more important predictors of cardiometabolic risk than the others, and thus our results need to be interpreted with caution. Second, most previous studies did not examine the influence of childhood PFAS exposure on cardiometabolic risk, or only examined the cross-sectional association between childhood PFAS and cardiometabolic risk. The longitudinal design of our study allowed us to examine the associations of adolescents’ cardiometabolic risk with serum PFAS concentrations assessed during multiple periods of susceptibility to the potential effects of PFAS exposure, including gestation and early and middle childhood (Rice and Barone 2000). The multiple informant model enabled us to utilize these repeated PFAS assessments and formally test differences in the associations between PFAS exposure and adolescents’ cardiometabolic risk across visits and identify gestation as a potential period of heightened susceptibility (Sanchez et al. 2011). Third, previous studies used maternal gestational PFAS exposure as a proxy for fetal exposure, given that gestational PFAS concentrations were highly correlated with cord blood PFAS concentrations (Manzano-Salgado et al. 2015). However, there is variation in the extent to which each PFAS in maternal blood is transferred to the fetus (Pan et al. 2017). In our study, we measured both gestational and cord serum PFAS concentrations to better assess the fetal PFAS exposure. It is noteworthy that we have fewer cord blood samples than maternal gestational blood samples, and thus the associations for cord blood PFAS were less precise. Fourth, our study had a modest sample size, and the multiple informant model has relatively low power to detect exposure-time period interactions. Regardless, we were still able to detect that associations between PFOA and adolescent cardiometabolic risk scores varied by exposure period. Fifth, we collected a rich set of covariates using valid and reliable measures, which allowed us to adjust for a variety of potential confounders, including diet quality, physical activity, and maternal prenatal fish consumption. However, there may be residual confounding from dietary, and maternal behavioral or lifestyle factors. Diet is one of the major sources of human PFAS exposure and is also associated with cardiometabolic risk, and therefore diet could potentially confound the associations between PFAS exposure and the cardiometabolic risk. Unfortunately, we do not have detailed diet information (consumption of each type of foods) at each exposure period. Future studies are needed to more thoroughly investigate diet as a confounder. There are also possibilities of residual confounding by some less common PFAS or other chemicals that are both correlated with PFOA/PFHxS and associated with cardiometabolic risk. Finally, while multiple comparisons may be a concern in this study, the consistent patterns of gestational and cord serum PFOA and PFHxS associated with both cardiometabolic risk scores and their individual components suggests that these results may not be solely due to chance. The potential concern of false positive results necessitates further replication of our findings.
5. Conclusions
Exposure to PFOA and PFHxS during gestation, compared to childhood, was more strongly associated with unfavorable cardiometabolic risk scores at age 12 years in this cohort of children with higher gestational PFOA exposure. Gestational and childhood PFOS and PFNA exposure were generally not associated with cardiometabolic risk scores at age 12 years. Gestational exposure to the four PFAS was aggregately associated with unfavorable cardiometabolic risk. Future epidemiologic studies investigating the health impacts of early life PFAS exposure should consider using continuous cardiometabolic risk summary scores to assess cardiometabolic risk and confirm our findings. In addition, future epidemiolocal studies are needed to investigate the impact of other PFAS and PFAS mixture on cardiometabolic risk, and investigate the biological mechanisms underlying these associations.
Supplementary Material
Highlights.
Gestational PFOA exposure was associated with unfavorable cardiometabolic risk
Gestational PFHxS exposure was associated with unfavorable cardiometabolic risk
A novel risk score was used to assess adolescents’ cardiometabolic risk
Acknowledgements:
We acknowledge the Centers for Disease Control and Prevention (CDC) laboratory staff who performed the PFAS measurements. We are grateful to our participants for the time they have given to our study.
Funding Source: This work was supported by National Institute of Environmental Health Sciences grants P01 ES011261, R01 ES014575, R01 ES020349, R01 ES024381, R01 ES027224, and R01 ES025214.
Footnotes
Publisher's Disclaimer: This is a PDF file of an unedited manuscript that has been accepted for publication. As a service to our customers we are providing this early version of the manuscript. The manuscript will undergo copyediting, typesetting, and review of the resulting proof before it is published in its final form. Please note that during the production process errors may be discovered which could affect the content, and all legal disclaimers that apply to the journal pertain.
Competing financial interests: JMB received an honoraria from Quest Diagnostic for serving on an expert panel related to endocrine disrupting chemicals. JMB’s institution was financially compensated for his services as an expert witness for plaintiffs in litigation related to PFAS-contaminated drinking water; these funds were not paid to JMB directly. KTK is a founder and scientific advisor for Cellintec, which had no role in this research. CBE was financially compensated for his services as an expert witness for plaintiffs in litigation related to PFAS-contaminated drinking water. The other authors declare they have no actual or potential competing financial interests.
Publisher's Disclaimer: Disclaimer: The findings and conclusions in this report are those of the authors and do not necessarily represent the official position of the Centers for Disease Control and Prevention (CDC). Use of trade names is for identification only and does not imply endorsement by the CDC.
References
- Agency for Toxic Substances and Disease Registry, U.S. Department of Health & Human Services. “ATSDR’s Substance Priority List; ”, Last Modified September 25, 2017. https://www.atsdr.cdc.gov/SPL/index.html. [Google Scholar]
- National Institutes of Health National Heart, Lung, and Blood Institute. U.S. Department of Health and Human Services The Fourth Report on the Diagnosis, Evaluation, and Treatment of High Blood Pressure in Children and Adolescents; Revised May 2005. [Google Scholar]
- University of Minnesota Nutrition Coordinating Center. University of Minnesota Nutrition Coordinating Center (NCC) Food and Nutrient Database. University of Minnesota, Minneapolis, MN: Nutrition Coordinating Center. [Google Scholar]
- The United States Environmental Protection Agency. 2018 Edition of the Drinking Water Standards and Health Advisories Tables. 2018. The United States Environmental Protection Agency: Washington, DC. [Google Scholar]
- Organisation for Economic Co-operation and Development. Toward a New Comprehensive GLobal Datbase of Per- and Polyfluoroalkyl Substances (PFAS) 2018. In Series on Risk Management. Paris, France: Organisation for Economic Co-operation and Development. [Google Scholar]
- Expert Panel on Integrated Guidelines for Cardiovascular Health and Risk Reduction in Children and Adolescents, National Heart, Lung, and Blood Institute. 2011. “Expert panel on integrated guidelines for cardiovascular health and risk reduction in children and adolescents: summary report.” Pediatrics 128 Suppl 5:S213–56. doi: 10.1542/peds.2009-2107C. [DOI] [PMC free article] [PubMed] [Google Scholar]
- Alberti KG, Eckel RH, Grundy SM, Zimmet PZ, Cleeman JI, Donato KA, Fruchart JC, James WP, Loria CM, Smith SC, International Diabetes Federation Task Force on Epidemiology and Prevention, L.ng Hational Heart, and Blood Institute, American Heart Association, World Heart Federation, International Atherosclerosis Society, and International Association for the Study of Obesity. 2009. “Harmonizing the metabolic syndrome: a joint interim statement of the International Diabetes Federation Task Force on Epidemiology and Prevention; National Heart, Lung, and Blood Institute; American Heart Association; World Heart Federation; International Atherosclerosis Society; and International Association for the Study of Obesity.” Circulation 120 (16):1640–5. doi: 10.1161/CIRCULATIONAHA.109.192644. [DOI] [PubMed] [Google Scholar]
- Alderete TL, Jin R, Walker DI, Valvi D, Chen Z, Jones DP, Peng C, Gilliland FD, Berhane K, Conti DV, Goran MI, and Chatzi L. 2019. “Perfluoroalkyl substances, metabolomic profiling, and alterations in glucose homeostasis among overweight and obese Hispanic children: A proof-of-concept analysis.” Environ Int 126:445–453. doi: 10.1016/j.envint.2019.02.047. [DOI] [PMC free article] [PubMed] [Google Scholar]
- Andersen CS, Fei C, Gamborg M, Nohr EA, Sørensen TI, and Olsen J. 2013. “Prenatal exposures to perfluorinated chemicals and anthropometry at 7 years of age.” Am J Epidemiol 178 (6):921–7. doi: 10.1093/aje/kwt057. [DOI] [PubMed] [Google Scholar]
- Anderson LN, Lebovic G, Hamilton J, Hanley AJ, McCrindle BW, Maguire JL, Parkin PC, Birken CS, and TARGet Kids Collaboration. 2016. “Body Mass Index, Waist Circumference, and the Clustering of Cardiometabolic Risk Factors in Early Childhood.” Paediatr Perinat Epidemiol 30 (2):160–70. doi: 10.1111/ppe.12268. [DOI] [PubMed] [Google Scholar]
- Antuna-Puente B, Disse E, Rabasa-Lhoret R, Laville M, Capeau J, and Bastard JP. 2011. “How can we measure insulin sensitivity/resistance?” Diabetes Metab 37 (3):179–88. doi: 10.1016/j.diabet.2011.01.002. [DOI] [PubMed] [Google Scholar]
- Apelberg BJ, Goldman LR, Calafat AM, Herbstman JB, Kuklenyik Z, Heidler J, Needham LL, Halden RU, and Witter FR. 2007a. “Determinants of fetal exposure to polyfluoroalkyl compounds in Baltimore, Maryland.” Environ Sci Technol 41 (11):3891–7. [DOI] [PubMed] [Google Scholar]
- Apelberg BJ, Witter FR, Herbstman JB, Calafat AM, Halden RU, Needham LL, and Goldman LR. 2007b. “Cord serum concentrations of perfluorooctane sulfonate (PFOS) and perfluorooctanoate (PFOA) in relation to weight and size at birth.” Environ Health Perspect 115 (11):1670–6. doi: 10.1289/ehp.10334. [DOI] [PMC free article] [PubMed] [Google Scholar]
- Ayina CNA, Endomba FTA, Mandengue SH, Noubiap JJN, Ngoa LSE, Boudou P, Gautier JF, Mbanya JC, and Sobngwi E. 2017. “Association of the leptin-to-adiponectin ratio with metabolic syndrome in a sub-Saharan African population.” Diabetol Metab Syndr 9:66. doi: 10.1186/s13098-017-0265-6. [DOI] [PMC free article] [PubMed] [Google Scholar]
- Bao W, Srinivasan SR, Wattigney WA, and Berenson GS. 1994. “Persistence of multiple cardiovascular risk clustering related to syndrome X from childhood to young adulthood. The Bogalusa Heart Study.” Arch Intern Med 154 (16):1842–7. [PubMed] [Google Scholar]
- Bao W, Threefoot SA, Srinivasan SR, and Berenson GS. 1995. “Essential hypertension predicted by tracking of elevated blood pressure from childhood to adulthood: the Bogalusa Heart Study.” Am J Hypertens 8 (7):657–65. doi: 10.1016/0895-7061(95)00116-7. [DOI] [PubMed] [Google Scholar]
- Barker DJ 2000. “In utero programming of cardiovascular disease.” Theriogenology 53 (2):555–74. [DOI] [PubMed] [Google Scholar]
- Berger JP, Akiyama TE, and Meinke PT. 2005. “PPARs: therapeutic targets for metabolic disease.” Trends Pharmacol Sci 26 (5):244–51. doi: 10.1016/j.tips.2005.03.003. [DOI] [PubMed] [Google Scholar]
- Bigornia SJ, LaValley MP, Benfield LL, Ness AR, and Newby PK. 2013. “Relationships between direct and indirect measures of central and total adiposity in children: what are we measuring?” Obesity (Silver Spring) 21 (10):2055–62. doi: 10.1002/oby.20400. [DOI] [PubMed] [Google Scholar]
- Bosy-Westphal A, Booke CA, Blöcker T, Kossel E, Goele K, Later W, Hitze B, Heller M, Glüer CC, and Müller MJ. 2010. “Measurement site for waist circumference affects its accuracy as an index of visceral and abdominal subcutaneous fat in a Caucasian population.” J Nutr 140 (5):954–61. doi: 10.3945/jn.109.118737. [DOI] [PubMed] [Google Scholar]
- Brambilla P, Lissau I, Flodmark CE, Moreno LA, Widhalm K, Wabitsch M, and Pietrobelli A. 2007. “Metabolic risk-factor clustering estimation in children: to draw a line across pediatric metabolic syndrome.” Int J Obes (Lond) 31 (4):591–600. doi: 10.1038/sj.ijo.0803581. [DOI] [PubMed] [Google Scholar]
- Braun JM 2016. “Early-life exposure to EDCs: role in childhood obesity and neurodevelopment.” Nat Rev Endocrinol. doi: 10.1038/nrendo.2016.186. [DOI] [PMC free article] [PubMed] [Google Scholar]
- Braun JM, Gennings C, Hauser R, and Webster TF. 2016. “What Can Epidemiological Studies Tell Us about the Impact of Chemical Mixtures on Human Health?” Environ Health Perspect 124 (1):A6–9. doi: 10.1289/ehp.1510569. [DOI] [PMC free article] [PubMed] [Google Scholar]
- Braun JM, and Gray K. 2017. “Challenges to studying the health effects of early life environmental chemical exposures on children’s health.” PLoS Biol 15 (12):e2002800. doi: 10.1371/journal.pbio.2002800. [DOI] [PMC free article] [PubMed] [Google Scholar]
- Braun JM, Kalloo G, Chen A, Dietrich KN, Liddy-Hicks S, Morgan S, Xu Y, Yolton K, and Lanphear BP. 2017. “Cohort Profile: The Health Outcomes and Measures of the Environment (HOME) study.” Int J Epidemiol 46 (1):24. doi: 10.1093/ije/dyw006. [DOI] [PMC free article] [PubMed] [Google Scholar]
- Braun Joseph, Buckley Jessie, Cecil Kim, Chen Aimin, Kalkwarf Heidi, Lanphear Bruce, Xu Yingying, Woeste Anastasia, and Yolton Kimberly. 2020. “Adolescent follow-up in the Health Outcomes and Measures of the Environment (HOME) Study: cohort profile.” BMJ Open. doi: 10.1136/bmjopen-2019-034838. [DOI] [PMC free article] [PubMed] [Google Scholar]
- Braun Joseph, Chen Aimin, Romano Megan, Calafat Antonia, Webster Glenys, Yolton Kimberly, and Lanphear Bruce. 2016. “Prenatal perfluoroalkyl substance exposure and child adiposity at 8 years of age: The HOME study.” Obesity (Silver Spring) 24 (1):231–237. [DOI] [PMC free article] [PubMed] [Google Scholar]
- Buck RC, Franklin J, Berger U, Conder JM, Cousins IT, de Voogt P, Jensen AA, Kannan K, Mabury SA, and van Leeuwen SP. 2011. “Perfluoroalkyl and polyfluoroalkyl substances in the environment: terminology, classification, and origins.” Integr Environ Assess Manag 7 (4):513–41. doi: 10.1002/ieam.258. [DOI] [PMC free article] [PubMed] [Google Scholar]
- Buckley JP, Hamra GB, and Braun JM. 2019. “Statistical Approaches for Investigating Periods of Susceptibility in Children’s Environmental Health Research.” Curr Environ Health Rep. doi: 10.1007/s40572-019-0224-5. [DOI] [PMC free article] [PubMed] [Google Scholar]
- Buckley JP, Herring AH, Wolff MS, Calafat AM, and Engel SM. 2016. “Prenatal exposure to environmental phenols and childhood fat mass in the Mount Sinai Children’s Environmental Health Study.” Environ Int 91:350–6. doi: 10.1016/j.envint.2016.03.019. [DOI] [PMC free article] [PubMed] [Google Scholar]
- Casas M, Chevrier C, Hond ED, Fernandez MF, Pierik F, Philippat C, Slama R, Toft G, Vandentorren S, Wilhelm M, and Vrijheid M. 2013. “Exposure to brominated flame retardants, perfluorinated compounds, phthalates and phenols in European birth cohorts: ENRIECO evaluation, first human biomonitoring results, and recommendations.” Int J Hyg Environ Health 216 (3):230–42. doi: 10.1016/j.ijheh.2012.05.009. [DOI] [PubMed] [Google Scholar]
- Ceriello A 2008. “Possible role of oxidative stress in the pathogenesis of hypertension.” Diabetes Care 31 Suppl 2:S181–4. doi: 10.2337/dc08-s245. [DOI] [PubMed] [Google Scholar]
- Chen W, Bao W, Begum S, Elkasabany A, Srinivasan SR, and Berenson GS. 2000. “Age-related patterns of the clustering of cardiovascular risk variables of syndrome X from childhood to young adulthood in a population made up of black and white subjects: the Bogalusa Heart Study.” Diabetes 49 (6):1042–8. doi: 10.2337/diabetes.49.6.1042. [DOI] [PubMed] [Google Scholar]
- Chen Z, Hu H, Chen M, Luo X, Yao W, Liang Q, Yang F, and Wang X. 2020. “Association of Triglyceride to high-density lipoprotein cholesterol ratio and incident of diabetes mellitus: a secondary retrospective analysis based on a Chinese cohort study.” Lipids Health Dis 19 (1):33. doi: 10.1186/s12944-020-01213-x. [DOI] [PMC free article] [PubMed] [Google Scholar]
- Chu SY, Jung JH, Park MJ, and Kim SH. 2019. “Risk assessment of metabolic syndrome in adolescents using the triglyceride/high-density lipoprotein cholesterol ratio and the total cholesterol/high-density lipoprotein cholesterol ratio.” Ann Pediatr Endocrinol Metab 24 (1):41–48. doi: 10.6065/apem.2019.24.1.41. [DOI] [PMC free article] [PubMed] [Google Scholar]
- Cordero A, Laclaustra M, León M, Casasnovas JA, Grima A, Luengo E, Ordoñez B, Bergua C, Bes M, Pascual I, Alegría E, and MESYAS Registry Investigators. 2008. “Comparison of serum lipid values in subjects with and without the metabolic syndrome.” Am J Cardiol 102 (4):424–8. doi: 10.1016/j.amjcard.2008.03.079. [DOI] [PubMed] [Google Scholar]
- Costa-Silva JH, Simões-Alves AC, and Fernandes MP. 2016. “Developmental Origins of Cardiometabolic Diseases: Role of the Maternal Diet.” Front Physiol 7:504. doi: 10.3389/fphys.2016.00504. [DOI] [PMC free article] [PubMed] [Google Scholar]
- Czarnota J, Gennings C, and Wheeler DC. 2015. “Assessment of weighted quantile sum regression for modeling chemical mixtures and cancer risk.” Cancer Inform 14 (Suppl 2):159–71. doi: 10.4137/CIN.S17295. [DOI] [PMC free article] [PubMed] [Google Scholar]
- Dai XY, Zheng YY, Tang JN, Yang XM, Guo QQ, Zhang JC, Cheng MD, Song FH, Liu ZY, Wang K, Jiang LZ, Fan L, Yue XT, Bai Y, Zhang ZL, Zheng RJ, and Zhang JY. 2019. “Triglyceride to high-density lipoprotein cholesterol ratio as a predictor of long-term mortality in patients with coronary artery disease after undergoing percutaneous coronary intervention: a retrospective cohort study.” Lipids Health Dis 18 (1):210. doi: 10.1186/s12944-019-1152-y. [DOI] [PMC free article] [PubMed] [Google Scholar]
- Darrow LA, Stein CR, and Steenland K. 2013. “Serum perfluorooctanoic acid and perfluorooctane sulfonate concentrations in relation to birth outcomes in the Mid-Ohio Valley, 2005–2010.” Environ Health Perspect 121 (10):1207–13. doi: 10.1289/ehp.1206372. [DOI] [PMC free article] [PubMed] [Google Scholar]
- Desquilbet L, and Mariotti F. 2010. “Dose-response analyses using restricted cubic spline functions in public health research.” Stat Med 29 (9):1037–57. doi: 10.1002/sim.3841. [DOI] [PubMed] [Google Scholar]
- Domazet SL, Grontved A, Timmermann AG, Nielsen F, and Jensen TK. 2016. “Longitudinal Associations of Exposure to Perfluoroalkylated Substances in Childhood and Adolescence and Indicators of Adiposity and Glucose Metabolism 6 and 12 Years Later: The European Youth Heart Study.” Diabetes Care. doi: 10.2337/dc16-0269. [DOI] [PubMed] [Google Scholar]
- EFSA. 2008. “Perfluoroctane sulfonate, perfluorooctanoic acid and their salts: Scientific opinion of the panel on contaminants in the food chain.” European Food Safety Authority Journal 653:1–131. [DOI] [PMC free article] [PubMed] [Google Scholar]
- Eisenmann JC 2008. “On the use of a continuous metabolic syndrome score in pediatric research.” Cardiovasc Diabetol 7:17. doi: 10.1186/1475-2840-7-17. [DOI] [PMC free article] [PubMed] [Google Scholar]
- Emmett EA, Shofer FS, Zhang H, Freeman D, Desai C, and Shaw LM. 2006. “Community exposure to perfluorooctanoate: relationships between serum concentrations and exposure sources.” J Occup Environ Med 48 (8):759–70. doi: 10.1097/01.jom.0000232486.07658.74. [DOI] [PMC free article] [PubMed] [Google Scholar]
- Fei C, McLaughlin JK, Lipworth L, and Olsen J. 2010. “Maternal concentrations of perfluorooctanesulfonate (PFOS) and perfluorooctanoate (PFOA) and duration of breastfeeding.” Scand J Work Environ Health 36 (5):413–21. [DOI] [PubMed] [Google Scholar]
- Fleisch AF, Rifas-Shiman SL, Mora AM, Calafat AM, Ye X, Luttmann-Gibson H, Gillman MW, Oken E, and Sagiv SK. 2017. “Early-Life Exposure to Perfluoroalkyl Substances and Childhood Metabolic Function.” Environ Health Perspect 125 (3):481–487. doi: 10.1289/EHP303. [DOI] [PMC free article] [PubMed] [Google Scholar]
- Frisbee SJ, Brooks AP, Maher A, Flensborg P, Arnold S, Fletcher T, Steenland K, Shankar A, Knox SS, Pollard C, Halverson JA, Vieira VM, Jin C, Leyden KM, and Ducatman AM. 2009. “The C8 health project: design, methods, and participants.” Environ Health Perspect 117 (12):1873–82. doi: 10.1289/ehp.0800379. [DOI] [PMC free article] [PubMed] [Google Scholar]
- Frisbee SJ, Shankar A, Knox SS, Steenland K, Savitz DA, Fletcher T, and Ducatman AM. 2010. “Perfluorooctanoic acid, perfluorooctanesulfonate, and serum lipids in children and adolescents: results from the C8 Health Project.” Arch Pediatr Adolesc Med 164 (9):860–9. doi: 10.1001/archpediatrics.2010.163. [DOI] [PMC free article] [PubMed] [Google Scholar]
- Frithioff-Bøjsøe C, Lund MAV, Lausten-Thomsen U, Hedley PL, Pedersen O, Christiansen M, Baker JL, Hansen T, and Holm JC. 2020. “Leptin, adiponectin, and their ratio as markers of insulin resistance and cardiometabolic risk in childhood obesity.” Pediatr Diabetes 21 (2):194–202. doi: 10.1111/pedi.12964. [DOI] [PubMed] [Google Scholar]
- Fromme H, Mosch C, Morovitz M, Alba-Alejandre I, Boehmer S, Kiranoglu M, Faber F, Hannibal I, Genzel-Boroviczény O, Koletzko B, and Völkel W. 2010. “Pre- and postnatal exposure to perfluorinated compounds (PFCs).” Environ Sci Technol 44 (18):7123–9. doi: 10.1021/es101184f. [DOI] [PubMed] [Google Scholar]
- Frühbeck G, Catalán V, Rodríguez A, and Gómez-Ambrosi J. 2018. “Adiponectin-leptin ratio: A promising index to estimate adipose tissue dysfunction. Relation with obesity-associated cardiometabolic risk.” Adipocyte 7 (1):57–62. doi: 10.1080/21623945.2017.1402151. [DOI] [PMC free article] [PubMed] [Google Scholar]
- Gillman MW, and Cook NR. 1995. “Blood pressure measurement in childhood epidemiological studies.” Circulation 92:1049–1057. [DOI] [PubMed] [Google Scholar]
- Grandjean P, Andersen EW, Budtz-Jørgensen E, Nielsen F, Mølbak K, Weihe P, and Heilmann C. 2012. “Serum vaccine antibody concentrations in children exposed to perfluorinated compounds.” JAMA 307 (4):391–7. doi: 10.1001/jama.2011.2034. [DOI] [PMC free article] [PubMed] [Google Scholar]
- Guelfo JL, and Adamson DT. 2018. “Evaluation of a national data set for insights into sources, composition, and concentrations of per- and polyfluoroalkyl substances (PFASs) in U.S. drinking water.” Environ Pollut 236:505–513. doi: 10.1016/j.envpol.2018.01.066. [DOI] [PMC free article] [PubMed] [Google Scholar]
- Guenther PM, Casavale KO, Reedy J, Kirkpatrick SI, Hiza HA, Kuczynski KJ, Kahle LL, and Krebs-Smith SM. 2013. “Update of the Healthy Eating Index: HEI-2010.” J Acad Nutr Diet 113 (4):569–80. doi: 10.1016/j.jand.2012.12.016. [DOI] [PMC free article] [PubMed] [Google Scholar]
- Hales CN, and Barker DJ. 2013. “Type 2 (non-insulin-dependent) diabetes mellitus: the thrifty phenotype hypothesis. 1992.” Int J Epidemiol 42 (5):1215–22. doi: 10.1093/ije/dyt133. [DOI] [PubMed] [Google Scholar]
- Halldorsson TI, Rytter D, Haug LS, Bech BH, Danielsen I, Becher G, Henriksen TB, and Olsen SF. 2012. “Prenatal exposure to perfluorooctanoate and risk of overweight at 20 years of age: a prospective cohort study.” Environ Health Perspect 120 (5):668–73. doi: 10.1289/ehp.1104034. [DOI] [PMC free article] [PubMed] [Google Scholar]
- Hamm MP, Cherry NM, Chan E, Martin JW, and Burstyn I. 2010. “Maternal exposure to perfluorinated acids and fetal growth.” J Expo Sci Environ Epidemiol 20 (7):589–97. doi: 10.1038/jes.2009.57. [DOI] [PubMed] [Google Scholar]
- Heindel JJ, and Blumberg B. 2018. “Environmental Obesogens: Mechanisms and Controversies.” Annu Rev Pharmacol Toxicol. doi: 10.1146/annurev-pharmtox-010818-021304. [DOI] [PMC free article] [PubMed] [Google Scholar]
- Heron Melonie. 2018. Deaths: Leading Causes for 2016 National Vital Statistics Reports. Centers for Disease Control and Prevention. [PubMed] [Google Scholar]
- Hines EP, White SS, Stanko JP, Gibbs-Flournoy EA, Lau C, and Fenton SE. 2009. “Phenotypic dichotomy following developmental exposure to perfluorooctanoic acid (PFOA) in female CD-1 mice: Low doses induce elevated serum leptin and insulin, and overweight in mid-life.” Mol Cell Endocrinol 304 (1–2):97–105. doi: 10.1016/j.mce.2009.02.021. [DOI] [PubMed] [Google Scholar]
- Hornung Richard, and Reed Laurence. 1990. “Estimation of Average Concentration in the Presence of Nondetectable Values.” Applied Occupational and Environmental Hygiene 5 (1):46–51. [Google Scholar]
- Hu XC, Andrews DQ, Lindstrom AB, Bruton TA, Schaider LA, Grandjean P, Lohmann R, Carignan CC, Blum A, Balan SA, Higgins CP, and Sunderland EM. 2016. “Detection of Poly- and Perfluoroalkyl Substances (PFASs) in U.S. Drinking Water Linked to Industrial Sites, Military Fire Training Areas, and Wastewater Treatment Plants.” Environ Sci Technol Lett 3 (10):344–350. doi: 10.1021/acs.estlett.6b00260. [DOI] [PMC free article] [PubMed] [Google Scholar]
- Huang Q, Zhang J, Martin FL, Peng S, Tian M, Mu X, and Shen H. 2013. “Perfluorooctanoic acid induces apoptosis through the p53-dependent mitochondrial pathway in human hepatic cells: a proteomic study.” Toxicol Lett 223 (2):211–20. doi: 10.1016/j.toxlet.2013.09.002. [DOI] [PubMed] [Google Scholar]
- Høyer BB, Ramlau-Hansen CH, Vrijheid M, Valvi D, Pedersen HS, Zviezdai V, Jönsson BA, Lindh CH, Bonde JP, and Toft G. 2015. “Anthropometry in 5- to 9-Year-Old Greenlandic and Ukrainian Children in Relation to Prenatal Exposure to Perfluorinated Alkyl Substances.” Environ Health Perspect 123 (8):841–6. doi: 10.1289/ehp.1408881. [DOI] [PMC free article] [PubMed] [Google Scholar]
- Inoue K, Okada F, Ito R, Kato S, Sasaki S, Nakajima S, Uno A, Saijo Y, Sata F, Yoshimura Y, Kishi R, and Nakazawa H. 2004. “Perfluorooctane sulfonate (PFOS) and related perfluorinated compounds in human maternal and cord blood samples: assessment of PFOS exposure in a susceptible population during pregnancy.” Environ Health Perspect 112 (11):1204–7. doi: 10.1289/ehp.6864. [DOI] [PMC free article] [PubMed] [Google Scholar]
- Inoue M, Yano M, Yamakado M, Maehata E, and Suzuki S. 2006. “Relationship between the adiponectin-leptin ratio and parameters of insulin resistance in subjects without hyperglycemia.” Metabolism 55 (9):1248–54. doi: 10.1016/j.metabol.2006.05.010. [DOI] [PubMed] [Google Scholar]
- Isomaa B, Almgren P, Tuomi T, Forsén B, Lahti K, Nissén M, Taskinen MR, and Groop L. 2001. “Cardiovascular morbidity and mortality associated with the metabolic syndrome.” Diabetes Care 24 (4):683–9. doi: 10.2337/diacare.24.4.683. [DOI] [PubMed] [Google Scholar]
- Jackson-Browne MS, Papandonatos GD, Chen A, Calafat AM, Yolton K, Lanphear BP, and Braun JM. 2018. “Identifying Vulnerable Periods of Neurotoxicity to Triclosan Exposure in Children.” Environ Health Perspect 126 (5):057001. doi: 10.1289/EHP2777. [DOI] [PMC free article] [PubMed] [Google Scholar]
- Jain RB 2013. “Effect of pregnancy on the levels of selected perfluoroalkyl compounds for females aged 17–39 years: data from National Health and Nutrition Examination Survey 2003–2008.” J Toxicol Environ Health A 76 (7):409–21. doi: 10.1080/15287394.2013.771547. [DOI] [PubMed] [Google Scholar]
- Jain RB 2018. “Contribution of diet and other factors to the observed levels of selected perfluoroalkyl acids in serum among US children aged 3–11 years.” Environ Res 161:268–275. doi: 10.1016/j.envres.2017.11.018. [DOI] [PubMed] [Google Scholar]
- Janesick AS, and Blumberg B. 2016. “Obesogens: an emerging threat to public health.” Am J Obstet Gynecol. doi: 10.1016/j.ajog.2016.01.182. [DOI] [PMC free article] [PubMed] [Google Scholar]
- Javins B, Hobbs G, Ducatman AM, Pilkerton C, Tacker D, and Knox SS. 2013. “Circulating maternal perfluoroalkyl substances during pregnancy in the C8 Health Study.” Environ Sci Technol 47 (3):1606–13. doi: 10.1021/es3028082. [DOI] [PubMed] [Google Scholar]
- Johnson PI, Sutton P, Atchley DS, Koustas E, Lam J, Sen S, Robinson KA, Axelrad DA, and Woodruff TJ. 2014. “The Navigation Guide - evidence-based medicine meets environmental health: systematic review of human evidence for PFOA effects on fetal growth.” Environ Health Perspect 122 (10):1028–39. doi: 10.1289/ehp.1307893. [DOI] [PMC free article] [PubMed] [Google Scholar]
- Jousilahti P, Tuomilehto J, Korhonen HJ, Vartiainen E, Puska P, and Nissinen A. 1994. “Trends in cardiovascular disease risk factor clustering in eastern Finland: results of 15-year follow-up of the North Karelia Project.” Prev Med 23 (1):6–14. doi: 10.1006/pmed.1994.1002. [DOI] [PubMed] [Google Scholar]
- Kamel M, Smith BT, Wahi G, Carsley S, Birken CS, and Anderson LN. 2018. “Continuous cardiometabolic risk score definitions in early childhood: a scoping review.” Obes Rev 19 (12):1688–1699. doi: 10.1111/obr.12748. [DOI] [PubMed] [Google Scholar]
- Kato K, Basden BJ, Needham LL, and Calafat AM. 2011. “Improved selectivity for the analysis of maternal serum and cord serum for polyfluoroalkyl chemicals.” J Chromatogr A 1218 (15):2133–7. doi: 10.1016/j.chroma.2010.10.051. [DOI] [PubMed] [Google Scholar]
- Kato K, Calafat AM, Wong LY, Wanigatunga AA, Caudill SP, and Needham LL. 2009. “Polyfluoroalkyl compounds in pooled sera from children participating in the National Health and Nutrition Examination Survey 2001–2002.” Environ Sci Technol 43 (7):2641–7. [DOI] [PubMed] [Google Scholar]
- Kelly AS, Steinberger J, Jacobs DR, Hong CP, Moran A, and Sinaiko AR. 2011. “Predicting cardiovascular risk in young adulthood from the metabolic syndrome, its component risk factors, and a cluster score in childhood.” Int J Pediatr Obes 6 (2–2):e283–9. doi: 10.3109/17477166.2010.528765. [DOI] [PMC free article] [PubMed] [Google Scholar]
- Kennedy GL, Butenhoff JL, Olsen GW, O’Connor JC, Seacat AM, Perkins RG, Biegel LB, Murphy SR, and Farrar DG. 2004. “The toxicology of perfluorooctanoate.” Crit Rev Toxicol 34 (4):351–84. doi: 10.1080/10408440490464705. [DOI] [PubMed] [Google Scholar]
- Kim JE, Yu MY, Kim YC, Min SI, Ha J, Lee JP, Kim DK, Oh KH, Joo KW, Ahn C, Kim YS, and Lee H. 2019. “Ratio of triglyceride to high-density lipoprotein cholesterol and risk of major cardiovascular events in kidney transplant recipients.” Clin Exp Nephrol 23 (12):1407–1417. doi: 10.1007/s10157-019-01776-9. [DOI] [PMC free article] [PubMed] [Google Scholar]
- Kim S, Choi K, Ji K, Seo J, Kho Y, Park J, Park S, Hwang I, Jeon J, Yang H, and Giesy JP. 2011. “Trans-placental transfer of thirteen perfluorinated compounds and relations with fetal thyroid hormones.” Environ Sci Technol 45 (17):7465–72. doi: 10.1021/es202408a. [DOI] [PubMed] [Google Scholar]
- Kowalski Kent, Crocker Peter, and Faulkner Robert. 1997. “Validation of the Physical Activity Questionnaire for Older Children.” Pediatric Exercise Science 9 (2):174–186. [Google Scholar]
- Kuklenyik Z, Needham LL, and Calafat AM. 2005. “Measurement of 18 perfluorinated organic acids and amides in human serum using on-line solid-phase extraction.” Anal Chem 77 (18):6085–91. doi: 10.1021/ac050671l. [DOI] [PubMed] [Google Scholar]
- Lacruz ME, Kluttig A, Kuss O, Tiller D, Medenwald D, Nuding S, Greiser KH, Frantz S, and Haerting J. 2017. “Short-term blood pressure variability - variation between arm side, body position and successive measurements: a population-based cohort study.” BMC Cardiovasc Disord 17 (1):31. doi: 10.1186/s12872-017-0468-7. [DOI] [PMC free article] [PubMed] [Google Scholar]
- Lakka HM, Laaksonen DE, Lakka TA, Niskanen LK, Kumpusalo E, Tuomilehto J, and Salonen JT. 2002. “The metabolic syndrome and total and cardiovascular disease mortality in middle-aged men.” JAMA 288 (21):2709–16. doi: 10.1001/jama.288.21.2709. [DOI] [PubMed] [Google Scholar]
- Lann D, and LeRoith D. 2007. “Insulin resistance as the underlying cause for the metabolic syndrome.” Med Clin North Am 91 (6):1063–77, viii. doi: 10.1016/j.mcna.2007.06.012. [DOI] [PubMed] [Google Scholar]
- Lau C, Anitole K, Hodes C, Lai D, Pfahles-Hutchens A, and Seed J. 2007. “Perfluoroalkyl acids: a review of monitoring and toxicological findings.” Toxicol Sci 99 (2):366–94. doi: 10.1093/toxsci/kfm128. [DOI] [PubMed] [Google Scholar]
- Lee YJ, Kim MK, Bae J, and Yang JH. 2013. “Concentrations of perfluoroalkyl compounds in maternal and umbilical cord sera and birth outcomes in Korea.” Chemosphere 90 (5):1603–9. doi: 10.1016/j.chemosphere.2012.08.035. [DOI] [PubMed] [Google Scholar]
- Li N, Papandonatos GD, Calafat AM, Yolton K, Lanphear BP, Chen A, and Braun JM. 2019. “Identifying periods of susceptibility to the impact of phthalates on children’s cognitive abilities.” Environ Res 172:604–614. doi: 10.1016/j.envres.2019.03.009. [DOI] [PMC free article] [PubMed] [Google Scholar]
- Liese AD, Mayer-Davis EJ, and Haffner SM. 1998. “Development of the multiple metabolic syndrome: an epidemiologic perspective.” Epidemiol Rev 20 (2):157–72. doi: 10.1093/oxfordjournals.epirev.a017978. [DOI] [PubMed] [Google Scholar]
- Lin PD, Cardenas A, Hauser R, Gold DR, Kleinman KP, Hivert MF, Calafat AM, Webster TF, Horton ES, and Oken E. 2020. “Per- and polyfluoroalkyl substances and blood pressure in pre-diabetic adults-cross-sectional and longitudinal analyses of the diabetes prevention program outcomes study.” Environ Int 137:105573. doi: 10.1016/j.envint.2020.105573. [DOI] [PMC free article] [PubMed] [Google Scholar]
- Liu C, Yu K, Shi X, Wang J, Lam PK, Wu RS, and Zhou B. 2007. “Induction of oxidative stress and apoptosis by PFOS and PFOA in primary cultured hepatocytes of freshwater tilapia (Oreochromis niloticus).” Aquat Toxicol 82 (2):135–43. doi: 10.1016/j.aquatox.2007.02.006. [DOI] [PubMed] [Google Scholar]
- Lv Z, Li G, Li Y, Ying C, Chen J, Chen T, Wei J, Lin Y, Jiang Y, Wang Y, Shu B, Xu B, and Xu S. 2013. “Glucose and lipid homeostasis in adult rat is impaired by early-life exposure to perfluorooctane sulfonate.” Environ Toxicol 28 (9):532–42. doi: 10.1002/tox.20747. [DOI] [PubMed] [Google Scholar]
- López-Jaramillo P, Gómez-Arbeláez D, López-López J, López-López C, Martínez-Ortega J, Gómez-Rodríguez A, and Triana-Cubillos S. 2014. “The role of leptin/adiponectin ratio in metabolic syndrome and diabetes.” Horm Mol Biol Clin Investig 18 (1):37–45. doi: 10.1515/hmbci-2013-0053. [DOI] [PubMed] [Google Scholar]
- Mahjoub S, and Masrour-Roudsari J. 2012. “Role of oxidative stress in pathogenesis of metabolic syndrome.” Caspian J Intern Med 3 (1):386–96. [PMC free article] [PubMed] [Google Scholar]
- Maisonet M, Näyhä S, Lawlor DA, and Marcus M. 2015. “Prenatal exposures to perfluoroalkyl acids and serum lipids at ages 7 and 15 in females.” Environ Int 82:49–60. doi: 10.1016/j.envint.2015.05.001. [DOI] [PubMed] [Google Scholar]
- Maisonet M, Terrell ML, McGeehin MA, Christensen KY, Holmes A, Calafat AM, and Marcus M. 2012. “Maternal concentrations of polyfluoroalkyl compounds during pregnancy and fetal and postnatal growth in British girls.” Environ Health Perspect 120 (10):1432–7. doi: 10.1289/ehp.1003096. [DOI] [PMC free article] [PubMed] [Google Scholar]
- Manzano-Salgado CB, Casas M, Lopez-Espinosa MJ, Ballester F, Basterrechea M, Grimalt JO, Jiménez AM, Kraus T, Schettgen T, Sunyer J, and Vrijheid M. 2015. “Transfer of perfluoroalkyl substances from mother to fetus in a Spanish birth cohort.” Environ Res 142:471–8. doi: 10.1016/j.envres.2015.07.020. [DOI] [PubMed] [Google Scholar]
- Manzano-Salgado CB, Casas M, Lopez-Espinosa MJ, Ballester F, Iñiguez C, Martinez D, Romaguera D, Fernández-Barrés S, Santa-Marina L, Basterretxea M, Schettgen T, Valvi D, Vioque J, Sunyer J, and Vrijheid M. 2017. “Prenatal Exposure to Perfluoroalkyl Substances and Cardiometabolic Risk in Children from the Spanish INMA Birth Cohort Study.” Environ Health Perspect 125 (9):097018. doi: 10.1289/EHP1330. [DOI] [PMC free article] [PubMed] [Google Scholar]
- Matilla-Santander N, Valvi D, Lopez-Espinosa MJ, Manzano-Salgado CB, Ballester F, Ibarluzea J, Santa-Marina L, Schettgen T, Guxens M, Sunyer J, and Vrijheid M. 2017. “Exposure to Perfluoroalkyl Substances and Metabolic Outcomes in Pregnant Women: Evidence from the Spanish INMA Birth Cohorts.” Environ Health Perspect 125 (11):117004. doi: 10.1289/ehp1062. [DOI] [PMC free article] [PubMed] [Google Scholar]
- Matthews DR, Hosker JP, Rudenski AS, Naylor BA, Treacher DF, and Turner RC. 1985. “Homeostasis model assessment: insulin resistance and beta-cell function from fasting plasma glucose and insulin concentrations in man.” Diabetologia 28 (7):412–9. [DOI] [PubMed] [Google Scholar]
- McLaughlin T, Reaven G, Abbasi F, Lamendola C, Saad M, Waters D, Simon J, and Krauss RM. 2005. “Is there a simple way to identify insulin-resistant individuals at increased risk of cardiovascular disease?” Am J Cardiol 96 (3):399–404. doi: 10.1016/j.amjcard.2005.03.085. [DOI] [PubMed] [Google Scholar]
- Monroy R, Morrison K, Teo K, Atkinson S, Kubwabo C, Stewart B, and Foster WG. 2008. “Serum levels of perfluoroalkyl compounds in human maternal and umbilical cord blood samples.” Environ Res 108 (1):56–62. doi: 10.1016/j.envres.2008.06.001. [DOI] [PubMed] [Google Scholar]
- Mora AM, Fleisch AF, Rifas-Shiman SL, Woo Baidal JA, Pardo L, Webster TF, Calafat AM, Ye X, Oken E, and Sagiv SK. 2018. “Early life exposure to per- and polyfluoroalkyl substances and mid-childhood lipid and alanine aminotransferase levels.” Environ Int 111:1–13. doi: 10.1016/j.envint.2017.11.008. [DOI] [PMC free article] [PubMed] [Google Scholar]
- Mora AM, Oken E, Rifas-Shiman SL, Webster TF, Gillman MW, Calafat AM, Ye X, and Sagiv SK. 2017. “Prenatal Exposure to Perfluoroalkyl Substances and Adiposity in Early and Mid-Childhood.” Environ Health Perspect 125 (3):467–473. doi: 10.1289/EHP246. [DOI] [PMC free article] [PubMed] [Google Scholar]
- Mullur R, Liu YY, and Brent GA. 2014. “Thyroid hormone regulation of metabolism.” Physiol Rev 94 (2):355–82. doi: 10.1152/physrev.00030.2013. [DOI] [PMC free article] [PubMed] [Google Scholar]
- Nakamura T, Tokunaga K, Shimomura I, Nishida M, Yoshida S, Kotani K, Islam AH, Keno Y, Kobatake T, Nagai Y, and et al. 1994. “Contribution of visceral fat accumulation to the development of coronary artery disease in non-obese men.” Atherosclerosis 107 (2):239–46. [DOI] [PubMed] [Google Scholar]
- National High Blood Pressure Education Program Working Group on High Blood Pressure in, Children, and Adolescents. 2004. “The fourth report on the diagnosis, evaluation, and treatment of high blood pressure in children and adolescents.” Pediatrics 114 (2 Suppl 4th Report):555–76. [PubMed] [Google Scholar]
- Navas-Acien A, Silbergeld EK, Streeter RA, Clark JM, Burke TA, and Guallar E. 2006. “Arsenic exposure and type 2 diabetes: a systematic review of the experimental and epidemiological evidence.” Environ Health Perspect 114 (5):641–8. doi: 10.1289/ehp.8551. [DOI] [PMC free article] [PubMed] [Google Scholar]
- Nelson JW, Hatch EE, and Webster TF. 2010. “Exposure to polyfluoroalkyl chemicals and cholesterol, body weight, and insulin resistance in the general U.S. population.” Environ Health Perspect 118 (2):197–202. doi: 10.1289/ehp.0901165. [DOI] [PMC free article] [PubMed] [Google Scholar]
- Olsen GW, Burris JM, Ehresman DJ, Froehlich JW, Seacat AM, Butenhoff JL, and Zobel LR. 2007. “Half-life of serum elimination of perfluorooctanesulfonate,perfluorohexanesulfonate, and perfluorooctanoate in retired fluorochemical production workers.” Environ Health Perspect 115 (9):1298–305. doi: 10.1289/ehp.10009. [DOI] [PMC free article] [PubMed] [Google Scholar]
- Pan Y, Zhu Y, Zheng T, Cui Q, Buka SL, Zhang B, Guo Y, Xia W, Yeung LW, Li Y, Zhou A, Qiu L, Liu H, Jiang M, Wu C, Xu S, and Dai J. 2017. “Novel Chlorinated Polyfluorinated Ether Sulfonates and Legacy Per-/Polyfluoroalkyl Substances: Placental Transfer and Relationship with Serum Albumin and Glomerular Filtration Rate.” Environ Sci Technol 51 (1):634–644. doi: 10.1021/acs.est.6b04590. [DOI] [PubMed] [Google Scholar]
- Panaretakis T, Shabalina IG, Grandér D, Shoshan MC, and DePierre JW. 2001. “Reactive oxygen species and mitochondria mediate the induction of apoptosis in human hepatoma HepG2 cells by the rodent peroxisome proliferator and hepatocarcinogen, perfluorooctanoic acid.” Toxicol Appl Pharmacol 173 (1):56–64. doi: 10.1006/taap.2001.9159. [DOI] [PubMed] [Google Scholar]
- Perloff D, Grim C, Flack J, Frohlich ED, Hill M, McDonald M, and Morgenstern BZ. 1993. “Human blood pressure determination by sphygmomanometry. AHA Medical/Scientific Statement.” Circulation 88:2460–2470. [DOI] [PubMed] [Google Scholar]
- Pilz S, Scharnagl H, Tiran B, Seelhorst U, Wellnitz B, Boehm BO, Schaefer JR, and März W. 2006. “Free fatty acids are independently associated with all-cause and cardiovascular mortality in subjects with coronary artery disease.” J Clin Endocrinol Metab 91 (7):2542–7. doi: 10.1210/jc.2006-0195. [DOI] [PubMed] [Google Scholar]
- Piña-Aguero MI, Zaldivar-Delgado A, Salas-Fernández A, Martínez-Basila A, Bernabe-Garcia M, and Maldonado-Hernández J. 2018. “Optimal Cut-off Points of Fasting and Post-Glucose Stimulus Surrogates of Insulin Resistance as Predictors of Metabolic Syndrome in Adolescents According to Several Definitions.” J Clin Res Pediatr Endocrinol 10 (2):139–146. doi: 10.4274/jcrpe.4873. [DOI] [PMC free article] [PubMed] [Google Scholar]
- Rice D, and Barone S. 2000. “Critical periods of vulnerability for the developing nervous system: evidence from humans and animal models.” Environ Health Perspect 108 Suppl 3:511–33. [DOI] [PMC free article] [PubMed] [Google Scholar]
- Sanchez BN, Hu H, Litman HJ, and Tellez-Rojo MM. 2011. “Statistical methods to study timing of vulnerability with sparsely sampled data on environmental toxicants.” Environ Health Perspect 119 (3):409–15. doi: 10.1289/ehp.100245310.1289/ehp.1102453. [DOI] [PMC free article] [PubMed] [Google Scholar]
- Schecter A, Malik-Bass N, Calafat AM, Kato K, Colacino JA, Gent TL, Hynan LS, Harris TR, Malla S, and Birnbaum L. 2012. “Polyfluoroalkyl compounds in Texas children from birth through 12 years of age.” Environ Health Perspect 120 (4):590–4. doi: 10.1289/ehp.1104325. [DOI] [PMC free article] [PubMed] [Google Scholar]
- Shelly C, Grandjean P, Oulhote Y, Plomgaard P, Frikke-Schmidt R, Nielsen F, Zmirou-Navier D, Weihe P, and Valvi D. 2019. “Early Life Exposures to Perfluoroalkyl Substances in Relation to Adipokine Hormone Levels at Birth and During Childhood.” J Clin Endocrinol Metab 104 (11):5338–5348. doi: 10.1210/jc.2019-00385. [DOI] [PMC free article] [PubMed] [Google Scholar]
- Skuladottir M, Ramel A, Rytter D, Haug LS, Sabaredzovic A, Bech BH, Henriksen TB, Olsen SF, and Halldorsson TI. 2015. “Examining confounding by diet in the association between perfluoroalkyl acids and serum cholesterol in pregnancy.” Environ Res 143 (Pt A):33–8. doi: 10.1016/j.envres.2015.09.001. [DOI] [PubMed] [Google Scholar]
- Snijder MB, van Dam RM, Visser M, and Seidell JC. 2006. “What aspects of body fat are particularly hazardous and how do we measure them?” Int J Epidemiol 35 (1):83–92. doi: 10.1093/ije/dyi253. [DOI] [PubMed] [Google Scholar]
- Sovio U, Skow A, Falconer C, Park MH, Viner RM, and Kinra S. 2013. “Improving prediction algorithms for cardiometabolic risk in children and adolescents.” J Obes 2013:684782. doi: 10.1155/2013/684782. [DOI] [PMC free article] [PubMed] [Google Scholar]
- Stacy SL, Papandonatos GD, Calafat AM, Chen A, Yolton K, Lanphear BP, and Braun JM. 2017. “Early life bisphenol A exposure and neurobehavior at 8years of age: Identifying windows of heightened vulnerability.” Environ Int 107:258–265. doi: 10.1016/j.envint.2017.07.021. [DOI] [PMC free article] [PubMed] [Google Scholar]
- Staels B, and Fruchart JC. 2005. “Therapeutic roles of peroxisome proliferator-activated receptor agonists.” Diabetes 54 (8):2460–70. doi: 10.2337/diabetes.54.8.2460. [DOI] [PubMed] [Google Scholar]
- Steenland K, Fletcher T, and Savitz DA. 2010. “Epidemiologic evidence on the health effects of perfluorooctanoic acid (PFOA).” Environ Health Perspect 118 (8):1100–8. doi: 10.1289/ehp.0901827. [DOI] [PMC free article] [PubMed] [Google Scholar]
- Strandberg TE, and Pitkala K. 2003. “What is the most important component of blood pressure: systolic, diastolic or pulse pressure?” Curr Opin Nephrol Hypertens 12 (3):293–7. doi: 10.1097/00041552-200305000-00011. [DOI] [PubMed] [Google Scholar]
- Takacs ML, and Abbott BD. 2007. “Activation of mouse and human peroxisome proliferator-activated receptors (alpha, beta/delta, gamma) by perfluorooctanoic acid and perfluorooctane sulfonate.” Toxicol Sci 95 (1):108–17. doi: 10.1093/toxsci/kfl135. [DOI] [PubMed] [Google Scholar]
- Tan X, Xie G, Sun X, Li Q, Zhong W, Qiao P, Jia W, and Zhou Z. 2013. “High fat diet feeding exaggerates perfluorooctanoic acid-induced liver injury in mice via modulating multiple metabolic pathways.” PLoS One 8 (4):e61409. doi: 10.1371/journal.pone.0061409. [DOI] [PMC free article] [PubMed] [Google Scholar]
- Tanner EM, Bornehag CG, and Gennings C. 2019. “Repeated holdout validation for weighted quantile sum regression.” MethodsX 6:2855–2860. doi: 10.1016/j.mex.2019.11.008. [DOI] [PMC free article] [PubMed] [Google Scholar]
- Trasande L, Shaffer RM, Sathyanarayana S, and Health Council On Environmental. 2018. “Food Additives and Child Health.” Pediatrics 142 (2). doi: 10.1542/peds.2018-1410. [DOI] [PMC free article] [PubMed] [Google Scholar]
- van der Laan MJ, Polley EC, and Hubbard AE. 2007. “Super learner.” Stat Appl Genet Mol Biol 6:Article25. doi: 10.2202/1544-6115.1309. [DOI] [PubMed] [Google Scholar]
- Vega GL, Barlow CE, Grundy SM, Leonard D, and DeFina LF. 2014. “Triglyceride-to-high-density-lipoprotein-cholesterol ratio is an index of heart disease mortality and of incidence of type 2 diabetes mellitus in men.” J Investig Med 62 (2):345–9. doi: 10.2310/JIM.0000000000000044. [DOI] [PubMed] [Google Scholar]
- Väistö J, Eloranta AM, Viitasalo A, Tompuri T, Lintu N, Karjalainen P, Lampinen EK, Ågren J, Laaksonen DE, Lakka HM, Lindi V, and Lakka TA. 2014. “Physical activity and sedentary behaviour in relation to cardiometabolic risk in children: cross-sectional findings from the Physical Activity and Nutrition in Children (PANIC) Study.” Int J Behav Nutr Phys Act 11:55. doi: 10.1186/1479-5868-11-55. [DOI] [PMC free article] [PubMed] [Google Scholar]
- Wan HT, Zhao YG, Leung PY, and Wong CK. 2014. “Perinatal exposure to perfluorooctane sulfonate affects glucose metabolism in adult offspring.” PLoS One 9 (1):e87137. doi: 10.1371/journal.pone.0087137. [DOI] [PMC free article] [PubMed] [Google Scholar]
- Wang ZM, Heymsfield SB, Chen Z, Zhu SK, and Pierson RN. 2010. “Estimation of percentage body fat by dual-energy x-ray absorptiometry: evaluation by in vivo human elemental composition.” Physics in Medicine and Biology 55 (9):2619–2635. doi: 10.1088/0031-9155/55/9/013. [DOI] [PMC free article] [PubMed] [Google Scholar]
- Warembourg C, Maitre L, Tamayo-Uria I, Fossati S, Roumeliotaki T, Aasvang GM, Andrusaityte S, Casas M, Cequier E, Chatzi L, Dedele A, Gonzalez JR, Gražulevičienė R, Haug LS, Hernandez-Ferrer C, Heude B, Karachaliou M, Krog NH, McEachan R, Nieuwenhuijsen M, Petraviciene I, Quentin J, Robinson O, Sakhi AK, Slama R, Thomsen C, Urquiza J, Vafeiadi M, West J, Wright J, Vrijheid M, and Basagaña X. 2019. “Early-Life Environmental Exposures and Blood Pressure in Children.” J Am Coll Cardiol 74 (10):1317–1328. doi: 10.1016/j.jacc.2019.06.069. [DOI] [PMC free article] [PubMed] [Google Scholar]
- Watson K 2007. “Managing cardiometabolic risk: an evolving approach to patient care.” Crit Pathw Cardiol 6 (1):5–14. doi: 10.1097/01.hpc.0000255063.43838.6d. [DOI] [PubMed] [Google Scholar]
- Webber LS, Srinivasan SR, Wattigney WA, and Berenson GS. 1991. “Tracking of serum lipids and lipoproteins from childhood to adulthood. The Bogalusa Heart Study.” Am J Epidemiol 133 (9):884–99. doi: 10.1093/oxfordjournals.aje.a115968. [DOI] [PubMed] [Google Scholar]
- White SS, Fenton SE, and Hines EP. 2011. “Endocrine disrupting properties of perfluorooctanoic acid.” J Steroid Biochem Mol Biol 127 (1–2):16–26. doi: 10.1016/j.jsbmb.2011.03.011. [DOI] [PMC free article] [PubMed] [Google Scholar]
- Whitworth KW, Haug LS, Baird DD, Becher G, Hoppin JA, Skjaerven R, Thomsen C, Eggesbo M, Travlos G, Wilson R, Cupul-Uicab LA, Brantsaeter AL, and Longnecker MP. 2012. “Perfluorinated compounds in relation to birth weight in the Norwegian Mother and Child Cohort Study.” Am J Epidemiol 175 (12):1209–16. doi: 10.1093/aje/kwr459. [DOI] [PMC free article] [PubMed] [Google Scholar]
- World Health Organization. 2018. “The top 10 causes of death.” Last Modified May 24, 2018, accessed September 9 http://www.who.int/en/news-room/fact-sheets/detail/the-top-10-causes-of-death.
- Wielsøe M, Long M, Ghisari M, and Bonefeld-Jørgensen EC. 2015. “Perfluoroalkylated substances (PFAS) affect oxidative stress biomarkers in vitro.” Chemosphere 129:239–45. doi: 10.1016/j.chemosphere.2014.10.014. [DOI] [PubMed] [Google Scholar]
- Woodruff TJ, Zota AR, and Schwartz JM. 2011. “Environmental chemicals in pregnant women in the United States: NHANES 2003–2004.” Environ Health Perspect 119 (6):878–85. doi: 10.1289/ehp.1002727. [DOI] [PMC free article] [PubMed] [Google Scholar]
- Ye X, Kato K, Wong LY, Jia T, Kalathil A, Latremouille J, and Calafat AM. 2018. “Per- and polyfluoroalkyl substances in sera from children 3 to 11 years of age participating in the National Health and Nutrition Examination Survey 2013–2014.” Int J Hyg Environ Health 221 (1):9–16. doi: 10.1016/j.ijheh.2017.09.011. [DOI] [PMC free article] [PubMed] [Google Scholar]
- Zhang MZ, Hu T, Zhang SY, and Zhou L. 2015. “Associations of Different Adipose Tissue Depots with Insulin Resistance: A Systematic Review and Meta-analysis of Observational Studies.” Scientific Reports 5. doi: ARTN 1849510.1038/srep18495. [DOI] [PMC free article] [PubMed] [Google Scholar]
- Zhao B, Lian Q, Chu Y, Hardy DO, Li XK, and Ge RS. 2011. “The inhibition of human and rat 11β-hydroxysteroid dehydrogenase 2 by perfluoroalkylated substances.” J Steroid Biochem Mol Biol 125 (1–2):143–7. doi: 10.1016/j.jsbmb.2010.12.017. [DOI] [PubMed] [Google Scholar]
Associated Data
This section collects any data citations, data availability statements, or supplementary materials included in this article.