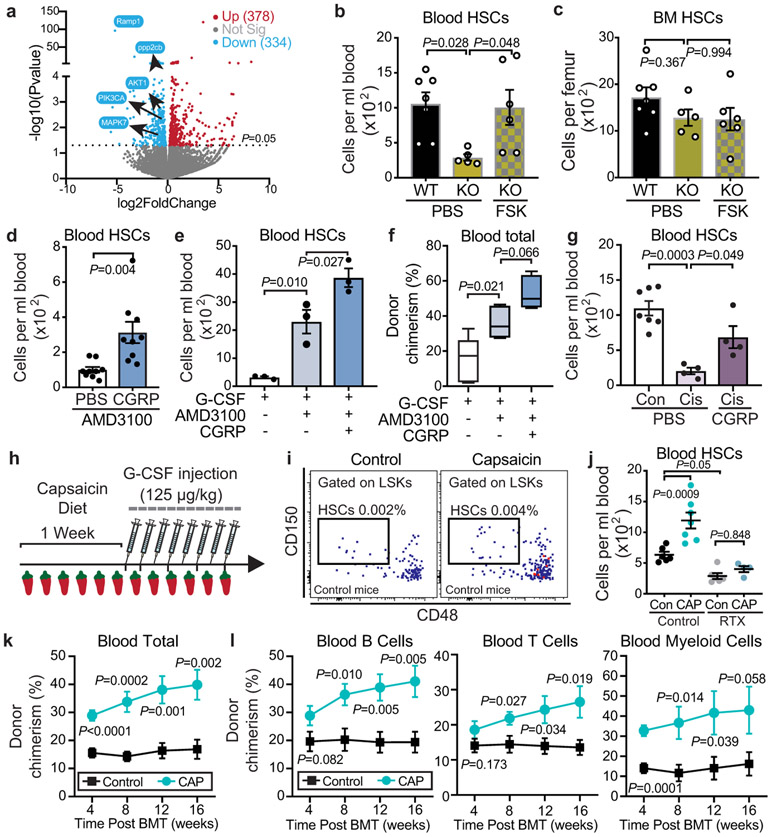
Figure. 4. CGRP amplifies HSC mobilization via the Gαs/AC/cAMP pathway.
a, Volcano plot showing differentially expressed genes (P<0.05) in Ramp1−/− compared to Ramp1+/+ HSCs. b, c, Absolute numbers of HSCs per mL of blood or per femur following G-CSF administration in Ramp1+/+ and Ramp1−/− mice treated with vehicle or forskolin. n=7,5,6 mice, respectively. d, HSC numbers in plerixafor-mobilized blood from saline or CGRP-treated mice. n=9 mice per group. e, HSCs per mL of blood from mice treated with G-CSF, G-CSF+AMD3100 or G-CSF+AMD3100+CGRP. n=3 mice per group. f, Blood donor chimerism (CD45.2) in CD45.1-recipient mice transplanted with mobilized blood (CD45.2) mixed with CD45.1 competitor BM cells, 16 weeks post-transplantation. n=5 mice per group. g, HSC numbers in G-CSF-mobilized blood of saline or cisplatin-treated mice with or without CGRP administration. n=7,4,4 mice, respectively. h, Experimental design to determine the effect of capsaicin diet on HSC mobilization. i, j, Representative gating strategy and quantification of HSCs per mL of blood following G-CSF administration in saline or RTX-treated mice fed on control or capsaicin-containing diet. n=6,7,6,4 mice, respectively. k, l, Blood leukocyte chimerism in CD45.1-recipient mice transplanted with mobilized blood (CD45.2) derived from mice fed on control or capsaicin diet mixed with CD45.1 competitor BM cells. n=9 mice per group. Error bars represent s.e.m. Two-tailed unpaired Student’s t test (d,k,l) or one-way ANOVA for (b,c,e,f,g,j). For box plots, the box spans from the 25th to 75th percentiles and the centerline shows the median. Whiskers represent minimum to maximum range.

