Abstract
This study aims to determine the impacts of drying method and excipient on changes in protein structure and physical stability of model protein solids. Protein solids containing one of two model proteins (lysozyme or myoglobin) were produced with or without excipients (sucrose or mannitol) using freeze drying or spray freeze drying (SFD). The protein powders were then characterized using solid-state Fourier transform infrared spectroscopy (ssFTIR), differential scanning calorimetry (DSC), circular dichroism spectrometry (CD), size exclusion chromatography (SEC), BET surface area measurements and solid-state hydrogen deuterium exchange with mass spectrometry (ssHDX-MS). ssFTIR and CD could identify little to no difference in structure of the proteins in the formulation. ssHDX-MS was able to identify the population heterogeneity, which was undetectable by conventional characterization techniques of ssFTIR and CD. ssHDX-MS metrics such as Dmax and peak area showed a good correlation with the protein physical instability (loss of the monomeric peak area by size exclusion chromatography) in 90-day stability studies conducted at 40°C for lysozyme. Higher specific surface area was associated with greater loss in monomer content for myoglobin-mannitol formulations as compared to myoglobin-only formulations. Spray freeze drying seems a viable manufacturing technique for protein solids with appropriate optimization of formulations. The differences observed within the formulations and between the processes using ssHDX-MS, BET surface area measurements and SEC in this study provide an insight into the influence of drying methods and excipients on protein physical stability.
Keywords: Freeze drying, spray freeze drying, protein structure, biopharmaceutical processing, solid formulation, solid-state hydrogen/deuterium exchange with mass spectrometric analysis (ssHDX-MS)
Graphical Abstract
Introduction
Solid formulations of proteins often offer enhanced physical and chemical stability as compared to their solution counterparts, although this stability is dependent on the excipient type, protein-to-excipient ratio, protein concentration and drying method (Cicerone et al., 2015). Currently, freeze drying or lyophilization is the most widely used technique to produce solid formulations of proteins. In this process, the protein solution is first frozen, and water is then sublimed during primary drying. Secondary drying removes additional moisture and achieves the product’s desired final moisture content (Carpenter et al., 2002). Freeze drying has several disadvantages: 1) it is a batch process; 2) it is time-consuming; 3) it is energy intensive with low energy usage efficiency; 4) the produced solid has a cake-like form. Additional processing such as milling may be required to produce particles for applications such as needle-free ballistic injections or inhalation therapies (Burkoth et al., 1999; Costantino et al., 2000). Furthermore, lyophilization induces stresses such as cold denaturation, exposure to ice-water interfaces and freeze-concentration, which can damage the protein (Chang et al., 2005).
Spray drying is also used to produce protein solid formulations (Langford et al., 2018). Spray drying is high throughput and the properties of the spray dried particles can be manipulated to achieve desired flowability (Maa and Prestrelski, 2000). Exubera, an inhalable insulin product, and Raplixa, a blend of thrombin and fibrinogen powders, are both produced using spray drying (Lee, 2002; White et al., 2005). However, the stresses generated by spray drying, including relatively high temperature, may negatively affect protein structure and stability (Abdul-Fattah et al., 2007; Manning et al., 2010).
Spray freeze drying is a relatively new technique that produces powders without high temperature stress (Sonner et al., 2002). Spray freeze drying consists of three steps: 1) generation of solution droplets; 2) freezing of the droplets; 3) drying of the particles. Excipients such as sucrose, trehalose and mannitol are commonly used in the formulations to retain the protein structure and enhance storage stability. The use of these excipients has been studied extensively (Costantino et al., 1998; Koshari et al., 2017; Yoshioka et al., 1999). Despite this, there is a need to study the effects of the processing conditions and their interactions with the formulation on protein structure and stability (Abdul-Fattah et al., 2007; Koshari et al., 2017; Moussa et al., 2018; Wilson et al., 2019). For example, although mannitol has been extensively used in SFD of protein solids (Sonner et al., 2002), adding mannitol to freeze dried or spray dried proteins leads to physical instability (e.g. aggregation) due to the crystallization of mannitol during processing and storage (Costantino et al., 1998).
Traditionally, solid-state Fourier-transform infrared (ssFTIR), circular dichroism (CD) and fluorescence spectroscopies are used to detect changes in secondary and tertiary solid-state protein structures (Koshari et al., 2017; Schüle et al., 2007; Souillac et al., 2002). These methods provide information about global structural changes but often cannot give detailed information about more subtle local structural changes that may affect storage stability. Examining the local environment of the protein molecules in the dried state at a higher resolution than that achieved with traditional methods may facilitate in designing formulations with better long-term storage stability. Solid-state hydrogen/deuterium exchange with mass spectrometry (ssHDX-MS) is one such high-resolution technique that has shown good correlation between the amount of deuterium incorporation and protein physical stability (Moorthy et al., 2014; Moorthy et al., 2018; Wilson et al., 2020; Wilson et al., 2019). ssHDX-MS has been used to analyze the effects of processing methods like lyophilization (Moorthy et al., 2014; Moorthy et al., 2018) and spray drying (Moussa et al., 2018; Wilson et al., 2020; Wilson et al., 2019) on protein conformation in the solid state, in some cases showing conformational sub-populations.
In this report, protein conformation and physical stability were compared between formulations produced either by freeze drying or by spray freeze drying. Two model proteins – lysozyme and myoglobin – were formulated either with sucrose, mannitol or without any excipients and processed using either freeze drying or spray freeze drying. The excipient and formulations were selected based on previous studies (Moussa et al., 2018; Wilson et al., 2020; Wilson et al., 2019). Sucrose, mannitol, and no excipient formulations are chosen in this study because sucrose is a known and very widely used stabilizing excipient while a lack of excipient or an excipient that phase separates from the protein i.e., crystallized mannitol, results in destabilization of the protein. This variation in formulations was done so as to understand the differences in the processes and the effect the processes on the excipients and in turn on the stability of the proteins. The dried formulations were then characterized using ssFTIR, CD spectroscopy, powder X-ray diffraction, modulated differential scanning calorimetry, BET surface area measurements and ssHDX-MS. Physical stability studies were performed by determining the loss in the monomeric peak area using size exclusion chromatography.
Experimental
Materials
Lysozyme from chicken egg white, myoglobin from equine skeletal muscle, sucrose and D-mannitol were purchased from Sigma Aldrich (St. Louis, MO). Protein solutions were dialyzed at 4°C using Slide-A-Lyzer™ dialysis cassettes (Thermo Scientific, Rockford, IL) in a 2.5 mM phosphate buffer solution. Phosphoric acid was used when necessary to adjust the pH of buffer solution to 6.8. Dialyzed solutions were then diluted to obtain final solutions with or without excipients for a total solid content of 20 mg/mL (Table S1). The final solutions were filled into 2R borosilicate glass vials (200 μL per vial) for freeze drying or spray freeze drying.
Spray Freeze Drying
An ultrasonic nozzle (Büchi, New Castle, DE) was used to disperse the solution into a 250 mL borosilicate glass beaker containing liquid nitrogen at 3 mL/min flowrate. Upon evaporation of the liquid nitrogen, the frozen particles were transferred to 20 mL borosilicate vials for drying. The drying step was performed using a Revo® laboratory-scale lyophilizer (MillRock Technology, Kingston, NY). Vials were loaded at a shelf temperature of −4°C. Once loading was complete, primary drying was initiated by decreasing the chamber pressure to 70 mTorr and decreasing the shelf temperature to −35°C for 24h. After primary drying was complete, secondary drying was performed by increasing the temperature to 25°C for 16h while maintaining the chamber pressure at 70 mTorr.
Freeze Drying
Freeze drying occurred by freezing the solutions in the 2mL 2R borosilicate glass vials, which were submerged into liquid nitrogen, followed by drying using a Revo® laboratory-scale lyophilizer (MillRock Technology, Kingston, NY). The freezing was done using liquid nitrogen to have faster freezing rates as controlled nucleation was done in previous study for similar formulations (Moussa et al., 2018; Wilson et al., 2019). The shelf temperature was held at −25°C while the vials were being loaded to prevent melting of the frozen solutions. The vials were equilibrated for 5 min and the primary drying cycle was initiated by decreasing the chamber pressure to 70mTorr and decreasing the temperature to −35°C for 24h. The chamber pressure was maintained at 70mTorr and the temperature increased to 25°C for 12h for secondary drying. A 10% vial fill volume was chosen so that each 2mL vial had 4 mg of the sample after drying.
Karl Fischer Titration for Moisture Content Analysis
The moisture content of the freeze dried and spray freeze dried powders was determined by coulometric titration using an 831 KF Coulometer (Metrohm, Riverview, FL). One mL of anhydrous methanol (septum sealed bottle DriSolv®, Sigma Aldrich, St. Louis, MO) was used to reconstitute the powder. The reconstituted suspensions were injected into the cell and Riedel-de Haën Hydranal® Coulomat reagent (Honeywell Research Chemicals, Seelze, Germany) was used for titration until the end point was reached.
X-ray Powder Diffraction
A Rigaku SmartLab X-ray diffractometer (The Woodlands, TX) with Bragg-Brentano geometry and a Cu Kα X-ray source was used to determine crystallinity in the freeze dried and spray freeze dried powders. Samples were removed from the vials and flattened onto a glass slide, which was then loaded for analysis. Diffraction intensity was measured as a function of 2θ between 4 and 40 degrees with a scanning rate of 4°/min and a step size of 0.02°.
Solid-State Fourier Transform Infrared Spectroscopy
A Nicolet Nexus spectrometer (Thermo Scientific, Waltham, MA) equipped with Smart iTR accessory was used in attenuated total reflectance (ATR) mode to conduct the ssFTIR measurements for secondary structural analysis. After the samples were loaded and compressed against the diamond, spectra were collected in the range of 800 to 4000 cm−1 in absorbance mode with co-addition of 120 scans obtained at 4 cm−1 resolution. The resulting spectra were processed using OPUS 6.5 analysis software (Bruker, Billerica, MA) with baseline correction, smoothing, normalization and second derivatization.
CD Spectroscopy
The protein samples were subjected to CD spectroscopy before and after drying. The initial formulations were diluted to a protein concentration of 0.1mg/mL and the dried powders were reconstituted and diluted to the same concentration. The diluted solutions were analyzed using a JASCO J-815 spectrometer (JASCO Analytical Instruments, Easton, MD). Spectra were collected using a cell of 1mm path length in the far-UV range between 190–250 nm with a 0.2 nm bandwidth at 20°C. The online K2D3 program was used to analyze the CD spectra collected and estimate the secondary structure.
Modulated Differential Scanning Calorimetry
Inside a nitrogen glove box, 2 − 4 mg of spray freeze dried or freeze dried powders were loaded into hermetic aluminum pans and sealed. These pans were then loaded in a Discovery Series DSC 25 differential scanning calorimeter (TA Instruments, New Castle, DE). The samples were heated from −5°C to 180°C with a ramp rate of 1°C/min and a modulation of ±1°C every 120 s. Glass transition temperature (Tg) and melting temperature (Tm) were determined by analyzing the data using the TRIOS software package (v4.3.0, TA instruments, New Castle, DE).
Surface Area Measurement
A Tristar II 3020 (Micromeritics, Norcross, GA) was used to measure the surface area of the freeze dried and spray freeze dried samples. The samples were degassed with nitrogen for 8 hours to remove residual moisture. A 6-point BET method (Brunauer et al., 1938) using helium adsorption was used to determine the surface area of the powders.
Stability Studies by Size Exclusion Chromatography (SEC)
Protein aggregation was measured using SEC in storage stability studies with triplicate samples. The powders were weighed (2 − 4 mg per vial), sealed and stored in an oven at 40°C. The vials of each formulation were removed from the oven at different time points (15, 30, 60 and 90 days) and reconstituted to obtain a protein concentration of 1 mg/mL. To remove any insoluble aggregates prior to SEC analysis, the reconstituted solutions were centrifuged at 12,000 rpm for 10 min at 4°C and the supernatant collected for analysis. A 1200 series high performance liquid chromatography (HPLC) system (Agilent Technologies, Santa Clara, CA) with a TSK gel G2000SWXL column (Tosoh Bioscience LLC, King of Prussia, PA) operating isocratically for 16 min at a flow rate of 1mL/min was used to analyze the samples. A mobile phase of sodium phosphate buffer (pH 6.8) was used. The physical instability of the samples was determined by calculating the percentage loss of area under the curve for the monomeric peak.
Solid-State Hydrogen Deuterium Exchange with Mass Spectrometric Analysis (ssHDX-MS)
ssHDX-MS measurements were performed according to previously reported procedures (Moorthy et al., 2014). Powders were placed in vials and stored in a sealed desiccator at 25°C with an RH of 11% maintained using a D2O solution saturated with lithium chloride. After the vials were exposed to D2O vapor, three vials of each formulation were removed from the desiccator at specific timepoints (4, 12, 24, 48, 120 and 240 h), capped and submerged in liquid nitrogen to prevent back exchange. Vials were then stored at −80°C until analysis. Fully deuterated control samples were prepared by dissolving the proteins in a solution containing 3 M guanidine hydrochloride, which was then placed in vials containing 9:1 dilution of D2O to protein solution dissolved in guanidine hydrochloride and stored for 24 h at 60°C. The solutions were then quenched in a 4:1 solution of quench buffer (a solution of 0.1% formic acid in water with a pH of 2.5) and immediately analyzed.
The extent of deuterium incorporation was determined by reconstituting the samples in 2 mL of chilled quench buffer. Ten μL of the reconstituted solution was injected into a protein microtrap (Michrom Bioresources, Inc., Auburn, CA). A high-pressure liquid chromatography system (1200 series, Agilent Technologies, Santa Clara, CA) was used to desalt the samples with 10% acetonitrile (with 0.1% formic acid) and 90% water for 1.7 min followed by elution over 7 min with a gradient of 90% acetonitrile (with 0.1% formic acid) and 10% water. To limit back exchange, the columns were kept in a custom-made refrigeration unit held at 4°C (Keppel et al., 2011). A 6520 Q-TOF mass spectrometer (Agilent Technologies, Santa Clara, CA) in the mass range of 200–2000 m/z was used to obtain the mass spectra of the samples. The spectra were deconvoluted and the protein mass and mass change were obtained by analyzing the spectra using the MassHunter Workstation software (Agilent Technologies, Santa Clara, CA). In deconvolution, a maximum entropy function was used by an algorithm that converts mass envelopes of the detected charged states into mass values.
The deuterium incorporation kinetics were fitted to a mono-exponential model:
| (1) |
where D(t) is the number of deuterons incorporated at time t, Dmax is the maximum number of deuterons that can be incorporated in the samples as determined experimentally, and k is the observed exchange rate constant.
Statistical Analysis
Statistical analysis was performed using Prism Software (GraphPad, La Jolla, CA). A two-way ANOVA with Turkey’s test was used for comparisons among groups.
Results
Moisture Content
In general, the freeze dried and spray freeze dried formulations achieved similar moisture contents of ~3% (w/w). The myoglobin-sucrose formulation was an exception, producing a lower moisture content when spray freeze dried (2.1. ± 0.2%) than when freeze dried (3.1. ± 0.2%)(p<0.005) (Table 1).
Table I:
Moisture content of freeze dried and spray freeze dried samples (Mean ± SD, n=3)
| Moisture Content (%w/w) | ||
|---|---|---|
| Formulation | Freeze Drying | Spray Freeze Drying |
| Lysozyme Only | 3.2 ± 0.5 | 3.3 ± 0.3 |
| Lysozyme – Sucrose | 2.9 ± 0.2 | 3.2 ± 0.1 |
| Lysozyme – Mannitol | 3.0 ± 0.1 | 3.1 ± 0.4 |
| Myoglobin Only | 3.2 ± 0.2 | 3.3 ± 0.2 |
| Myoglobin – Sucrose | 3.1 ± 0.2 | 2.1 ± 0.2 |
| Myoglobin – Mannitol | 3.1 ± 0.1 | 2.8 ± 0.4 |
DSC Analysis
Glass transition temperature (Tg) was determined for samples containing sucrose as an excipient (Table SII). Freeze dried samples containing sucrose had Tg values similar to those published previously (Simperler et al., 2006). Tg of the lysozyme-sucrose formulation was similar for the two processes whereas the Tg of the myoglobin-sucrose formulation showed a difference of ~8.7°C. This can be attributed to the difference in moisture content (Table 1). Melting temperatures (Tm) of the mannitol-containing formulations were determined (Table SII). Tm values of the lysozyme-mannitol formulations were similar between the two processes (Burger et al., 2000). However, the Tm was observed to be lower for myoglobin-mannitol formulations than for lysozyme-mannitol formulations. Neither Tg nor Tm could be determined for the formulations without excipients.
X-ray Powder Diffraction
Sucrose-containing and excipient-free formulations exhibited no crystalline peaks for either process (Fig. 1). Mannitol-containing formulations were crystalline. Different polymorphic forms of mannitol were detected. These forms varied with both formulation and process (Fig. S1 and Fig. S2)
Figure 1:
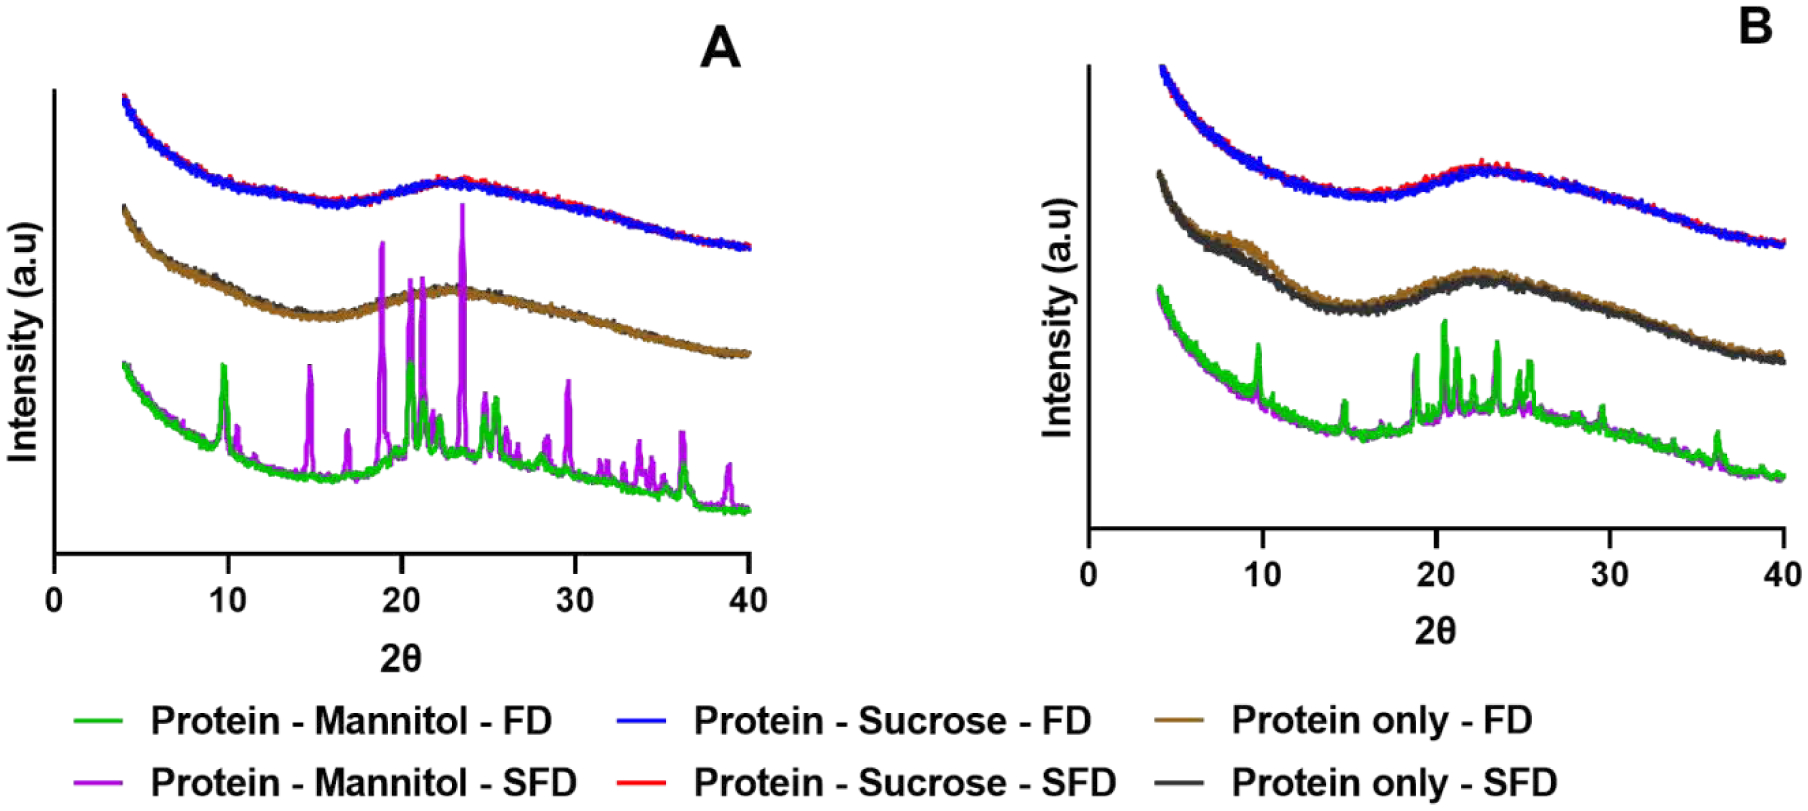
PXRD diffractograms of lysozyme (A) and myoglobin (B) formulations
Secondary Structural Analysis by ssFTIR and CD spectroscopy
An ssFTIR spectrum in the amide I region was analyzed for each formulation (Fig. 2). For lysozyme (Fig. 2A) and myoglobin (Fig. 2B), FTIR bands were observed at ~1625 cm−1 (β-sheet), 1646 cm−1 (random coil), ~1658 cm−1 and ~1656cm−1 (α-helix), 1675 cm−1(turns/loops), and 1690 cm−1(turns). The band near 1656 cm−1 showed shifts in wave number among the different formulations and processes, suggesting some effects on the α-helical regions of the proteins (Kumosinski and Farrell, 1993). In general, the excipient-free formulations showed greater structural differences between the freeze dried and spray freeze dried samples than those containing sucrose or mannitol, as indicated by band shifts and loss of band definition on ssFTIR (Fig. 2). For mannitol-containing formulations, slight structural perturbations were observed for both proteins, as indicated by changes in band position (Fig. 2). For sucrose-containing formulations, lysozyme spectra were similar between the two processes, while myoglobin showed minor differences in band position (Fig. 2).
Figure 2:

Solid-state FTIR spectra of lysozyme (A) and myoglobin (B) formulations
CD spectra were collected in the range of 190–250 nm for all formulations before processing and after reconstitution. Peaks were observed at ~196 nm, ~209nm and ~223nm (Fig. 3) and are assigned to the α-helix regions in the secondary structure of the protein (Greenfield, 2006). The CD spectra indicate that, after reconstitution, the secondary structure of proteins is retained even for the formulations in which structural perturbation is observed in the solids by ssFTIR.
Figure 3:
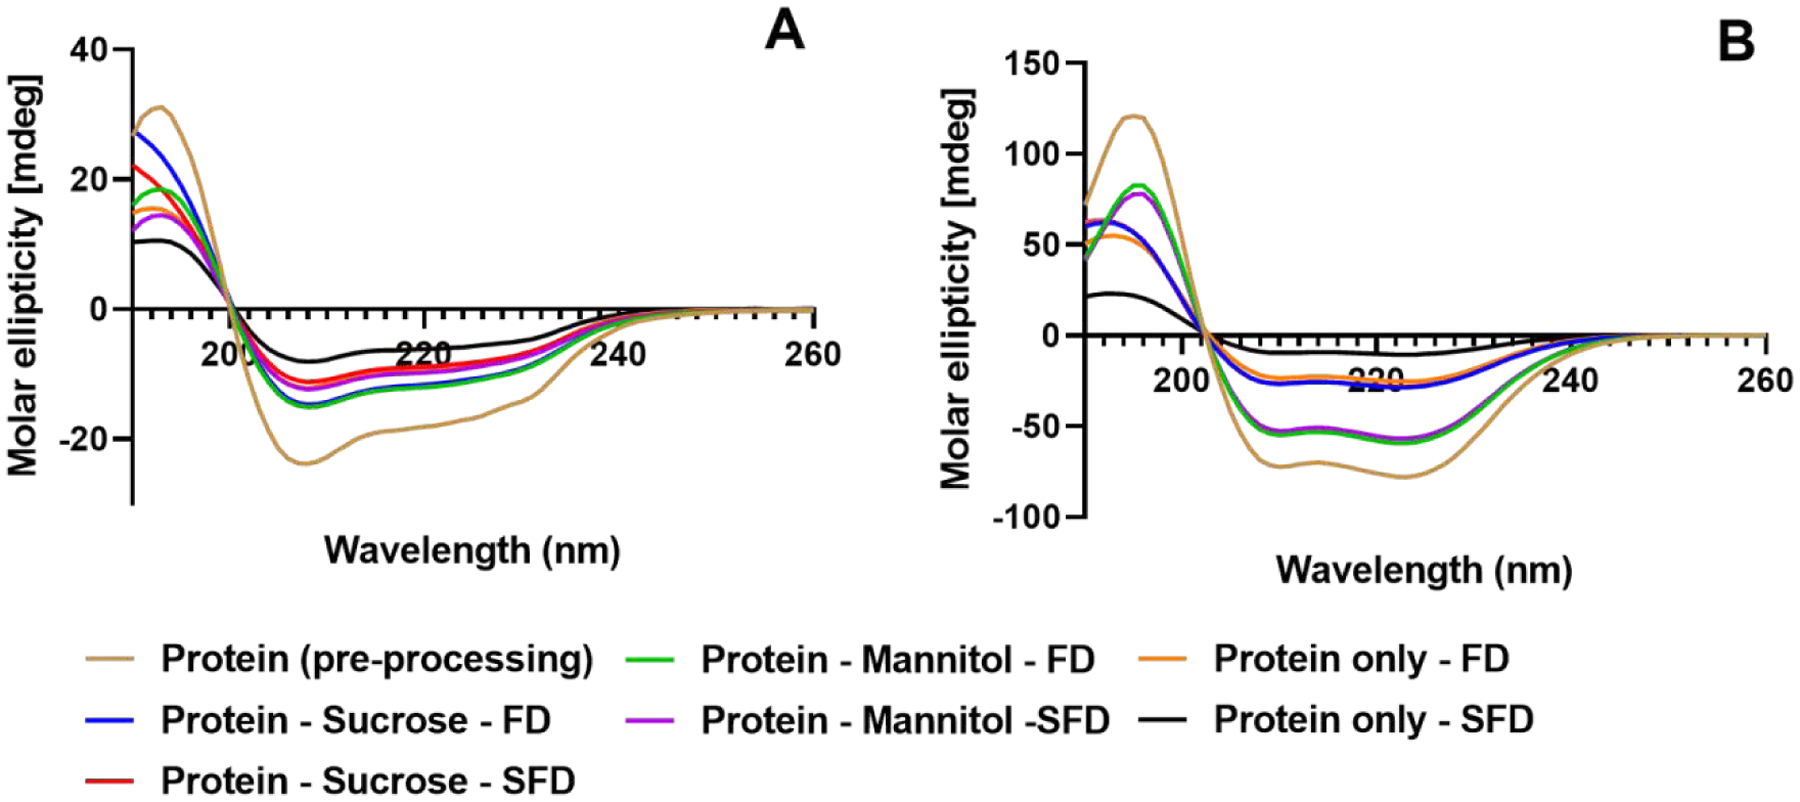
CD spectra of lysozyme (A) and myoglobin (B) formulations
Protein Conformation and Solid-State Interactions using ssHDX-MS
Deuterium incorporation in the dried formulations was used as a function of time in order to measure protein conformation and interactions between proteins and excipients in the solid state. Deuterium incorporation in ssHDX-MS has been shown to be affected by factors such as excipient type, temperature, relative humidity and processing method (Iyer et al., 2016; Sophocleous et al., 2012). These effects reflect differences in the hydrogen-bond network in the solid state, which encompasses both the intramolecular hydrogen bonds that contribute to protein structure, as well as intermolecular hydrogen bonds between the protein and the matrix.
The extent of deuterium incorporation was compared between the drying processes and among the formulations. In the lysozyme formulations (Fig. 4A), the extent of exchange showed no significant differences between processes for the sucrose- and mannitol-containing formulations. However, significant differences (p<0.05) were observed for the lysozyme-only formulation until 5-day (120 h) timepoints. For the myoglobin formulations (Fig. 4B), no significant differences were observed for the sucrose-containing and protein-only formulations, but a significant difference between processes (p<0.0001) was observed for the mannitol-containing formulations. For both proteins, the mannitol-containing formulations and protein-only formulations had greater deuterium incorporation than those containing sucrose. Differences in deuterium uptake reflect differences in protein structure and/or intermolecular interactions between the protein and excipients in the solid state. Greater deuterium incorporation is an indication of fewer intermolecular interactions and/or a loss or protein higher order structure.
Figure 4:
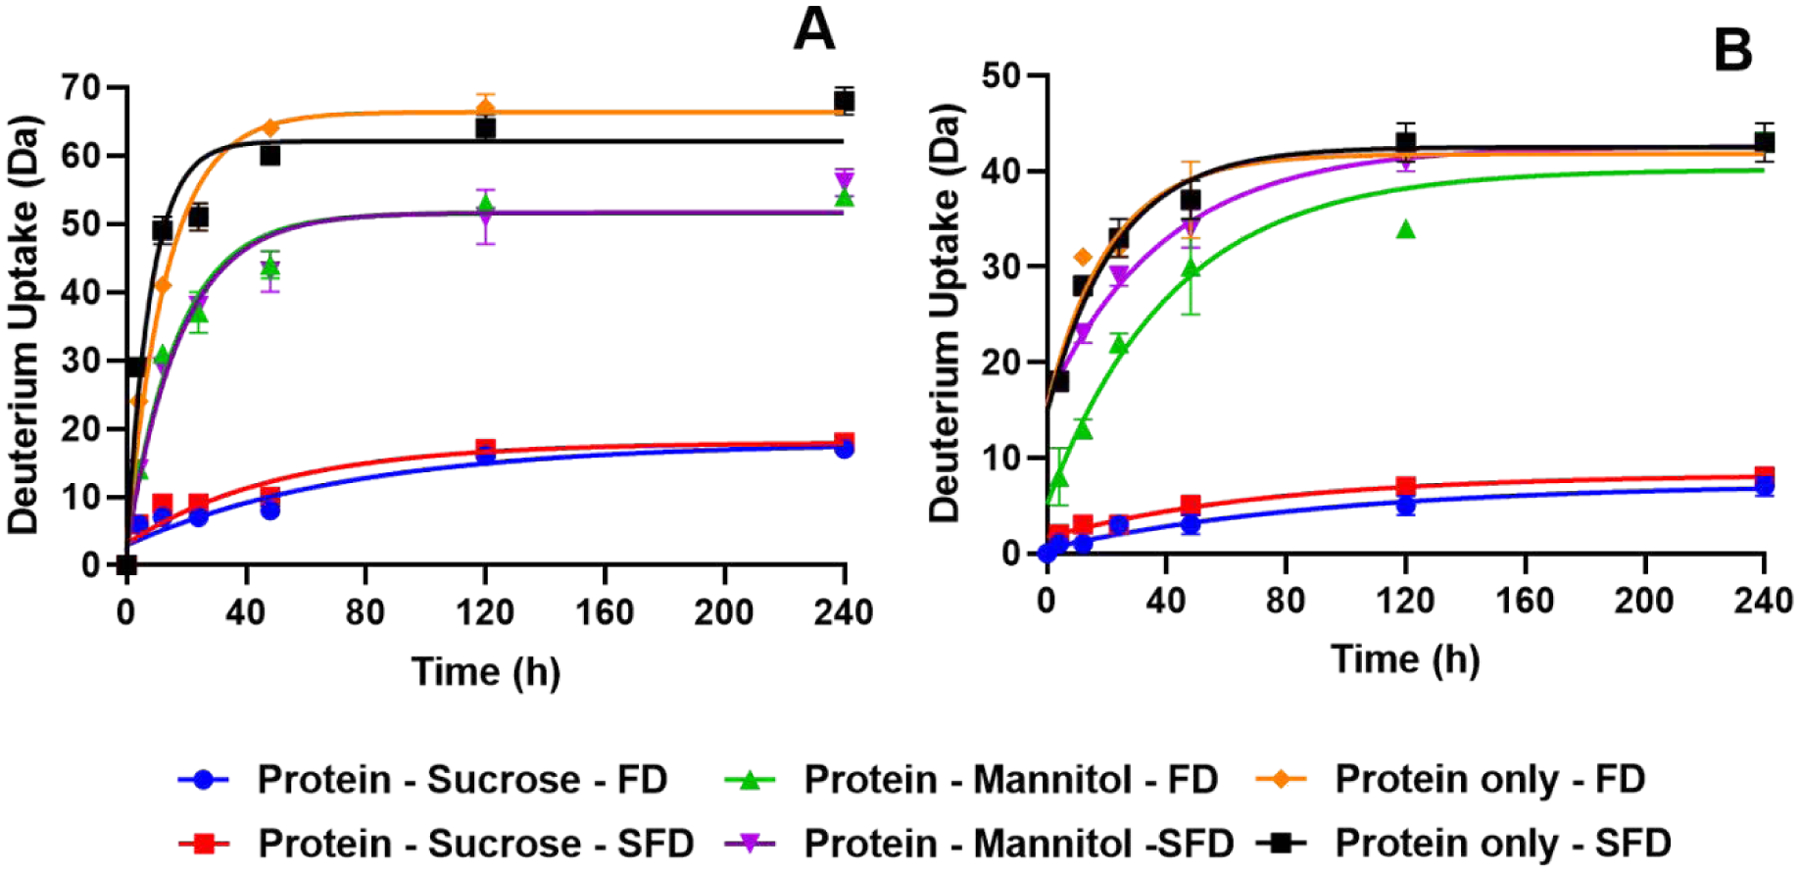
Hydrogen/deuterium exchange kinetics in the solid state for lysozyme (A) and myoglobin (B) (n = 3, mean ± SD; error bars not shown when less than the height of the symbol.)
A mono-exponential model (Eqn. 1) was used to fit the deuterium incorporation kinetics in ssHDX-MS and the rate constant (k) and maximum deuterium uptake (Dmax) values were obtained as regression parameters (Fig. 5). For a given formulation, the rate constants (Fig. 5A) were not significantly different between the two processes, except for the myoglobin-mannitol formulation (p<0.05). With regard to the maximum deuterium uptake (Fig. 5B), there was no significant difference between the two processes for any formulation.
Figure 5:
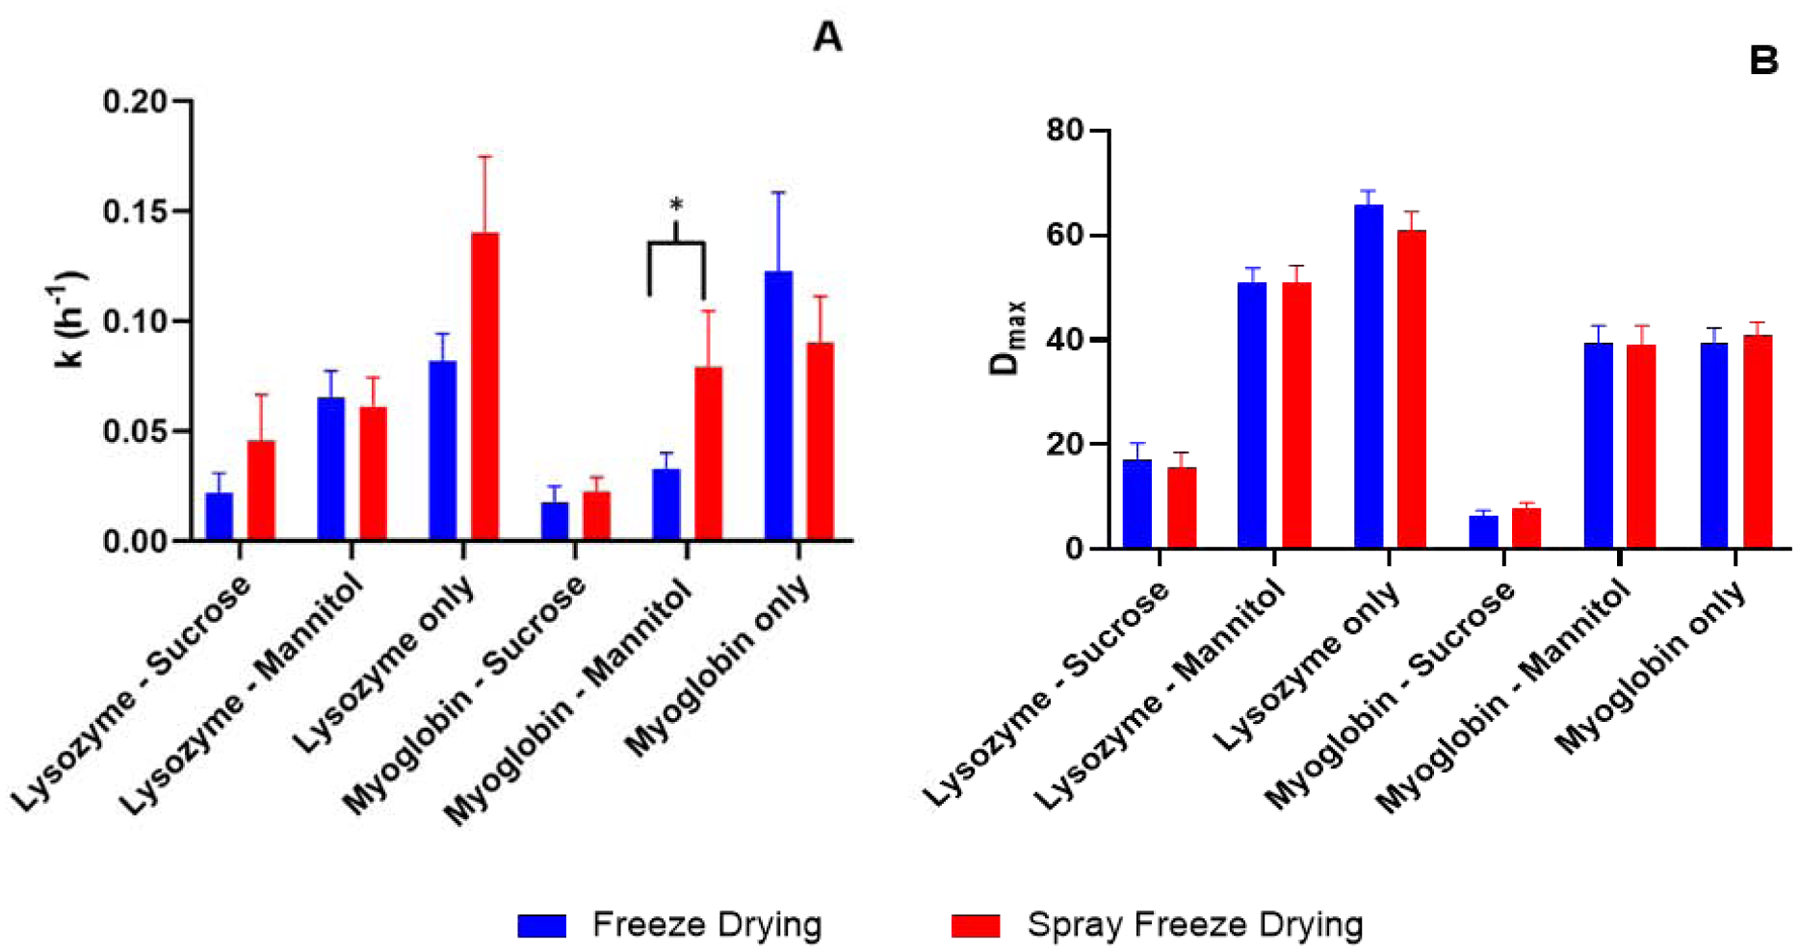
Deuterium incorporation kinetics fitted to the mono-exponential model in Equation 1. (n = 3, mean ± SD; error bars not shown when less than the height of the symbol.)
We also examined differences in the deconvoluted deuterated mass envelopes for the ssHDX-MS samples. For sucrose-containing formulations of both proteins (Fig. 6), there were no significant differences between the processes. As expected, the spectra showed peaks that were slightly broadened when compared to undeuterated samples (Moussa et al., 2018; Wilson et al., 2019). Greater broadening was observed for mannitol-containing and protein-only formulations. At a given level of deuteration, greater peak broadening is consistent with a broader distribution of deuterated states, reflecting a more heterogenous population of protein conformational states and/or matrix environments. For formulations containing mannitol (except freeze dried lysozyme), two distinctive peaks were observed in the mass envelopes for both processes across the formulations (Fig. S4). This shows that there are two different populations of protein conformation and/or environment within the formulations, one of which is more protected from deuterium exchange than the other. For the protein-only formulations and the freeze dried formulation of lysozyme with mannitol, there is a broad shoulder to the left of the peak, suggesting a more protected population that is not well resolved in mass from the main peak.
Figure 6:

Deconvoluted mass spectra of lysozyme (A) and myoglobin (B) formulations
The deconvoluted mass spectra were normalized and their peak areas were measured. The areas are reported as a percentage of the experimentally-determined fully-deuterated sample peak area and depicted as a function of the deuterium uptake (Fig. 7). With an increase in deuterium incorporation, an initial peak broadening and an increase in peak area are expected since there will necessarily be a greater distribution of deuteration states as compared to the native (undeuterated) state. At very high levels of deuterium incorporation, when deuteration is nearly complete i.e., when every exchangeable hydrogen in the protein backbone is exhanged with a deuterium, peak broadening and peak area are expected to again decrease, reflecting the increasing homogeneity of the population. This decrease in peak area was observed here for the fully deuterated control (Fig. 7). For lysozyme, at a given percent deuterium incorporation, the peak area is generally greatest for the freeze-dried formulation containing protein only (Fig. 7A). This is an indication that the distribution of conformations and or matrix interactions is greatest for lysozyme under these conditions. For myoglobin, at a given percent deuterium incorporation, the peak area is generally greatest for the spray-freeze dried formulation containing protein only (Fig. 7B), again indicating the broadest distribution of states. For both proteins and processing methods, the sucrose formulations show low deuterium incorporation and low peak area (Fig. 7A, B), consistent with both protection from exchange and a relatively narrow distribution of protein states in the matrix.
Figure 7:
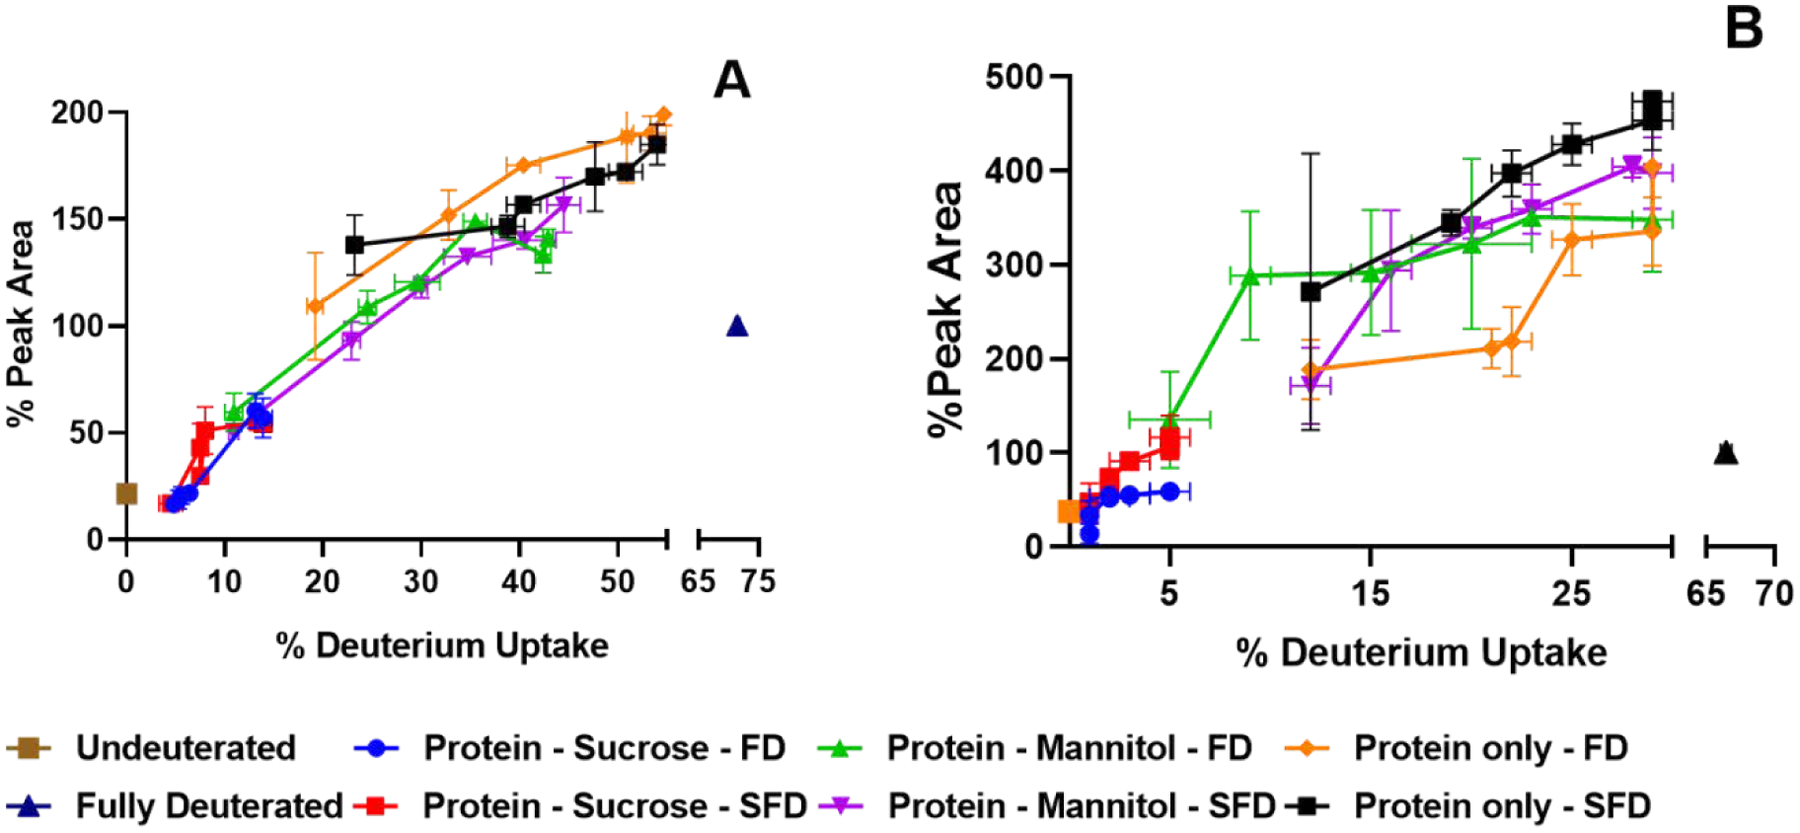
Peak area of deconvoluted mass spectra as a function of deuterium uptake of lysozyme (A) and myoglobin (B) formulations (n = 3, mean ± SD; error bars not shown when less than the height of the symbol.)
Surface Area Measurements
It has been previously reported that the freezing rate affects the formation of ice crystals and in turn results in surface area changes (Nakagawa et al., 2007) and/or polymorphs of the material (Poornachary et al., 2013). The SEM images (Fig. S3.) show that the morphological structures of the powder particles were different (Poornachary et al., 2013). Such difference in morphological structure could affect the surface area of the material. As surface area is known to have an impact on the stability of proteins in solid form (Costantino et al., 2000; Iyer et al., 2016), surface area measurements were conducted for the myoglobin formulations (Table 2). For sucrose-containing and excipient-free formulations, spray freeze drying resulted in greater surface area than freeze drying for myoglobin. However, freeze drying resulted in greater surface area than spray freeze drying for mannitol-containing myoglobin formulation. The freeze dried formulations without mannitol showed lower surface area and the values may reflect microscopic collapse of the cakes. However, this is expected due to lack of a crystalline matrix within the formulation that generally tends to support the amorphous matrix and prevent the collapse of the dried formulations (Pikal, 1990).
Table II:
BET surface area of myoglobin formulations
| Formulation | Freeze drying | Spray freeze drying | ||
|---|---|---|---|---|
| Surface Area (m2/g) | Std. Dev | Surface Area (m2/g) | Std. Dev | |
| Myoglobin only | 0.12 | 0.02 | 1.41 | 0.13 |
| Myoglobin - sucrose | 0.67 | 0.07 | 2.05 | 0.08 |
| Myoglobin - mannitol | 6.14 | 0.07 | 4.67 | 0.07 |
Stability Studies
For both proteins, the sucrose-containing formulations showed a lower percentage loss in SEC monomeric peak area than the mannitol-containing and protein-only formulations (Fig. 8). For lysozyme formulations with mannitol, the freeze dried samples showed slightly greater loss in monomeric peak area than the spray freeze dried samples at 60-day and 90-day time points (p<0.05). In contrast, for myoglobin formulations with mannitol, the spray freeze dried samples showed slightly greater loss in monomeric peak area than the freeze dried samples at 60-day and 90-day time points (p<0.05). No statistically significant differences were observed for these formulations during the initial time points till 30 days. For all other formulations, no statistically significant differences were observed in protein stability between the two processes, as measured by loss of monomeric peak by SEC. A rise in higher molecular weight species (HMWs) was observed for all the formulations where monomer loss has been observed.
Figure 8:

Physical stability of lysozyme (A) and myoglobin (B) formulations on storage at 40°C (n = 3, mean ± SD; error bars not shown when less than the height of the symbol.)
Correlation of traditional techniques and ssHDX-MS with stability studies
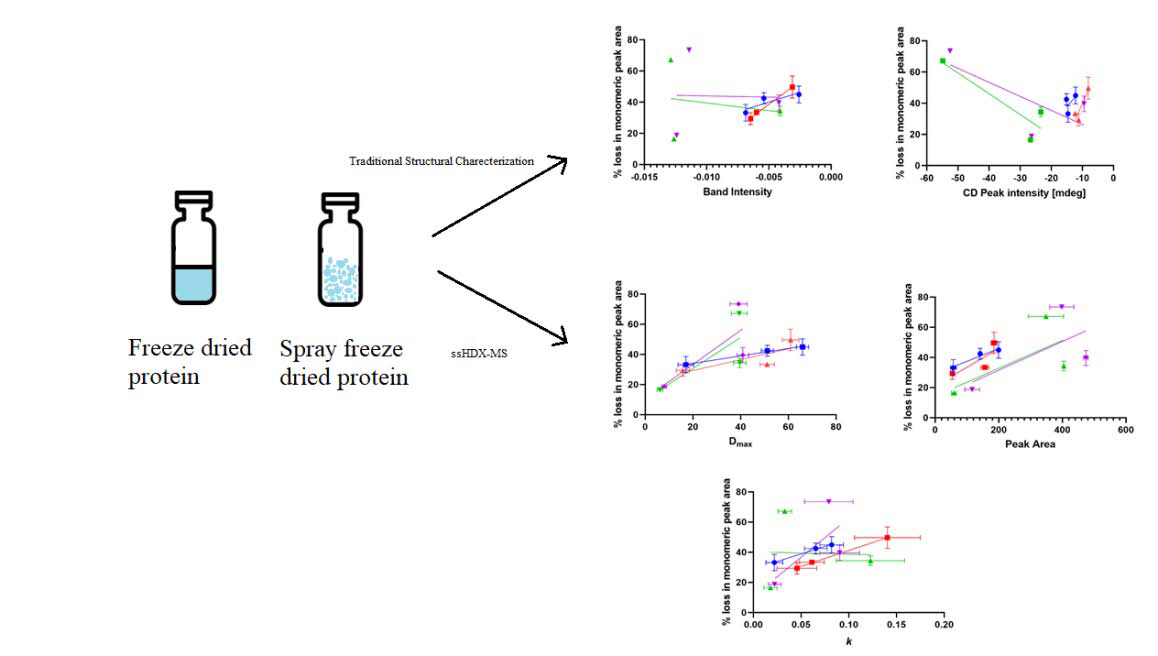
Traditional characterization techniques used in the study such as ssFTIR and CD spectroscopy are correlated to the stability studies (Fig. 9). ssHDX-Ms results such as the maximum deuterium uptake (Dmax), peak areas of deconvoluted spectra and the rates of the deuteration kinetics (k) were also correlated to stability (Fig. 10).
Figure 9:
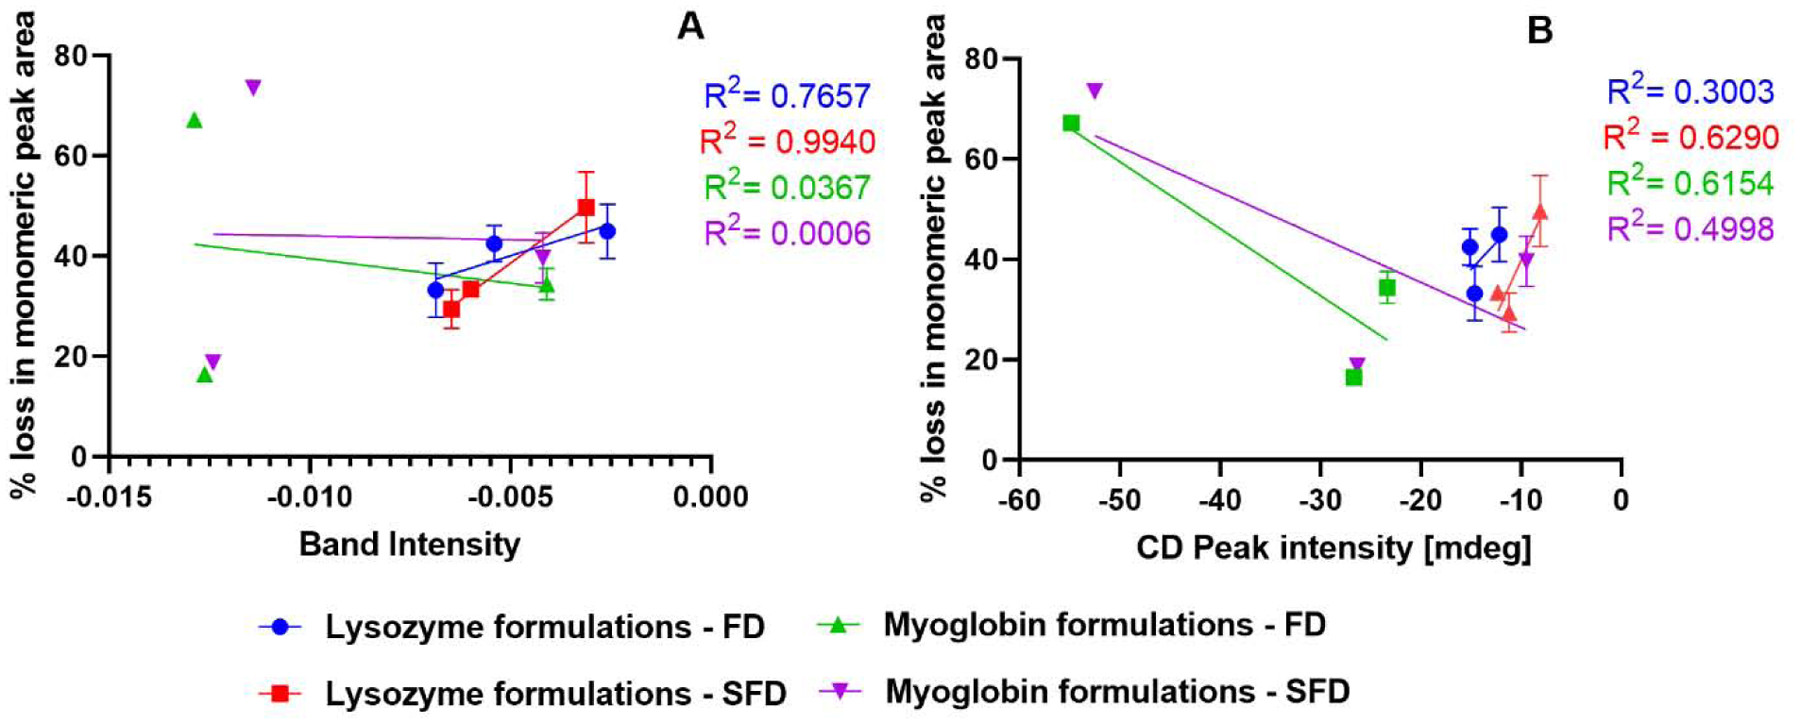
Correlation of 90-day physical stability results with ssFTIR (A) and CD spectroscopy (B) (n = 3, mean ± SD; error bars not shown when less than the height of the symbol.)
Figure 10:
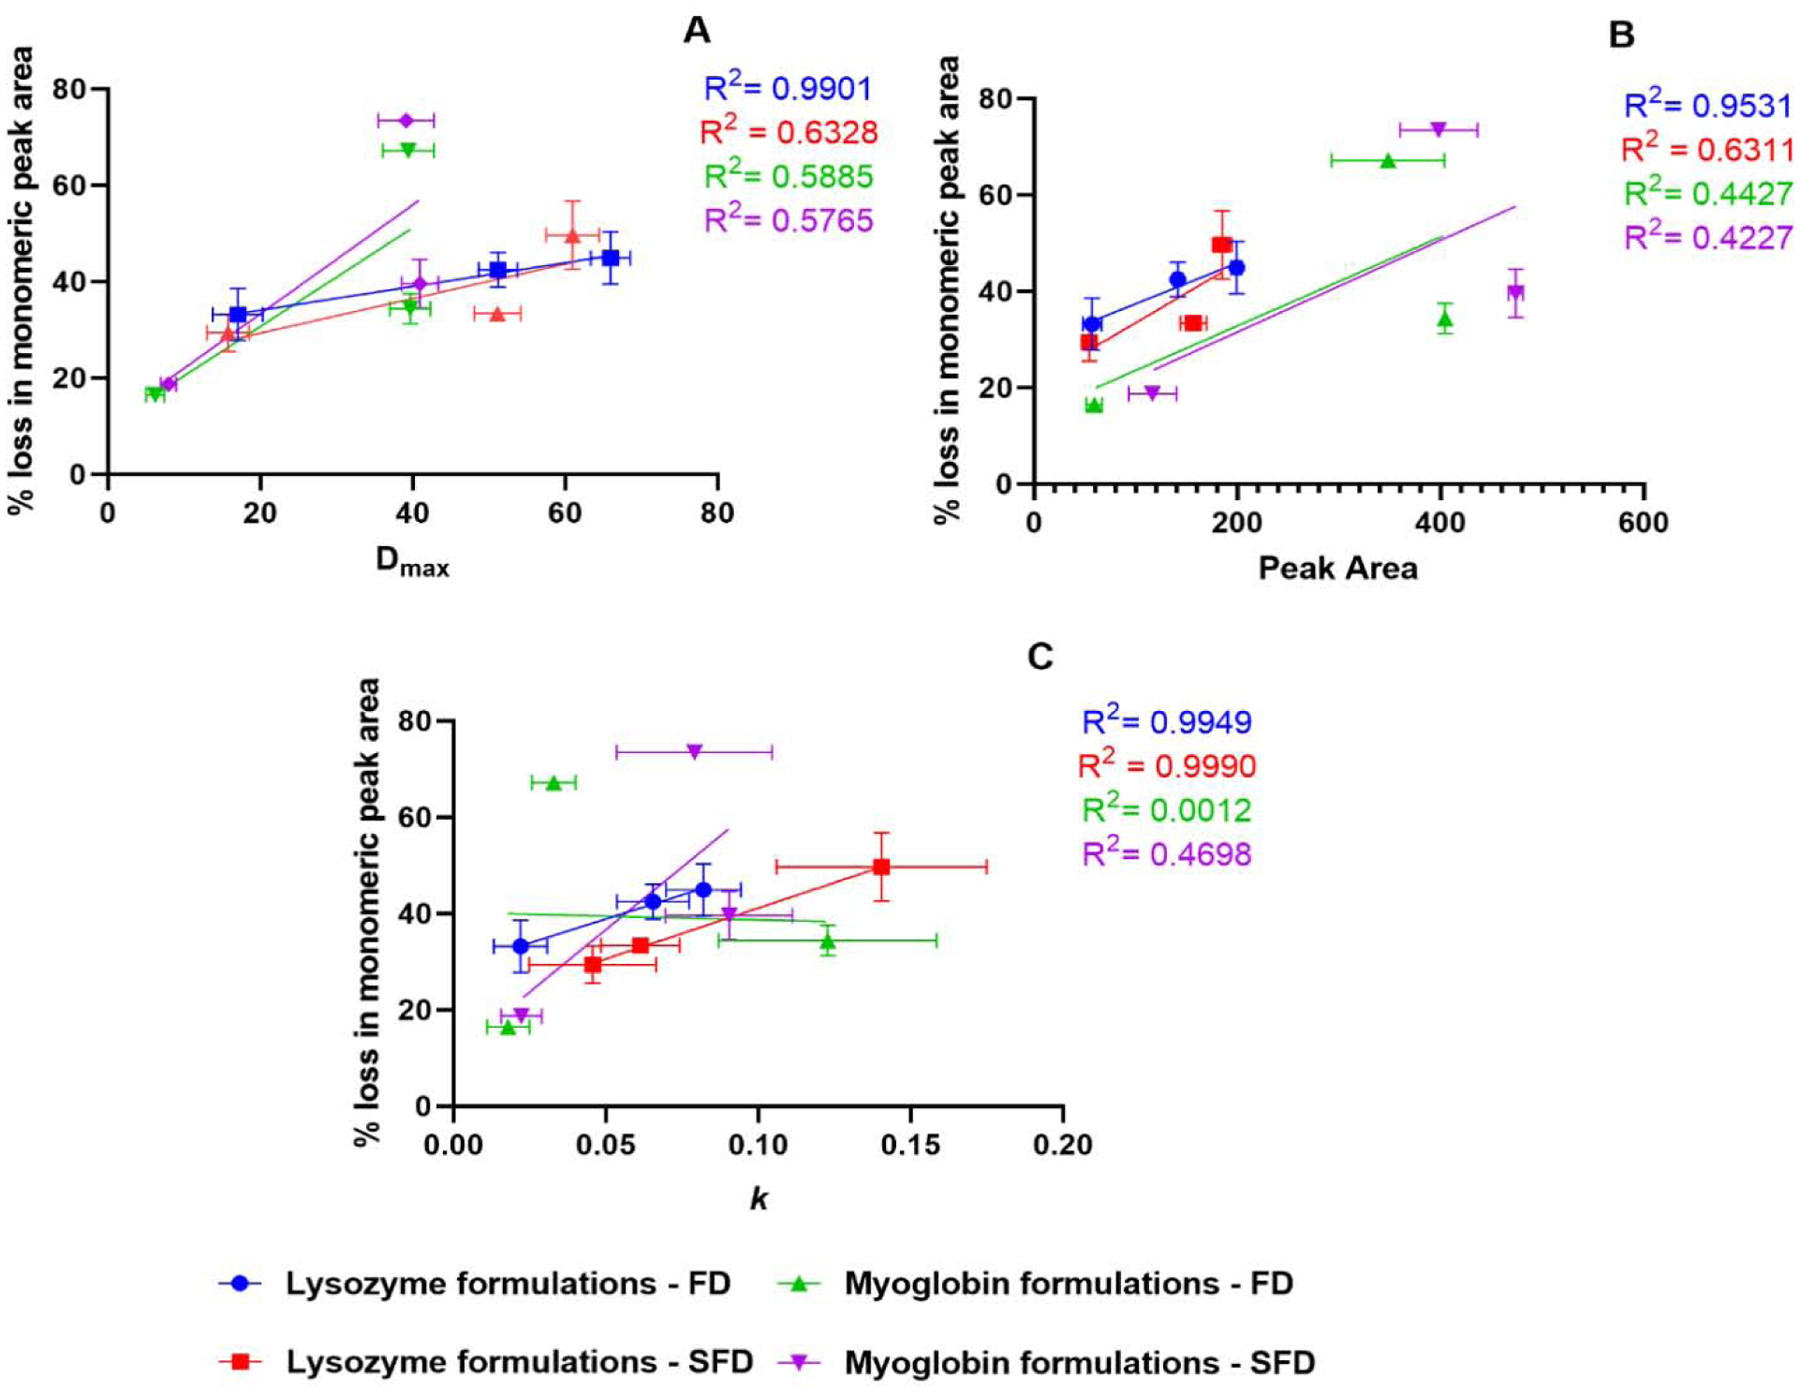
Correlation of 90-day physical stability results with Dmax(A), peak area of deuterated samples (B) and deuterium exchange rate k (C). (n = 3, mean ± SD; error bars not shown when less than the height of the symbol.)
Discussion
While the effects of freeze drying on the stability of protein formulations have been widely studied, relatively few investigations have been conducted on other drying techniques, such as spray freeze drying. In this study, a variety of formulations are produced through freeze drying and spray freeze drying and then characterized using physicochemical methods. Storage stability studies were also performed.
The significant difference in the moisture content for the myoglobin-sucrose formulations resulted in a difference in the glass transition temperature. However, no significant difference in either ssHDX-MS or the SEC results were observed for this particular formulation suggesting that the moisture content variation did not impact the deuteration kinetics or the physical stability of the samples. PXRD results showed that the mannitol-containing formulations were crystalline. The mannitol’s crystal polymorphs varied with different formulations and processes. Spray freeze drying produced a polymorphic mannitol form that was a mixture of α and β forms for both the protein formulations; and freeze drying produced γ form for the lysozyme-mannitol formulation. Spray freeze drying produced a mixture of β and γ forms for the myoglobin-mannitol formulation. The crystallinity can be attributed to the higher mannitol content i.e., >30% (w/w) of the total solid content (Maa et al., 1997). Proteins have also been shown to affect the polymorphic form of mannitol depending on the type of drying process being used (Grohganz et al., 2013).
Traditionally, glass transition temperature is used as a parameter to identify the difference in formulations. However, due to the formulations used in this study i.e, formulations with crystalline excipients and without any excipients, DSC results could not be used to derive a correlation between the glass transition temperature and stability of the protein formulations.
CD spectra (Fig. 3) showed little-to-no difference among different formulations in terms of the secondary structure retention after reconstitution. ssFTIR showed some differences in the protein structures (Fig. 2). While there is very little difference between the processes for sucrose-containing formulations for both the proteins, ssFTIR peak broadening and peak shifts were observed for the mannitol-containing and protein-only formulations, suggesting a change in protein structure for these formulations in both the processes. Fig. 9A and Fig. 9B showed that ssFTIR had a strong correlation with physical stability for the spray freeze dried lysozyme. For all other formulations neither ssFTIR nor CD spectroscopy data showed strong correlation with stability and is consistent with some of the previous findings (Moorthy et al., 2014; Wilson et al., 2019).
Analyzing the peak areas of the normalized mass spectra as a function of deuterium uptake percentage in ssHDX-MS samples (Fig. 7) did show differences. Presence of heterogeneity in the formulation results in peak broadening of the deconvoluted deuterated samples. While an initial peak broadening and an increase in peak area were expected, mannitol-containing samples of both lysozyme and myoglobin showed two distinct populations (Fig. S4) that the conventional methods were not able to identify. This may be either due to aggregation or pre-aggregation of the species that phase separated from the mannitol or due to isolation of certain species that are trapped as inclusions within the crystalline matrix of the mannitol. Any of the aforementioned reasons will limit the protein exposure to D2O. This phenomenon of distinct species was not observed for amorphous formulations, suggesting that crystallization of mannitol during drying may be responsible for this phenomenon. Moreover, these distinct species had approximately the same mass as the undeuterated protein, suggesting that deuterium exchange in these subpopulations is nearly completely inhibited. In addition, the distinct species appear more prominent with spray freeze drying than with freeze drying, suggesting that spray freeze drying enhances these subpopulations.
In the ssHDX-MS samples, maximum deuterium uptake(Dmax) was similar between the two processes for the same formulation (Fig. 5). However, the deconvoluted peak areas as a function of percentage deuterium uptake (Fig. 7) showed differences between the processes, meaning there is a difference in the heterogeneity of protein states in the formulations. Previous reports have shown that ssHDX-MS results are better correlated with physical stability than other more traditional characterization techniques such as DSC and ssFTIR (Moorthy et al., 2014; Moorthy et al., 2018; Wilson et al., 2019). Our data shows that the Dmax and peak area of deuterated samples for the freeze dried lysozyme formulations are better correlated with stability than for the spray freeze dried lysozyme formulations (Fig. 10A,B) and k values have better correlation with stability for lysozyme formulations with both the processes compared to myoglobin formulations (Fig. 10C) than traditional characterization techniques. Myoglobin formulations without excipients and with mannitol have similar Dmax and peak areas, possibly because crystallization of mannitol leads to phase separation, producing a protein-rich phase that behaves much like excipient-free samples.
However, myoglobin formulations do not show a good correlation between SEC data and ssHDX-MS peak area, which may be due to the high % loss in monomeric peak area observed in the mannitol formulations as compared to the protein-only formulations (Fig. 8B).
Sucrose-containing formulations showed a lower loss in monomeric peak area than mannitol-containing and excipient-free formulations. This is likely due to crystallization and phase separation of mannitol and lack of protection due to absence of excipient, respectively. While mannitol-containing formulations showed statistically significant differences in monomer loss between processes for both proteins starting at 60 days, the differences may be a result of formulation effects rather than processing effects. For lysozyme, excipient-free formulations showed a greater loss in monomeric peak area than mannitol-containing formulations. The deconvoluted spectra (Fig. 6A) and the peak area of deconvoluted spectra as a function of deuterium uptake (Fig. 7A) showed that for lysozyme formulations, the excipient-free formulations have a higher structural perturbation and population heterogeneity than sucrose and mannitol formulations. This may suggest a reason for the higher loss in monomeric peak area for the excipient-free lysozyme formulations. While the SEC results for myoglobin formulations show significant differences between mannitol and excipient-free formulations, the peak area of deconvoluted spectra as a function of deuterium uptake (Fig. 7B) show similar population heterogeneity. This suggests that while peak area may be a better representation of the populations present in the formulation, it is not necessarily a direct predictor of the physical stability on storage in this case. However, the deconvoluted spectra (Fig. 6B) show that the mannitol-containing formulations have second distinctive peaks that were not observed in the deconvoluted spectra of the excipient-free formulations. These second peaks may correspond to an aggregation-prone subpopulation, and may help to explain the significant loss in monomeric peak area in mannitol-containing myoglobin formulations (Fig. 8).
The effect of freezing rate on ice crystallization has been previously reported (Nakagawa et al., 2007). Surface area measurements were made (Table 2) because freeze drying and spray freeze drying have different freezing rates, which are known to affect the crystallite size and specific surface area. While surface area effects are not evident in sucrose-containing formulations, it aids in understanding the higher percentage loss in monomeric peak area for myoglobin-mannitol formulations as compared to the myoglobin-only formulations. From the BET surface area results (Table 2), the significantly greater surface area of the myoglobin-mannitol formulations as compared to the myoglobin-only formulations may be another reason for greater loss in monomeric content that was observed (Fig. 8). The greater surface area of the myoglobin-mannitol formulations vs. the myoglobin-only formulations may have led to greater surface exposure of either the native protein or the partially unfolded protein during the stability studies. Such exposure may have led to surface-induced aggregation and greater percent loss of monomeric peak area (Costantino et al., 2000).
In the protein formulations and processes studied here, in general there is no substantial difference in SEC and ssHDX data between freeze drying and spray freeze drying, particularly for the sucrose-containing formulations. Our study indicates that spray freeze drying is a promising viable manufacturing method for protein solids; nevertheless, formulations should be examined and optimized for those proteins that are susceptible to the shear stress generated during the spraying process. The mannitol-containing formulations had different polymorphs, the effect of these polymorphs on the protein-excipient interaction and physical stability is unclear and warrants further studies. The population heterogeneity was generally greater in mannitol-containing and excipient-free formulations than that in sucrose-containing formulations, as indicated by ssHDX-MS peak area (Fig. 7) and is in agreement with some of the previous studies (Moussa et al., 2018; Wilson et al., 2020; Wilson et al., 2019). While remarkbable differences between the formulations were observed, the differences between the formulations due to processing effects were limited, at least to the proteins and formulations involved in this study.
Conclusions
The effects of processing method and formulation were studied for myoglobin and lysozyme powders produced by freeze drying and spray freeze drying. Characterization techniques such as ssFTIR, CD spectroscopy and ssHDX-MS were used to study the effects of the processing method on protein structure and were related to the physical stability. ssFTIR identified some differences in protein structure between the formulations produced using the same process. While differences between formulations were observed, neither ssFTIR nor CD identified notable differences between the processes and provided no information about population heterogeneity within a formulation. ssHDX-MS identified the presence of population differences and detected differences between processes. Dmax and peak area data from ssHDX-MS showed a good correlation to physical stability for lysozyme formulations. The deconvoluted spectra of the ssHDX-MS identified the presence of distinctive species corresponding to “pre-aggregation” subpopulations in the myoglobin-mannitol formulations, which may be associated with the higher loss in monomer content. Higher specific surface area may also contribute to the greater loss in monomer content for the myoglobin-mannitol formulations. The results demonstrate that spray freeze drying can produce solid-state proteins in the particle form with comparable physical stability to the cakes produced by freeze drying for sucrose-containing formulations.
Supplementary Material
Acknowledgements
This study was partially supported by the National Institute of Allergy and Infectious Diseases of the National Institutes of Health under Award Number R01AI146160. The content is solely the responsibility of the authors and does not necessarily represent the official views of the National Institutes of Health.
Footnotes
Publisher's Disclaimer: This is a PDF file of an unedited manuscript that has been accepted for publication. As a service to our customers we are providing this early version of the manuscript. The manuscript will undergo copyediting, typesetting, and review of the resulting proof before it is published in its final form. Please note that during the production process errors may be discovered which could affect the content, and all legal disclaimers that apply to the journal pertain.
Declaration of interests
The authors declare that they have no known competing financial interests or personal relationships that could have appeared to influence the work reported in this paper.
References
- Abdul-Fattah AM, Truong-Le V, Yee L, Nguyen L, Kalonia DS, Cicerone MT, Pikal MJ, 2007. Drying-induced variations in physico-chemical properties of amorphous pharmaceuticals and their impact on stability (I): Stability of a monoclonal antibody. Journal of Pharmaceutical Sciences 96, 1983–2008. [DOI] [PubMed] [Google Scholar]
- Abdul-Fattah AM, Kalonia DS, Pikal MJ, 2007. The Challenge of Drying Method Selection for Protein Pharmaceuticals: Product Quality Implications. Journal of Pharmaceutical Sciences 96, 1886–1916. [DOI] [PubMed] [Google Scholar]
- Brunauer S, Emmett PH, Teller E, 1938. Adsorption of Gases in Multimolecular Layers. Journal of the American Chemical Society 60, 309–319. [Google Scholar]
- Burger A, Henck JO, Hetz S, Rollinger JM, Weissnicht AA, Stottner H, 2000. Energy/temperature diagram and compression behavior of the polymorphs of D-mannitol. Journal of pharmaceutical sciences 89, 457–468. [DOI] [PubMed] [Google Scholar]
- Burkoth TL, Bellhouse BJ, Hewson G, Longridge DJ, Muddle AG, Sarphie DF, 1999. Transdermal and transmucosal powdered drug delivery. Critical Reviews in Therapeutic Drug Carrier Systems 16, 331–384. [DOI] [PubMed] [Google Scholar]
- Carpenter JF, Chang BS, Garzon-Rodriguez W, Randolph TW, 2002. Rational design of stable lyophilized protein formulations: theory and practice. [DOI] [PubMed]
- Chang L, Shepherd D, Sun J, Ouellette D, Grant KL, Tang X, Pikal MJ, 2005. Mechanism of protein stabilization by sugars during freeze-drying and storage: Native structure preservation, specific interaction, and/or immobilization in a glassy matrix? Journal of Pharmaceutical Sciences 94, 1427–1444. [DOI] [PubMed] [Google Scholar]
- Cicerone MT, Pikal MJ, Qian KK, 2015. Stabilization of proteins in solid form. Adv Drug Deliv Rev 93, 14–24. [DOI] [PMC free article] [PubMed] [Google Scholar]
- Costantino HR, Carrasquillo KG, Cordero RA, Mumenthaler M, Hsu CC, Griebenow K, 1998. Effect of excipients on the stability and structure of lyophilized recombinant human growth hormone. J Pharm Sci 87, 1412–1420. [DOI] [PubMed] [Google Scholar]
- Costantino HR, Firouzabadian L, Hogeland K, Wu C, Beganski C, Carrasquillo KG, Córdova M, Griebenow K, Zale SE, Tracy MA, 2000. Protein spray-freeze drying. Effect of atomization conditions on particle size and stability. Pharmaceutical research 17, 1374–1382. [DOI] [PubMed] [Google Scholar]
- Greenfield NJ, 2006. Using circular dichroism spectra to estimate protein secondary structure. Nature Protocols 1, 2876–2890. [DOI] [PMC free article] [PubMed] [Google Scholar]
- Grohganz H, Lee Y-Y, Rantanen J, Yang M, 2013. The influence of lysozyme on mannitol polymorphism in freeze-dried and spray-dried formulations depends on the selection of the drying process. International journal of pharmaceutics 447, 224–230. [DOI] [PubMed] [Google Scholar]
- Iyer LK, Sacha GA, Moorthy BS, Nail SL, Topp EM, 2016. Process and Formulation Effects on Protein Structure in Lyophilized Solids Using Mass Spectrometric Methods. Journal of pharmaceutical sciences 105, 1684–1692. [DOI] [PMC free article] [PubMed] [Google Scholar]
- Keppel TR, Jacques ME, Young RW, Ratzlaff KL, Weis DD, 2011. An efficient and inexpensive refrigerated LC system for H/D exchange mass spectrometry. Journal of the American Society for Mass Spectrometry 22, 1472–1476. [DOI] [PubMed] [Google Scholar]
- Koshari SH, Ross JL, Nayak PK, Zarraga IE, Rajagopal K, Wagner NJ, Lenhoff AM, 2017. Characterization of Protein-Excipient Microheterogeneity in Biopharmaceutical Solid-State Formulations by Confocal Fluorescence Microscopy. Mol Pharm 14, 546–553. [DOI] [PubMed] [Google Scholar]
- Kumosinski TF, Farrell HM, 1993. Determination of the global secondary structure of proteins by Fourier transform infrared (FTIR) spectroscopy. Trends in Food Science & Technology 4, 169–175. [Google Scholar]
- Langford A, Bhatnagar B, Walters R, Tchessalov S, Ohtake S, 2018. Drying technologies for biopharmaceutical applications: Recent developments and future direction. Drying Technology 36, 677–684. [Google Scholar]
- Lee G, 2002. Spray-Drying of Proteins, in: Carpenter JF, Manning MC (Eds.). Springer US, Boston, MA, pp. 135–158. [Google Scholar]
- Maa YF, Costantino HR, Nguyen PA, Hsu CC, 1997. The effect of operating and formulation variables on the morphology of spray-dried protein particles. Pharmaceutical development and technology 2, 213–223. [DOI] [PubMed] [Google Scholar]
- Maa YF, Prestrelski SJ, 2000. Biopharmaceutical powders: particle formation and formulation considerations. Curr Pharm Biotechnol 1, 283–302. [DOI] [PubMed] [Google Scholar]
- Manning MC, Chou DK, Murphy BM, Payne RW, Katayama DS, 2010. Stability of Protein Pharmaceuticals: An Update. Pharmaceutical Research 27, 544–575. [DOI] [PubMed] [Google Scholar]
- Moorthy BS, Schultz SG, Kim SG, Topp EM, 2014. Predicting Protein Aggregation during Storage in Lyophilized Solids Using Solid State Amide Hydrogen/Deuterium Exchange with Mass Spectrometric Analysis (ssHDX-MS). Molecular Pharmaceutics 11, 1869–1879. [DOI] [PMC free article] [PubMed] [Google Scholar]
- Moorthy BS, Zarraga IE, Kumar L, Walters BT, Goldbach P, Topp EM, Allmendinger A, 2018. Solid-State Hydrogen–Deuterium Exchange Mass Spectrometry: Correlation of Deuterium Uptake and Long-Term Stability of Lyophilized Monoclonal Antibody Formulations. Molecular Pharmaceutics 15, 1–11. [DOI] [PubMed] [Google Scholar]
- Moussa EM, Wilson NE, Zhou QT, Singh SK, Nema S, Topp EM, 2018. Effects of Drying Process on an IgG1 Monoclonal Antibody Using Solid-State Hydrogen Deuterium Exchange with Mass Spectrometric Analysis (ssHDX-MS). Pharm Res 35, 12. [DOI] [PubMed] [Google Scholar]
- Nakagawa K, Hottot A, Vessot S, Andrieu J, 2007. Modeling of freezing step during freeze-drying of drugs in vials. AIChE Journal 53, 1362–1372. [Google Scholar]
- Pikal MJ, 1990. Freeze-drying of proteins. Part I: process design. BioPharm 3, 18–27. [Google Scholar]
- Poornachary SK, Parambil JV, Chow PS, Tan RBH, Heng JYY, 2013. Nucleation of Elusive Crystal Polymorphs at the Solution–Substrate Contact Line. Crystal Growth & Design 13, 1180–1186. [Google Scholar]
- Schüle S, Frieß W, Bechtold-Peters K, Garidel P, 2007. Conformational analysis of protein secondary structure during spray-drying of antibody/mannitol formulations. European Journal of Pharmaceutics and Biopharmaceutics 65, 1–9. [DOI] [PubMed] [Google Scholar]
- Simperler A, Kornherr A, Chopra R, Bonnet PA, Jones W, Motherwell WDS, Zifferer G, 2006. Glass transition temperature of glucose, sucrose, and trehalose: an experimental and in silico study. The journal of physical chemistry. B 110, 19678–19684. [DOI] [PubMed] [Google Scholar]
- Sonner C, Maa YF, Lee G, 2002. Spray freeze-drying for protein powder preparation: Particle characterization and a case study with trypsinogen stability. Journal of pharmaceutical sciences 91, 2122–2139. [DOI] [PubMed] [Google Scholar]
- Sophocleous AM, Zhang J, Topp EM, 2012. Localized hydration in lyophilized myoglobin by hydrogen-deuterium exchange mass spectrometry. 1. Exchange mapping. Molecular pharmaceutics 9, 718–726. [DOI] [PMC free article] [PubMed] [Google Scholar]
- Souillac PO, Middaugh CR, Rytting JH, 2002. Investigation of protein/carbohydrate interactions in the dried state. 2. Diffuse reflectance FTIR studies. International Journal of Pharmaceutics 235, 207–218. [DOI] [PubMed] [Google Scholar]
- White S, Bennett DB, Cheu S, Conley PW, Guzek DB, Gray S, Howard J, Malcolmson R, Parker JM, Roberts P, 2005. EXUBERA®: pharmaceutical development of a novel product for pulmonary delivery of insulin. Diabetes technology & therapeutics 7, 896–906. [DOI] [PubMed] [Google Scholar]
- Wilson NE, Mutukuri TT, Zemlyanov DY, Taylor LS, Topp EM, Zhou QT, 2020. Surface Composition and Formulation Heterogeneity of Protein Solids Produced by Spray Drying. Pharmaceutical Research 37, 14. [DOI] [PMC free article] [PubMed] [Google Scholar]
- Wilson NE, Topp EM, Zhou QT, 2019. Effects of drying method and excipient on structure and stability of protein solids using solid-state hydrogen/deuterium exchange mass spectrometry (ssHDX-MS). International Journal of Pharmaceutics 567, 118470–118470. [DOI] [PMC free article] [PubMed] [Google Scholar]
- Yoshioka S, Aso Y, Kojima S, 1999. The effect of excipients on the molecular mobility of lyophilized formulations, as measured by glass transition temperature and NMR relaxation-based critical mobility temperature. Pharm Res 16, 135–140. [DOI] [PubMed] [Google Scholar]
Associated Data
This section collects any data citations, data availability statements, or supplementary materials included in this article.


