Abstract
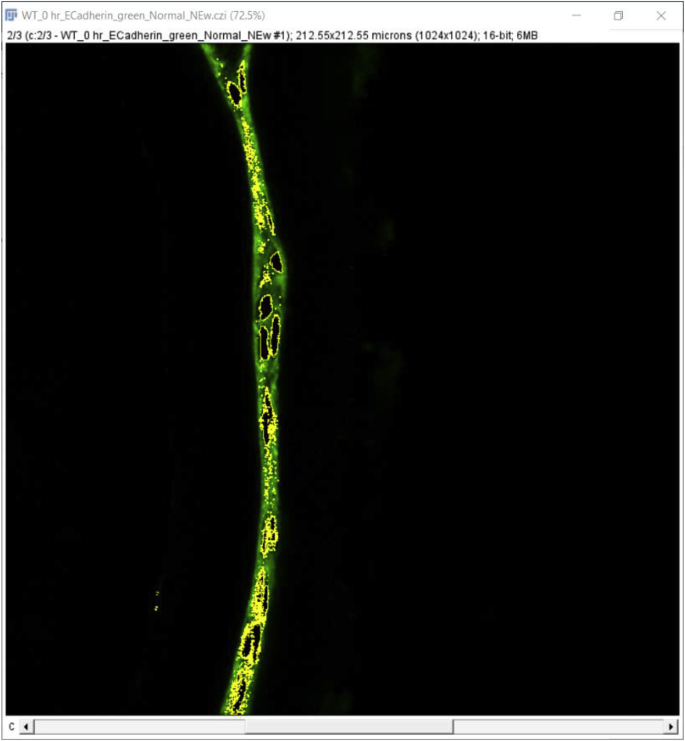
Western blotting (WB), enzyme-linked immunosorbent assay (ELISA) and flow cytometry (FC) have long been used to assess and quantitate relative protein expression in cultured cells and tissue samples. However, WB and ELISA have limited ability to meaningfully quantitate relative protein levels in tissues with complex cell composition, while tissue dissociation followed by FC is not feasible when tissue is limiting and/or cells difficult to isolate. While protein detection in tissue using immunofluorescent (IF) probes has traditionally been considered a qualitative technique, advances in probe stability and confocal imaging allow IF data to be easily quantitated, although reproducible quantitation of relative protein expression requires careful attention to appropriate controls, experiment design, and data collection. Here we describe the methods used to quantify the data presented in Shihan et al. Matrix Biology, 2020 which lays out a workflow where IF data collected on a confocal microscope can be used to quantitate the relative levels of a molecule of interest by measuring mean fluorescent intensity across a region of interest, cell number, and the percentage of cells in a sample “positive” for staining with the fluorescent probe of interest. Overall, this manuscript discusses considerations for collecting quantifiable fluorescent images on a confocal microscope and provides explicit methods for quantitating IF data using FIJI-ImageJ.
Keywords: ImageJ, Confocal microscopy, Immunofluorescence, Mean fluorescence intensity (MFI), Cell counting, Protein quantitation
Graphical abstract
Highlights
These simple methods:
-
•
Allow quantitation of molecules in small tissues using immunofluorescent (IF) detectionon tissue sections.
-
•
Generate data that correlate well with that obtained from other methods.
-
•
Yield reproducible data that expands the conclusions possible from IF imaging of tissues with complex cellular compositions.
1. Introduction
Image analysis is playing an increasingly important role in scientific research as the computational power and digital camera technology necessary to collect and analyze images at high resolution have become more generally available. In recent years, image analysis has been more frequently applied to quantitative measurement of numerous parameters including protein expression levels in cells and tissues, the number of cell nuclei in a tissue sample or section, tissue area and perimeter, protein co-localization with other proteins or cellular structures, concentration, and densitometry analysis [[1], [2], [3], [4], [5]]. These investigations have revealed counterintuitive phenomena and have led to new research directions as these approaches reveal the distribution of molecules in individual cells, instead of as an “average” concentration across a cell population as is obtained with methods such as western blotting or ELISA [6]. Further, image analysis is particularly helpful when the tissue samples are limiting due to their small size or rarity, as more independent experiments are possible on tissue sections compared to traditional protein quantitation methods such as western blotting or flow cytometry which require much more starting material [7]. However, the generation of reproducible data from fluorescent images relies on high-quality molecular probes/antibodies, optimized immunostaining protocols, confocal microscope settings that collect images within the linear range of the detectors, and choice of image analysis method appropriate to answer the scientific question of interest.
Our work uses animal models and human cadaver tissue to study the pathophysiology of posterior capsular opacification (PCO), a major side effect of cataract surgery. As this condition arises when the small numbers of lens cells left behind in the eye following cataract surgery attract immune cells while entering the cell cycle and converting to a complex population of myofibroblasts, lens fiber cells and lens epithelial cells [1,[7], [8], [9], [10]], this work is not generally amenable to protein quantitation by western blotting or flow cytometry but is ideally suited to the detection of proteins and other molecules in tissue sections by confocal immunofluorescence. Here we present the step by step procedures used to quantitate the image data presented in our recent publication in Matrix Biology [1] which includes generally applicable parameters to acquire quantifiable immunofluorescence images via confocal microscopy, and the use of the widely used open-source image analysis tool, Fiji [2], to determine the mean fluorescence intensity (MFI) of a protein of interest in a tissue area of interest, automated counting of nuclei in an area of interest in a tissue sample, and the percentage of cells in a sample which are “positive” for staining with a fluorescent probe of interest.
2. Materials and methodological details
2.1. Sample preparation and immunofluorescence
All animal experiments presented here as example data were performed per the Association for Research in Vision and Ophthalmology (ARVO) Statement on the Use of Animals in Ophthalmic and Vision Research and are approved by the University of Delaware Institutional Animal Care and Use Committee. C57BL/6 mice (wildtype- 10 to 16 weeks old) obtained either from Jackson Laboratory (ME, USA) or Taconic Biosciences, Inc. (NY, USA) were subjected to lens fiber cell removal surgery which leaves behind the lens epithelium and capsule to model human cataract surgery [3]. Extensive examples of the quantitation approach described here can be viewed in Shihan et al., 2020 [1]. We typically euthanize animals at the times of interest, isolate eyes, fresh freeze the isolated eyes in OCT media, create 16 μm sections on a cryostat, and immunostain sections using methods that are developed and validated for each antibody (see supplemental Table 1 of Shihan et al., 2020 [1] for examples). Whenever possible, we use “knockout verified” antibodies whose specificity has been validated using mouse tissue from animals lacking the gene of interest. When such antibodies are unavailable, antibodies are selected based on the strength of evidence in prior publications, ability to recapitulate known expression patterns/cellular distributions, and correlations between the staining intensity obtained and RNA and/or protein expression levels elucidated using unbiased methods (such as proteomics/RNA-Seq). The classic criteria often used, i.e. gives a single band on a Western blot, is generally a less reliable measure of specificity for immunolocalization experiments due to the profound differences in the chemistry of immunolocalization and Western blot (WB) protocols. For instance, conformation-specific epitopes are not detectable by WB due to protein denaturation, while sequence specific epitopes may be masked in immunolocalization due to protein folding. In the end, while many antibodies which give a single band on a Western blot can be used for immunofluorescent detection on tissue, it is very common for them to either not stain tissue sections at all, or stain with a very high background that prevents visualization of gene expression patterns.
These primary antibodies can either be directly labeled with a fluorescent dye (see example below for α smooth muscle actin) or can be detected using indirect (antibody against an antibody) immunofluorescent approaches. Whenever possible, fluorescent labels whose chemistry prevents fast photobleaching (molecular breakdown) in response to excitation should be used, and careful choice of a fluorescent dye(s) based on their distinct excitation and emission spectra can allow for the detection of four or more molecules simultaneously on a single tissue section. Our generalized laboratory protocol for immunofluorescent analysis of protein expression in ocular sections can be found in Reed et al., 2001 [4] and the details of the immunostaining protocols used in this study are described in Shihan et al., 2020 [1]. Once fluorescently stained and coverslipped slides are obtained by these methods, they are imaged using confocal microscopy.
Note: it is important that the staining be repeated on at least 3–5 independent biological replicates for each experimental condition to ensure that sufficient data is generated for downstream statistical analysis of the quantitated images. If variations in morphology are expected depending on the plane of section, it is recommended that several technical replicates be performed on each biological replicate to ensure that similar tissue views are compared.
2.2. Confocal image acquisition
2.2.1. How does a confocal microscope work?
Laser point-scanning confocal microscopy (LSCM) is a technique that has revolutionized the application of fluorescence microscopy to a wide variety of biological and biomedical research fields. Fluorescence microscopy relies on excitation of fluorophores by one wavelength of light resulting in the re-emission of light at a longer wavelength. The use of bandpass filters allows the exciting light to be excluded from the field of view so that the emitted light from the fluorescent probe can be specifically recognized by a detector. In conventional wide-field microscopy, fluorescence is collected not only from the plane of focus but also from regions above and below, which blurs images. In contrast, confocal microscopy selectively collects light from a single thin optical section (<1 μm for high numerical aperture objectives) within a three-dimensional specimen. Structures at the focal plane appear therefore sharper and are better resolved. LSCM utilizes a laser beam as a source of illumination that is focused into a diffraction-limited spot in the specimen. Emission of the fluorophores from this spot are refocused onto a conjugate image plane in the scan head of the microscope where a pinhole is placed, and is then detected by a photomultiplier tube (PMT), which converts these photons into an electrical signal representing the intensity of the detected light. Thanks to this setup, out-of-focus light emission from planes above and below the excitation spot is not refocused in the conjugate image plane and thus do not go through the pinhole as efficiently as in-focus emission. To acquire a 2D image, the excitation spot is scanned across the specimen, and emission is serially detected spot after spot, line after line. Each spot is visualized as a pixel in the final image and each pixel has an intensity value associated with it. Intensity values are displayed by assigning a different shade of grey (or pseudo-color) and can, therefore, provide qualitative data visible to the eye. Importantly, images acquired by confocal microscopes can also provide quantitative measurements since an image is basically a visual representation of a matrix of intensity values.
-
1.
Samples should be prepared for immunofluorescence as described previously [1,4].
-
2.
The sample slide or sample should be placed in the appropriate sample holder of the confocal microscope.
-
3.Open the confocal microscope software; for the examples given here, a Zeiss LSM 880 confocal microscope running ZEN 2.3 SP1 (black) software was used. Similar principles would apply to confocal microscopes from any manufacturer.

-
4.
Select the desired objective lens The objectives C- Apochromat 40×/1.2 W, Plan-Apochromat 40x/1.3 Oil, or Plan- Apochromat 20x/0.8 were used in the published study [1] and the examples presented here.
Objective lens selection is usually based on the field of view necessary to visualize the desired features of the section to be imaged. Caution should be used when selecting a high magnification objective as this can lead to unconscious user bias since it can narrow the field of view to a potentially unrepresentative subset of the tissue/specimen. These biases can be overcome by conducting a tile scan that stitches together images from across the specimen to give a comprehensive view of the specimen (as described below). Specific directions on microscope objective selection and pairing an objective with appropriate immersion media, coverslip thickness, and mounting media can be usually found in manufacturer documentation/websites.
-
5.
Find the desired region of interest and focal plane To ensure that the microscope will be capturing the desired portion of the specimen, the specimen is typically viewed through the eyepieces via the wide field fluorescence capability of the microscope. In the ZEN software, the user should click on the ‘Locate’ tab, then select the wavelength of light appropriate to view the fluorescent dye of interest. The example here shows that the 40× objective and the “Green” channel were selected to visualize green fluorescent dyes (e.g. Alexa Fluor 488, Atto 488, DyLight 488, or fluorescein). Once the “Green” channel is selected, the proper filter cube (i.e. FSet38 HE) is positioned beneath the objective.
-
6.
Selection of filters for imaging multiple fluorophores
Modern confocal microscopes come equipped with multiple laser lines and/or tunable lasers, which allow the use of a wide array of excitation wavelengths. Further, microscopes are fitted with multiple emission filters which are appropriate for different fluorophores which either let a narrow band of wavelengths through (bandpass filters) to increase specificity, or a wider range of wavelengths which can increase the sensitivity of detection. While labeling specimens with multiple fluorescent probes simultaneously is a powerful approach, care must be taken to ensure that each fluorescence signal can be unambiguously distinguished.
Configuration of the light path consists of four major components; the objective, the laser line, the dichroic mirror, and the emission bandpass filter. The dichroic mirror is used to reflect excitation light and redirect it to the objective, and to transmit longer wavelengths of light for the light to reach the detectors. Therefore, depending on the experimental design, the correct dichroic mirror needs to match the selected laser line(s) for the experiment. Also, the emission bandpass filters need to be selected as they determine which range(s) of wavelengths of light reach the detector for image acquisition. This produces a tradeoff between sensitivity (which would be maximized if a broad range of the emission spectrum is allowed to reach the detector) and selectivity (which would be optimized by selecting narrow emission bandpass filters). On the ZEN software, this is accomplished using the “Acquisition” tab.
Some confocal software systems, like ZEN, offer a large database of fluorophores to choose from. Once a dye is selected, ZEN automatically applies all necessary settings in the imaging system, such as the choice of laser lines, dichroic mirrors, and emission bandpass filters. This feature is called “Smart Setup” in ZEN.
The chosen imaging channels can be viewed under the “channels” menu found on the acquisition menu screen. Note: In the example, A488 and DRAQ are on the same track signifying that during imaging these two dyes will be acquired simultaneously which works well as these two fluorophores have well-separated emission spectra, but would not be recommended for detecting fluorophores with overlapping emission spectra (such as A568 and DRAQ). In those cases, sequential imaging of the fluorophores would be advised with the tradeoff of longer acquisition times.
7. Image Acquisition
The nature of the specimen, potential differences in morphology in the “Z-axis” of the specimen, and potential for disruptions in tissue architecture by sectioning should all be considered when choosing the focal plane for image capture. In some cases, it will be desirable to collect a Z-stack through this thick sample, then to choose the plane of focus for quantitation based on its brightness and morphology. Alternatively, the image to be quantitated can be collected at a depth mid-way into the specimen which is selected using the live acquisition feature using a pinhole (recommended to be set at 1 AU) that allows for a high-resolution image to be collected. In some cases, a maximum intensity projection (MIP) can be created by taking the highest pixel intensity of each area of a 3D image created from the Z-stack and combining them into one 2D image, and using the resulting image for quantitation. However, MIPs can be inaccurate for complex tissues as they are based on the highest intensities across all layers of the 3D image. Therefore, it can be better to use average intensity projections (AIP) for quantitation as they use the average pixel intensity for all the layers in the 3D image and combines them into the 2D image. For quantification of the entire volume of a Z-stack, it is recommended to use more advanced image analysis programs (such as Imaris, Volocity, etc.) instead of ImageJ/FIJI as these programs enable 3D segmentation. Z-stacks are particularly advantageous in cell counting applications as they allow counting of more cells from each specimen which can allow statistically significant conclusions to be reached from fewer specimens.
In the index study described here, the specimens were relatively thick (16 μm) and the morphology at different specimen depths variable, so we chose a single plane of focus midway into the specimen for all downstream analyses. The brightest focal plane with sharp morphological features was selected by scanning the specimen using the “Live” button in ZEN.
-
8.
Setting image collection parameters
PMTs detect light by converting incoming photons into electrical signals whose potential can be measured and digitized. The PMT detectors are calibrated by the manufacturer and the linearity of the responses are checked during maintenance, then repaired/replaced if the response deviates from linearity. The range indicator feature of the confocal software can be used to determine whether the image is collected within the linear range of the detector or not. In the ZEN software that runs Zeiss confocal microscopes, pixels that are set to “zero” are viewed as blue in the range indicator. Pixels that are set at the maximum signal that the detector considers are viewed as red (a level of 255 or 4095 for 8 or 12-bit images respectively) and the dynamic range of linear detection is viewed by pixels appearing grey in the range finder. The examples included here were collected at 12-bit or 16-bit. The final goal is for the detector to give a linear response across the full range of fluorescent intensities seen within an experiment so that the signals can be quantitated and compared between treatment groups.
Adjusting laser power
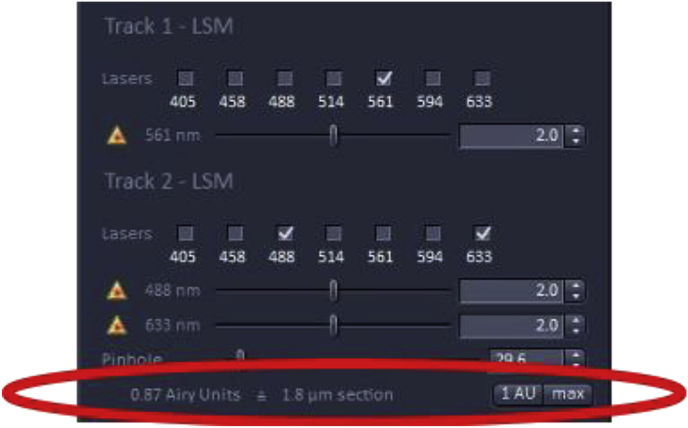
It is important that the laser intensity be as low as possible to minimize photobleaching and saturation of fluorophores, while maintaining an adequate signal-to-noise ratio for image analysis. In the example below, the specimen is labeled with three probes Alexa Fluor 568 (A568), A488, and DRAQ5 [13] that are excited at 568 nm, 488 nm, and 633 nm, respectively.
Selecting laser track
How to change the laser power
Underneath each laser menu, the wavelength selection is shown with a scroll bar to its right with the number 2.0 selected which represents the laser intensity expressed as the percentage of the maximum laser power available. If the laser power is increased, the energy hitting the.
fluorescence probe on the specimen will increase, with the tradeoff of increasing photobleaching which is problematic for quantitation as the signal will decrease during image acquisition. Therefore, it is recommended to leave the laser power at 2% or below, however, this can depend on the properties of the fluorophore, objective, laser wavelength, age of the laser, and wattage. For quantitation, it is essential that the laser power be kept constant across the analysis as laser power will affect the fluorescent output of the fluorophores.
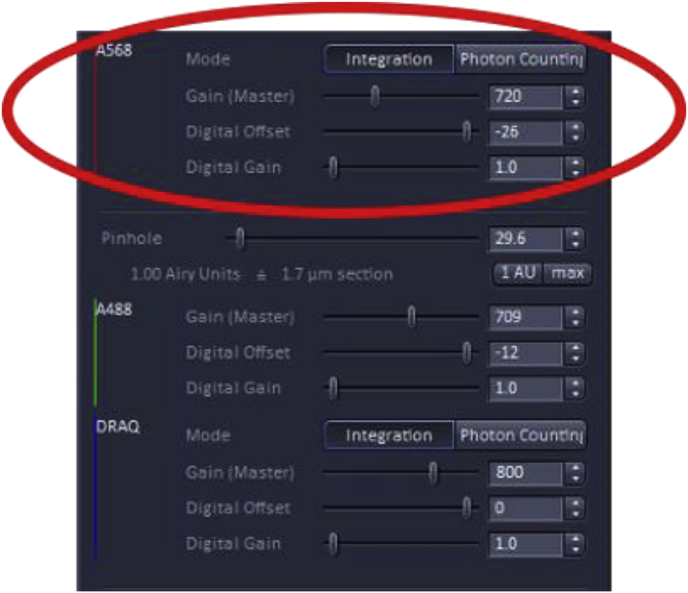
How to adjust pinhole and PMT settings for individual channels
Adjusting the pinhole
Beneath the laser power, there is an option to adjust the pinhole diameter which is often expressed in Airy units (AU) which are defined as 1 Airy Unit = (0.61× wavelength of light x total Magnification)/Numerical aperture of the lens used for imaging [5]. Decreasing the pinhole sharpens the image as it reduces the amount of out-of-focus light reaching the detector with the tradeoff of reduced signal intensity. The recommended setting for the pinhole is usually 1 AU which yields a good compromise between the amount of out-of-focus light excluded and the signal collected. The pinhole size may be increased to above 1 AU to allow more light to reach the detector, but the image will be less sharp as more out-of-focus light In some cases, a smaller AU is desirable when the sample is morphologically complex as it gives a thinner optical slice which can be easier to interpret, although the amount of light reaching the detector will be greatly attenuated.
Adjusting master gain, digital offset, and digital gain
The Master gain, digital offset, and digital gain in conjunction with laser power, are adjustments that set the threshold of detection and the dynamic range of the detectors which are key for reliable quantitation.
The first setting is ‘Gain (Master)’; this setting adjusts the sensitivity of the detector, however, increasing the sensitivity can also increase the noise detected. It is recommended to not go above 800–850 for gain master. The second setting is ‘Digital Offset’, adjusting this setting allows background/noise to be removed from the final confocal image. The third setting is ‘Digital Gain’, adjusting this setting re-amplifies intensities from master-gained images. This amplifies the signal at the same rate as it amplifies noise. It is recommended to leave this value set to 1.
Adjustments using the range indicator
The range indicator feature of ZEN is used to set the threshold and linear range of detection.
Once this feature is activated, the image will appear either black and white or interspersed with blue or red pixels, depending on what the Master gain and offset values are relative to the fluorescent signal intensity. Blue indicates that the signal in an area is “zero” while red indicates that the signal is at or over the maximum that the detector can image linearly. Shades of grey indicate signals in the linear range of detection.
There are different valid approaches to setting the digital offset of an imaging experiment that will be used for quantitation. If the entire image set is collected so that tissue areas with low signal (such as would be seen in slides where the primary antibody is omitted during staining) are at the edge between grey and blue with just a few “blue” pixels showing on the range indicator, while the expected brightest areas are set similarly at the high end as mostly grey with just a few “red” pixels, the PMT will be able to respond linearly to the full range of signals generated in the experiment. Alternatively, the lower end of the scale can be set by adjusting the Master gain and offset to values that set a region of the slide with no tissue (i.e. the glass/mounting media) to “blue” (Fig. 1B). If using this approach, care must be taken to not set the offset so low that the real signal is subtracted out of the image, this is usually best accomplished by reducing the offset until the region without tissue just turns blue with a few grey pixels. The appropriateness of this setting can be confirmed by viewing tissue stained with secondary antibody alone (Fig. 1D) which would be expected to produce signals at the edge between “blue” and “grey”. It is also critical to have few or no red (saturated) pixels in the final image. If the signal is too bright in some regions of the specimen (Fig. 1F).
Fig. 1.
Acquisition of a confocal image suitable for quantification Panel A is a representative confocal image of a section taken through the adult mouse lens epithelium stained for E cadherin (Alexa Fluor 488, green) and DNA (DRAQ5, blue) imaged with laser, master gain, and offset settings appropriate for quantitation as shown in the “range indicator” view of this image shown in Panel B which shows that areas lacking tissue have a very little signal (blue background), while few to no red pixels (signifying saturation of the detector) are seen. Panel C shows a negative control section through the lens epithelium that was created by omitting the primary antibody in the experiment, and Panel D shows the range indicator view of the negative control image Panel E is also a confocal image of a section taken through the adult mouse lens epithelium stained for E cadherin (Alexa Fluor 488, green) and DNA (DRAQ5, blue), however, the settings used have oversaturated the green channel as shown by the large number of “red” pixels seen in the range indicator view shown in Panel F. C- Lens Capsule, LC- Lens cells, Scale bar- 35 μm. (For interpretation of the references to color in this figure legend, the reader is referred to the Web version of this article.)
Note: As quantitation is often comparing control samples to those who have undergone an experimental manipulation, it is recommended to adjust the dynamic range using the brightest specimen in the experimental set which could be either the control or experimental sample depending on whether up or down-regulation of a signal is seen. Whenever possible, data for quantitation should be captured as 12 or 16-bit images as this allows better discrimination between pixel intensities compared to 8-bit images.
Caveat: If the experimental manipulation results in a very large upregulation of expression/fluorescent signal, the method described above might result in an inability to measure endogenous expression levels using settings that keep the most robust signals within the linear range of the detector as we have documented in prior publications [6,7]. In some cases, the extent of signal upregulation may be extreme enough that the detectors are not able to encompass the entire dynamic range of the experiment making it impossible to accurately quantify the full extent of the observed change in gene expression.
(Optional) Tile Scans
Tile Scans allow multiple images spanning the entire specimen to be collected, which are then stitched together into 1 image. This helps minimize selection bias when imaging as the user will not just put their attention on one particular region of the specimen/slide but its entirety during quantification.
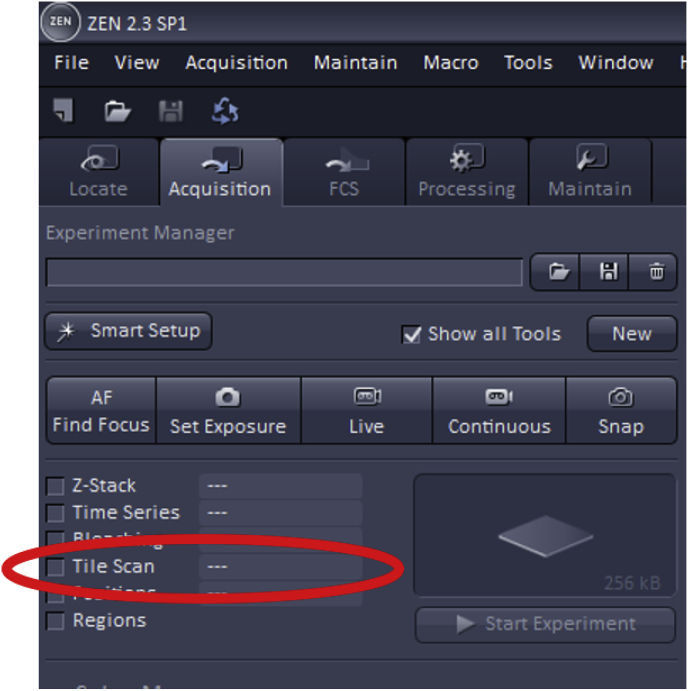
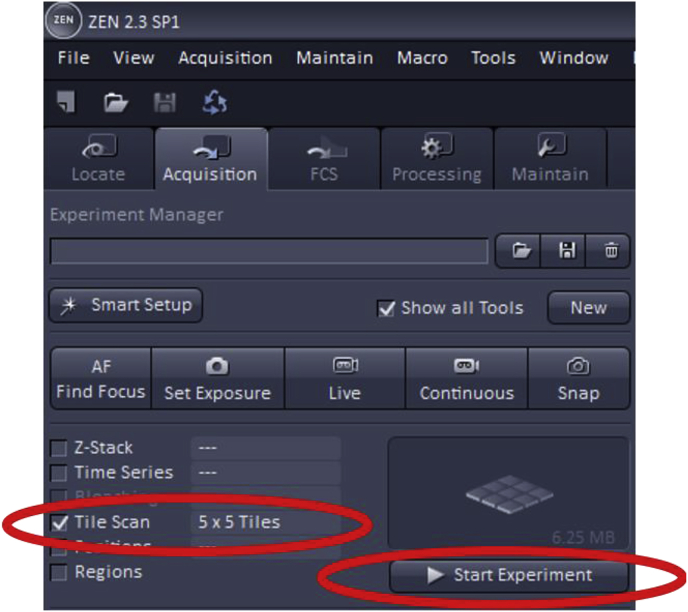
To use Tile Scan, first, check the ‘Tile Scan’ box which is found at the top left of the acquisition mode page.
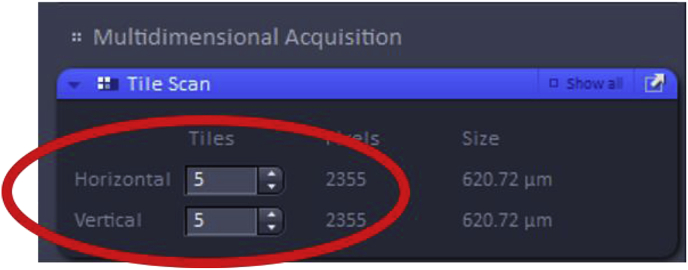
The number of tiles must then be set, a parameter which determines how many images in the vertical and horizontal direction will make up the area of the final acquired image. Some trial and error may be necessary when choosing the dimensions of the desired image as it can vary by the specimen and objective.
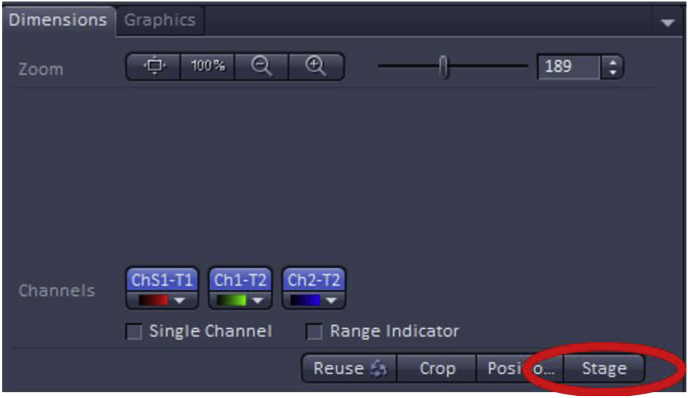
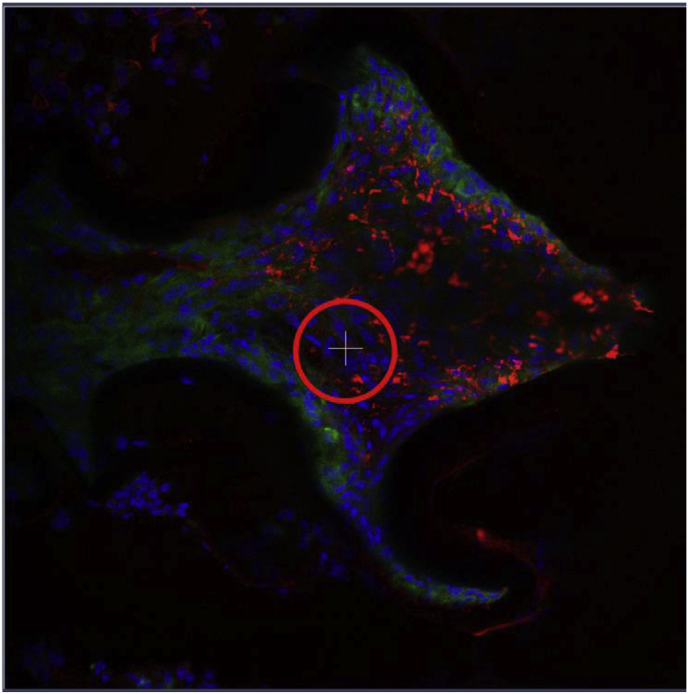
Once the number of images that will encompass the final scan has been selected, the field of view should be set to the middle of the specimen using the microscope ocular and this can be further adjusted by using the dimension tab under “image” then selecting the Stage button at the bottom to set up the new center for imaging. The Tile Scan feature will use this position as the middle of the image then will capture the area around it. An example of the Stage function is shown below for a standard confocal image.
Once the imaging settings (gain, offset, digital offset) are adjusted as described above, the Tile Scan will begin once ‘Start Experiment’ is clicked.
(Optional) Z-Stacks
Z-Stack acquisition allows multiple images to be collected across the entire thickness of the specimen, which can either be viewed separately, stitched together into a 3D image of the specimen, or combined into a maximum intensity (MIP) or average intensity (AIP) projection to allow the 3D image to be viewed in two dimensions. This approach helps remove selection bias when imaging as data is collected from the entire Z dimension of the specimen. However, this feature when paired with a tile scan can result in long acquisition times and very large files that can be difficult to analyze on a consumer-grade computer.
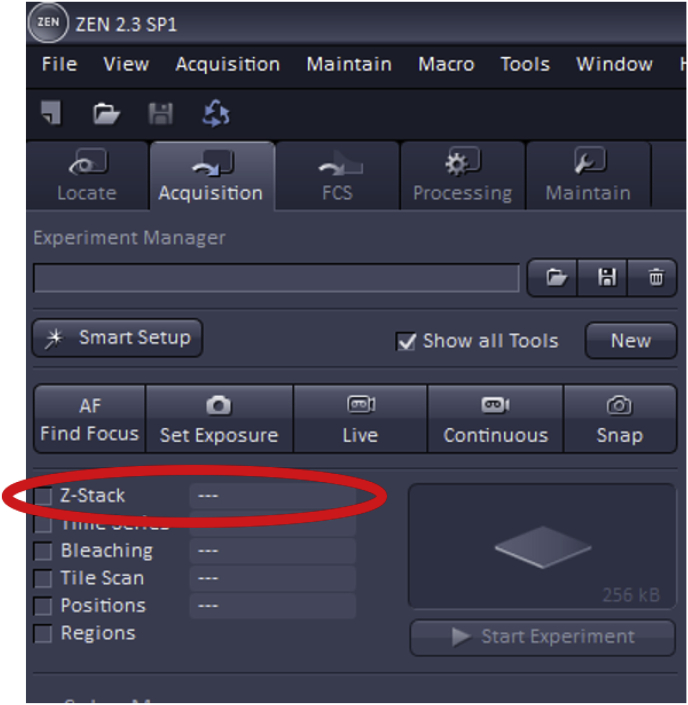
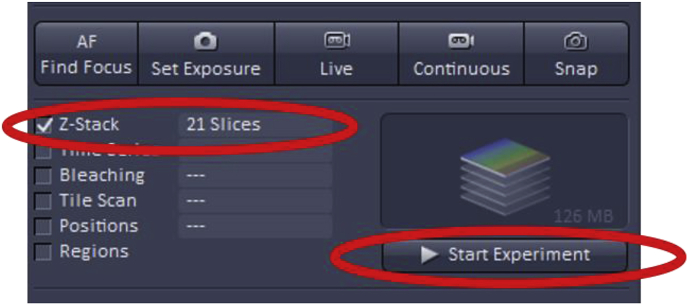
To use Z-Stack, first, check the ‘Z-Stack’ box which is found at the top left of the acquisition mode page.
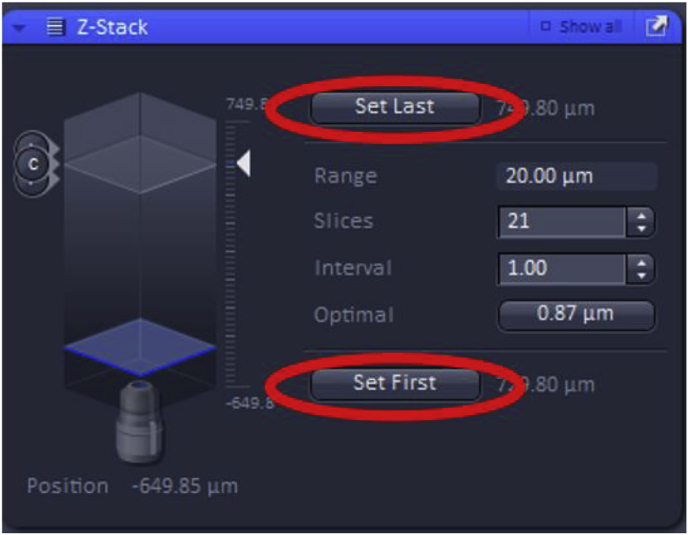
Then, the first and the last focal plane of the Z-stack must be set, which will ideally be the focal planes slightly out-of-focus on either side of the specimen. These can be set by using the “Live” button.
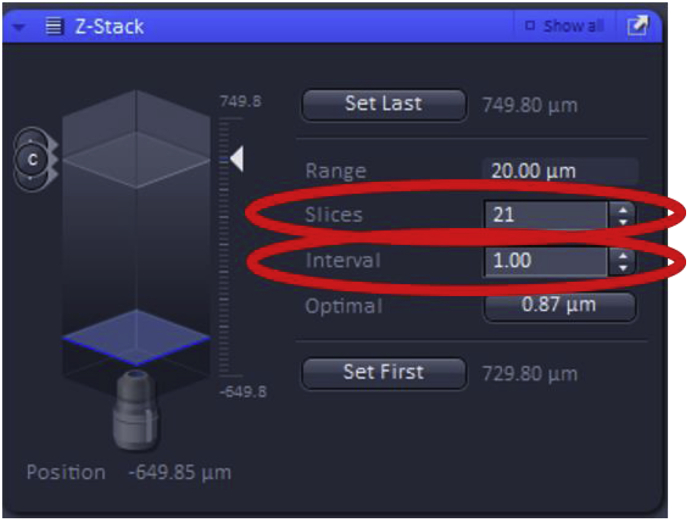
Further settings for Z-Stack include “slices” and “intervals”. Increasing the number of slices collected will adjust the total range (number of images) that the Z-Stack will take improving Z-axis resolution while also increasing the acquisition time. The “interval” can also be modified which sets the z-step size between the slices in the Z-Stack (shown in μm). Changing the interval will automatically adjust the number of slices and therefore, the total range of the Z-Stack image acquisition.
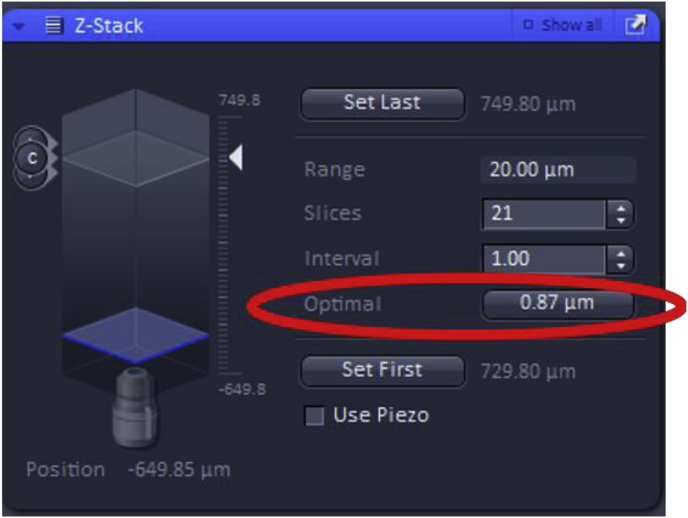
In addition, the “Optimal” feature can be used, which yields the optimal Z-stack resolution by adjusting the slices to keep the range within the limits defined by the Set First and Set Last.
Once the imaging settings (gain, offset, digital offset) are adjusted as described above, clicking ‘Start Experiment’ will begin Z-stack acquisition.
-
9
Adjusting the resolution of the image
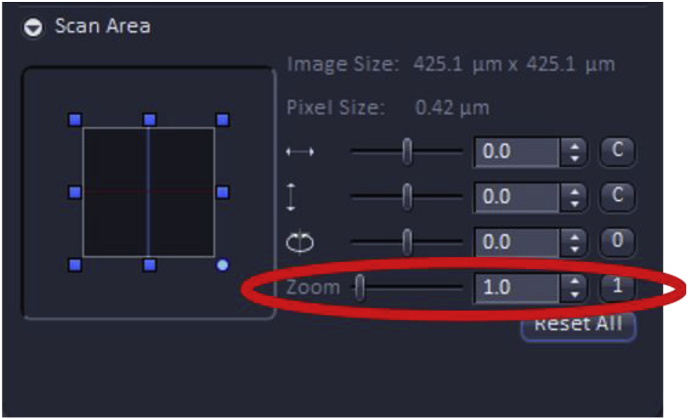
The “software” zoom feature can be used to increase or decrease resolution as it can decrease the size of each pixel which allows for the human eye to perceive details on the screen. However, if the “software” zoom feature is used, care should be taken to make sure that all images within an experimental set are collected at the same “software” zoom setting to ensure that direct comparisons can be made between images.
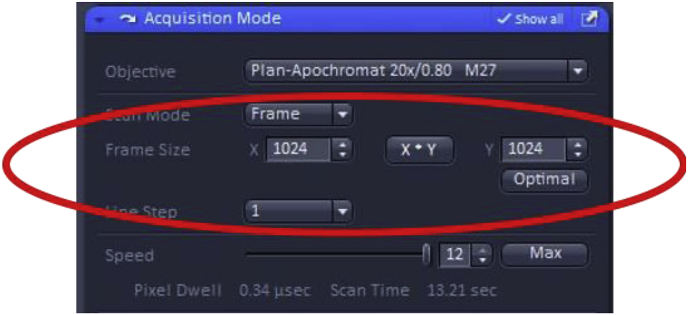
The Frame Size feature sets the resolution (i.e. pixel density) of the image. Higher resolution images are often desirable as they can be used for a wider array of purposes, including creating publication-quality figures, however, the trade-offs are longer image acquisition times and the need to store/manipulate larger files. However, images used solely for quantitation often do not need to be at the highest resolution (obtained by selecting “Optimal” in the Acquisition Mode window), particularly if signals from large areas are quantitated. We routinely collect images using a frame size of X-1024 and Y-1024 with a pixel size of 0.42 μm, which is a good balance between the need to collect publication-quality images and file size.
-
10
Adjusting speed and averaging
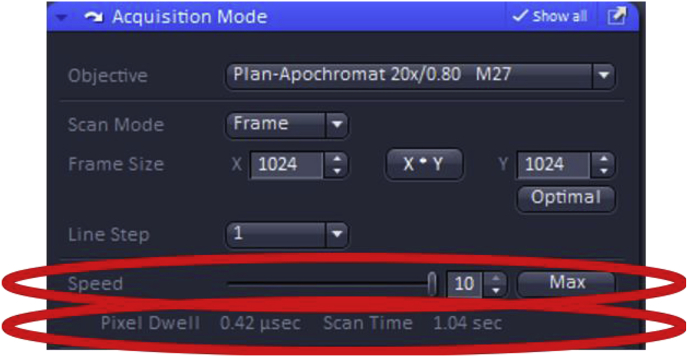
The image acquisition speed can also be adjusted to a faster setting to reduce photobleaching or decreased to obtain an increase in the signal to noise ratio. It is recommended that the scan speed be set at max for quantitation as it will reduce photobleaching as a scan of the specimens occurs faster result in a shorter pixel dwell time.
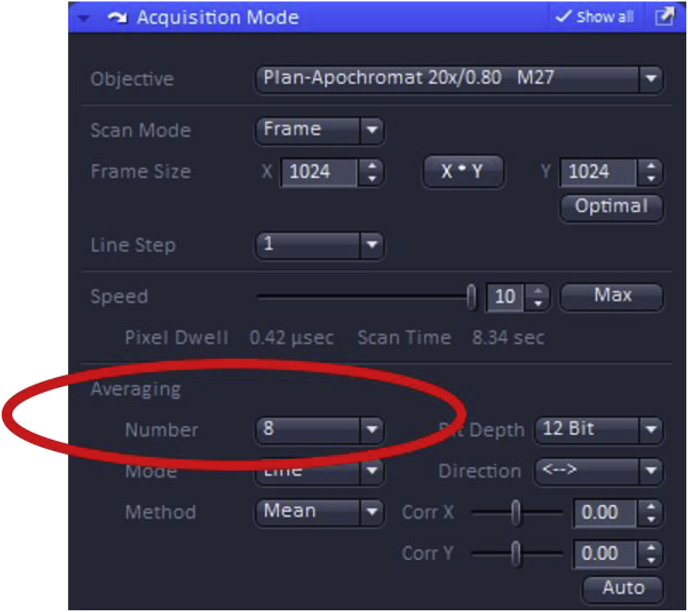
The depth of averaging can also be adjusted when setting up image acquisition parameters. Increasing the number of scans used to create the final “averaged” image minimizes noise in the final image, but results in longer acquisition time and can increase photobleaching, especially if the fluorophore is not highly photostable, and/or the initial signal is weak.
-
11
Positioning adjustment
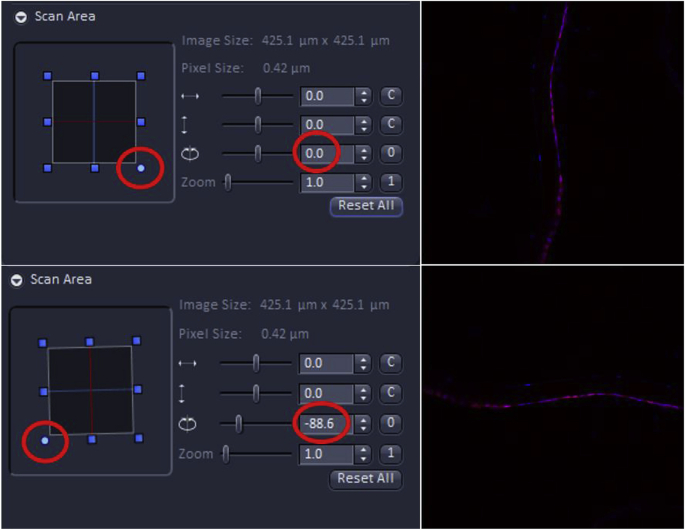
The user is encouraged to consider how the image being viewed on the screen compares to that typically shown in publications in the field. In this example, the lens epithelium attached to its basement membrane typically appears as a cellular monolayer immediately after cataract surgery, then expands into a plaque of cells as the wound healing response progresses. As confocal data shown in publication-quality figures are expected to show cells in similar orientations between experimental conditions, while different sections, or experimental samples often are placed on slides in random orientations, it will usually be necessary to rotate the images before data collection so that each image collected is in a similar orientation compared to the edge of the final image. This can be achieved using the image rotation feature under the scan area menu in ZEN. Note that the image only needs to be rotated until it is in the desired orientation compared to one side of the image edge, as further changes in orientation can be accomplished by using the rotate image features of a program such as Adobe Photoshop. The Scan Area menu can also be used to fine-tune the position of the region to be imaged, although this is usually best done by moving the motorized stage.
-
12
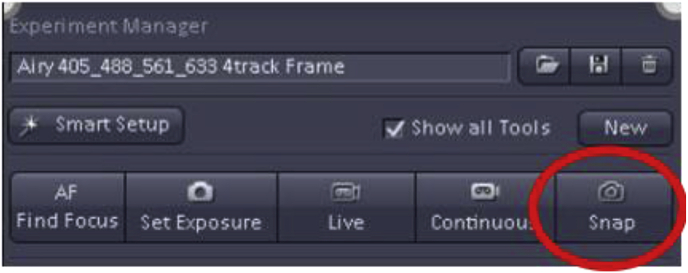
Click 'Capture/Snap' to obtain and save the image on the confocal microscope
Final Note: When collecting confocal images for quantitation, it is critical for the data to be collected within the linear range of the PMT detector. Once these parameters are set for the brightest samples from an experiment, all specimens/slides used for quantitation should be prepared under the same staining conditions (ideally during the same staining experiment) and imaged during the same confocal session. This reduces variability due to day to day differences in staining and confocal microscope behavior. Importantly, the same imaging settings (objective, light path, laser power, gain, offset, frame size, zoom, scan speed) should be applied to all specimens to be quantitated.
This section is not intended to provide a complete description of how a confocal microscope works and all of its possible uses, and instead focuses on practical advice for acquiring confocal images suitable for quantitation. Additional information on the basics of confocal microscopy can be found in, Pawley JB, ed (2006) Handbook of Biological Confocal Microscopy, Third Edition. Additional information specific to Zeiss microscopes can be found in an imaging guide produced by Zeiss Corporation (http://www.ueb.cas.cz/cs/system/files/users/public/01_common/imaging_facility/Zeiss_LSM_880/Zeiss_LSM880_manual.pdf).
3. Quantitation of images using ImageJ
3.1. The components needed to quantitate fluorescent images are-
-
1.
Fiji (Fiji is just ImageJ) [2] can be downloaded at https://fiji.sc/.
-
2.
A fluorescent image (file format-.lsm or.czi for Zeiss confocal microscopes). Other file formats are also supported. (https://imagejdocu.tudor.lu/faq/general/which_file_formats_are_supported_by_imagej).
-
3.
Windows, Mac OS, or Linux computer equipped with a mouse, and/or a touch screen with a pen, or drawing tablet (a high-resolution drawing tablet equipped with a drawing pen is highly recommended). In this example, we used two high resolution drawing tablets produced by Wacom (a DTK2420K0 Cintiq Pro (24-inch display) was used for all of the quantitation presented in Shihan et al., 2020 [1] while the Wacom One (13.3 Inch Graphics Display) is used when it is desirable to have a portable option, such as during COVID19-related laboratory closures).
3.2. Measurement of mean fluorescence intensity (MFI) in a region of interest (ROI)
This quantitation method is particularly useful for analyzing tissue sections as it is common for only a subset of the tissue area to contain the structure of interest, while it is also common for the number and/or shape of the cells/nuclei to be different between specimens/experimental conditions. Thus, simply measuring the total fluorescent intensity across the entire image would lead to the potentially erroneous conclusion that the sample with the smaller area/fewer cells exhibits less staining for the probe of interest than one that is larger in area or has more cells, when the reality is that they actually exhibit similar staining levels per tissue area. Thus, in these cases, MFI values, calculated from the sum of the values of all the pixels in the ROI divided by the number of pixels, are more likely to accurately reveal whether a cell/tissue sample is expressing a marker of interest at levels different from control.
3.2.1. Approach 1 (with an external drawing pen)
-
1.
Open the ImageJ software (Fiji is just ImageJ). ‘Mac OS’ users will find the menu options at the top of the screen while these will be found at the top of the Fiji window in the ‘Microsoft Windows’ version. Here, we have used ‘Windows’ to perform our analysis.
-
2.
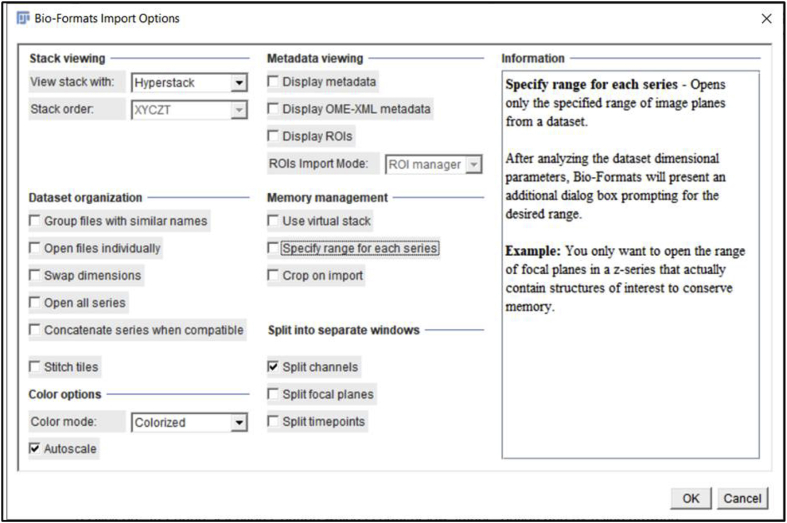
Click the ‘File’ tab, then click ‘Open’ to open the file you want to quantitate. A window will pop up named ‘Bio-Format Import Options’ (we used.czi files in this example). Whether this option “pops up” automatically depends on the file format, for example, this option does not pop up automatically when.lsm format files are used. This window gives several options such as ‘View stack with’, ‘Color mode’, etc. that can be chosen based on individual requirements. We used the ‘Hyperstack’ and ‘Colorized’ options as they allow independent analysis of each of the fluorescent channels collected in the original experiment. As the example data presented here were collected using three-color imaging (wildtype 0 h post cataract surgery sample; E-Cadherin (green) [1], α Smooth Muscle Actin (red) [8], DNA (blue)) (Fig. 2A), we clicked on the ‘Split channels’ option that pops up the three color channels in three separate windows so that quantitation of each fluorescent channel can be performed separately. Finally, hit ‘OK’ at the bottom right of the window to proceed to the next step of quantification. Here, we quantitate the expression levels of E-cadherin protein in this tissue sample as an example (Fig. 2B, only the green channel is shown).
-
3.
Click on the ‘Freehand selections’ button which is right below the ‘Image’ option, and then use the drawing pen to circle the area of the tissue to be quantitated (Fig. 2C). The more precisely this is drawn, the more accurate the MFI quantitation; thus, the use of a high resolution drawing tablet is highly recommended.
-
4.
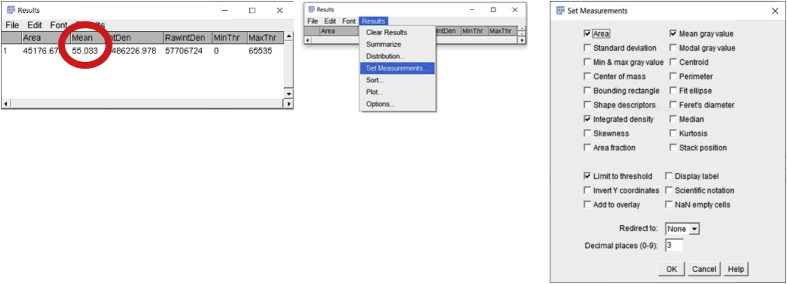
Once the desired tissue area is circled, click on the ‘Analyze’ button to select the ‘Measure’ option. A window will then pop up named ‘Results’ which includes a number of measurements that the software made on the selected area including Area, Mean, etc. (Fig. 2C). Additional quantitative and statistical parameters such as standard deviation, median, etc. can be included in the analysis by clicking on the ‘Results’ tab of the ‘Results’ window and then choosing the ‘Set Measurements’ option.
-
5.
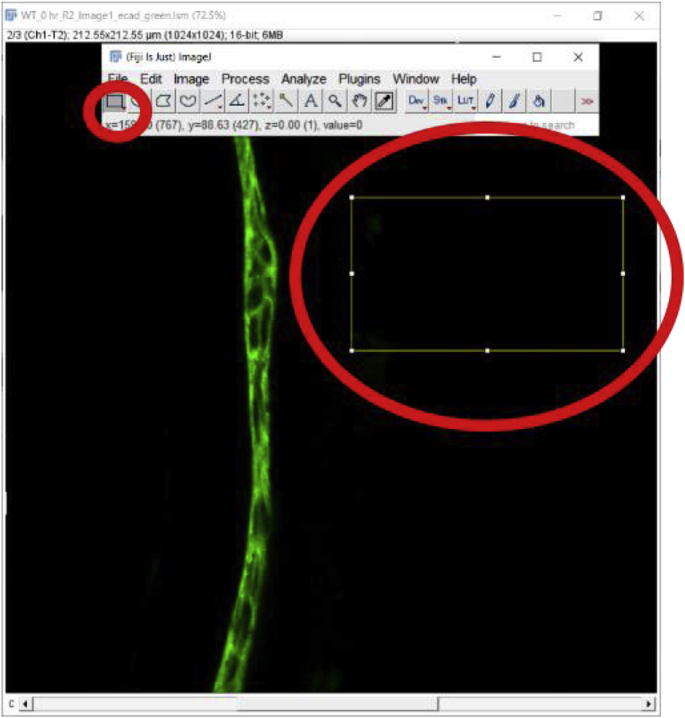
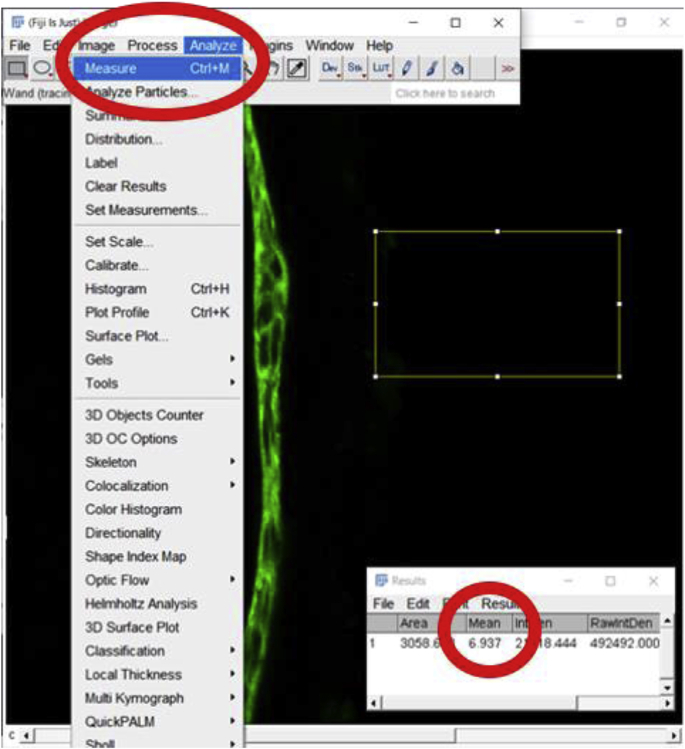
It is preferable to subtract the background MFI from the MFI of an ROI while analyzing images since the background of an image might affect the MFI quantitation. The above-mentioned steps can be repeated to select and measure a non-fluorescent area of the same image or a negative control prepared during the same experiment and imaged under the same confocal parameters as the image being quantitated [9]. MFI of that non-fluorescent area/negative control image is then subtracted from the tissue area MFI. The ‘Rectangle’ button under the ‘File’ option is a good way to draw a rectangle on the image to measure the MFI of the background (Fig. 2D). Here is a step by step method for measuring the MFI of a non-fluorescent area-
-
1.
Select the Rectangle selection tool and select a region with no staining to identify the background pixel value.
-
2.
Once the area is selected, go to “Analyze”, then click “Measure” to determine the background MFI value. In this case, the background value is 6.937.
-
3.
Final MFI = MFI of an ROI – MFI of Background: this step is usually done in Excel.
Fig. 2.
Quantitation of signal intensity in a region of interest using the Mean fluorescence intensity (MFI) method (Approach 1 (3.2.1)) A. Original confocal image of a section cut through an adult lens epithelium ((E cadherin (Alexa Fluor 488- green), αSMA (Cy3-Red) & DNA (DRAQ5-blue)). B. View showing the channel containing the E cadherin to be quantified. C. Selection of the region of interest by tracing the tissue using a high-resolution drawing tablet, and output from MFI measurement. D. Determination of the MFI of the background from a rectangular area of the image that lacks tissue and the output from that measurement. C- Lens Capsule, LC- Lens cells, Scale bar- 35 μm. (For interpretation of the references to color in this figure legend, the reader is referred to the Web version of this article.)
Note, if the background was obtained from negative controls, the same amount of background should be subtracted from all images that are being compared in an analysis. Further, although E−cadherin is typically a membrane protein that is found at both the plasma membrane and in the endoplasmic reticulum (ER)/secretory pathway, the mean area (shown here) included the nuclei. Thus, the MFI determined this way included pixels that are negative for E-cadherin and likely resulted in a lower MFI value than one that only includes membranous structures. If critical to the biological question being asked, it is possible to remove the area of the nucleus from this analysis, a method for quantitating only the non-nuclear expression of a protein of interest can be found below under the section ‘Automated determination of mean fluorescence intensity of cells expressing a nuclear/non-nuclear protein of interest (3.4)’.
3.2.1.1. Another approach to background subtraction
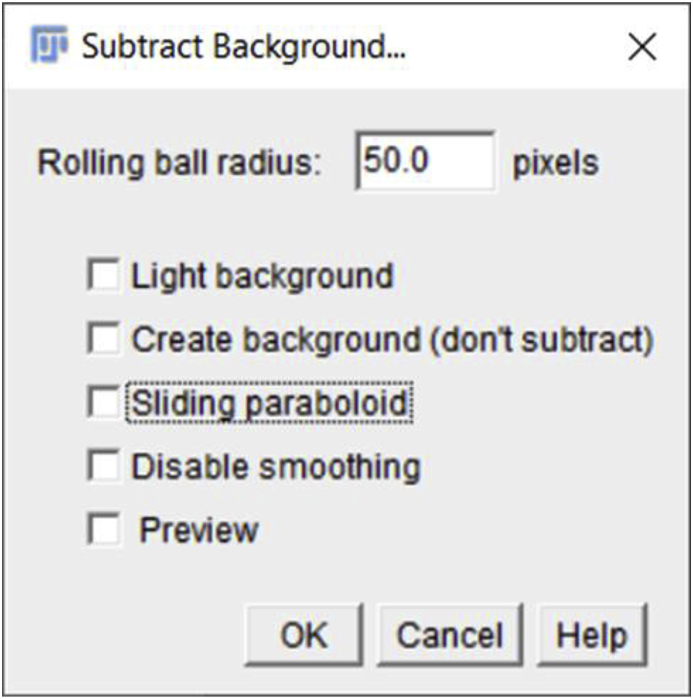
The method given above describes the basic step by step procedure that we used to determine Mean Fluorescence Intensity (MFI) values in our recent publication [1]. However, as Fiji offers many plugins, images can be processed in a variety of ways before analysis. For example, under the ‘Process’ option, the ‘Rolling ball radius’ feature can be used to calculate an average background value which can be subtracted from the image by clicking on the ‘Process’ tab and then choosing the ‘Subtract Background’ feature. The rolling ball radius plugin is usually only necessary when correcting for an unevenly illuminated background (https://imagej.net/Rolling_Ball_Background_Subtraction). If this option is chosen, the range value of the ‘Rolling ball radius’ should be kept the same for all the images being analyzed to ensure an unbiased comparison of the MFI between different experimental conditions.
Note-if the confocal images collected routinely exhibit uneven illumination, this indicates that the microscope needs service/recalibration so this method should seldom be necessary. This background subtraction option may also work for some image processing before segmentation, but this alternative background subtraction method is less recommended as it is not clear how the background values are obtained. Further, if the image is noisy, using the ‘rolling ball radius’ option to subtract background before measuring the MFI may yield an inaccurate value.
3.2.2. Performing image quantitation without an external drawing tablet (approach 2)
-
1.
Perform steps 1 and 2 as described in Approach 1 (3.2.1).
-
2.
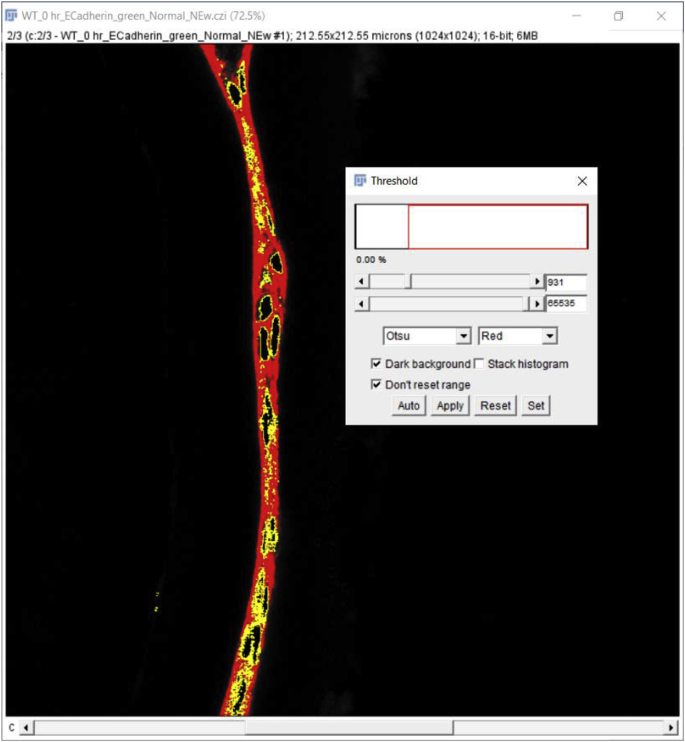
Click on the ‘Image’- go to the ‘Adjust’ tab-click on the ‘Threshold’ button. A window will pop up with a threshold and the color options allowing for the selection of threshold values based on the nature of the image and fluorescence intensity. Thresholding is a technique for segmenting an image into two classes of pixels, typically called ‘foreground’ and ‘background’. It works by choosing a value cutoff, thus every pixel less than that value is the background, while every pixel greater than that value is considered foreground. The choice of the ‘threshold’ value will depend on the eye of the user/observer/scientist, their empirically collected knowledge, experimental setup, and confocal imaging parameters (https://imagej.net/Thresholding). Here the settings are min threshold −867, which is the cutoff value, and max threshold −65535 with the color setting ‘Default’ with ‘Red’ options (16-bit image) (Fig. 3C).
-
3.
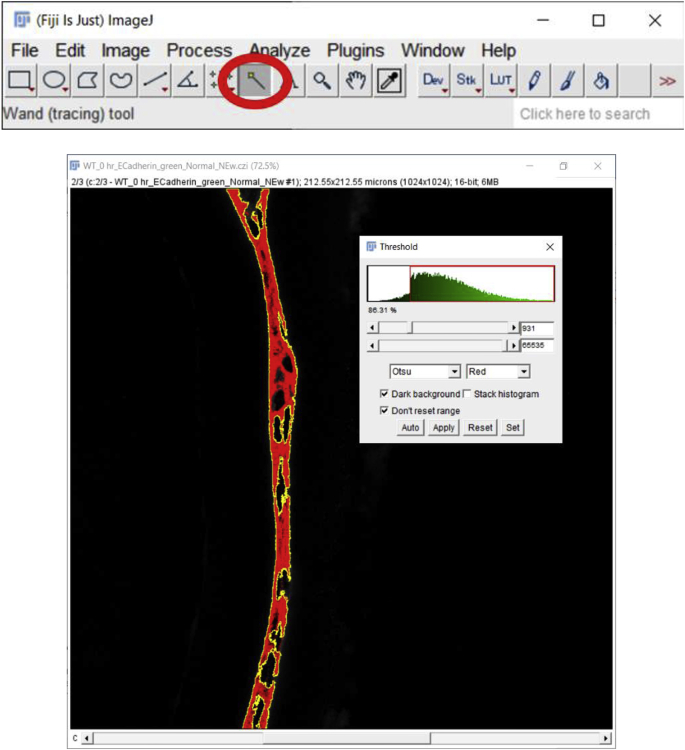
Next click on the ‘Wand (tracing) tool’ below the ‘Analyze’ button.
Fig. 3.
Mean fluorescence intensity (MFI) measurement of a non-nuclear protein using an automated region of interest selection based on a signal threshold (Approach 2 (3.2.2)) Panel A. Original confocal image of a section cut through an adult mouse lens epithelium (E cadherin (Alexa Fluor 488- green), αSMA (Cy3-Red) & DNA (DRAQ5-blue)). Panel B. View showing the channel containing the E cadherin to be quantified. Panel C. Automated selection of the region of interest using the “threshold” method. Panel D Clicking on the ‘Reset’ button to get back to the original image and the resulting output from the MFI measurement. C- Lens Capsule, LC- Lens cells, Scale bar- 35 μm. (For interpretation of the references to color in this figure legend, the reader is referred to the Web version of this article.)
Place the cursor on the segmented region displayed in red (preferably at one corner of the tissue otherwise this tool might only create a dot rather than capturing the whole tissue), click to capture the whole piece of stained tissue generated using the threshold button and press “Shift” if more than one region needs to be selected (Fig. 3C). Next, click on the ‘Reset’ button located on the ‘Threshold’ window to get back to the green color of E-cadherin staining and perform steps 4 and 5 mentioned above to measure the MFI (Fig. 3D). Note that the threshold value should be kept the same from image to image for accurate and unbiased quantitation. However, if the same threshold is applied to dimmer images (such as those that have intensities below 867 in this example), such as obtained for E−cadherin protein expression by wild type lens cells at 5 days post cataract surgery in this example, it will not be possible to use the same threshold for all images in an experimental set. In such an instance, the threshold will need to be adjusted empirically for each image, but this type of analysis should be performed “blindly” by renaming the files to avoid any bias. Further, as both approaches (approach 1 (3.2.1) and approach 2 (3.2.2)) yield slightly different MFI values for the same image (Fig. 2, Fig. 3D), it is important to use the same method for choosing the region of interest (ROI) for all of the images being analyzed within an experiment.
Approach 2 (3.2.2) is particularly useful for quantitating the MFI of nuclear-localized proteins as outlining a tissue area using a drawing pen will include both pixels derived from cytoplasmic/non-nuclear regions that lack the protein and protein-positive nuclei which will reduce the calculated MFI and could lead to unintended error if the experimental manipulation changes cell volume or shape. To determine the MFI for nuclear proteins, perform steps 1–3 of approach 2 (3.2.2) (Fig. 4A–C). Next, hold the ‘shift’ button on the keypad while clicking on each nucleus labeled after setting the ‘Threshold’ (Approach 2 (3.2.2), step 3) and continue this process until all labeled nuclei are selected (Fig. 4D). Next, click on the ‘Reset’ button located on the ‘Threshold’ window to get back to the original staining color of nuclear staining and perform steps 4 and 5 of approach 1 (3.2.1) to get the MFI of just the nuclear stain (Fig. 4E). Here we have shown the measurement of the MFI of pSmad3, a transcription factor important in canonical transforming growth factor-beta (TGFβ) signaling [10] which shows robust activation at 3 days post cataract surgery in wildtype remnant lens tissue [11] (Fig. 4A). Approach 2 (3.2.2) can be very laborious if the image has 100s of nuclei. In that case, it may be better to automate the selection of nuclei as described in the section ‘Automated determination of mean fluorescence intensity of cells expressing a nuclear/non-nuclear protein of interest’ (3.4).’ Further, this automated method can also be used to determine the MFI of a nuclear protein when its expression is quite low under some conditions while it is robustly expressed in others.
Fig. 4.
Mean fluorescence intensity (MFI) measurement of cell nuclei using automated region of interest selection based on a signal threshold (Approach 2 (3.2.2)) A. Original confocal image of a section cut through a WT mouse lens capsule at 3 days post cataract surgery (three-color imaging; (pSmad3- Alexa Fluor 568- red), αSMA (FITC- green) & DNA (DRAQ5-blue)). B. pSmad3 channel alone only. C. Adjusting the red channel to select for cell nuclei stained for pSmad3 protein by using the ‘Threshold’ button. D. Nuclei exhibiting pSmad3 staining above ‘Threshold’ are outlined in yellow and are ready for MFI quantitation. E. Click on the ‘Reset’ button to get back to the original image and results of MFI quantitation of pSmad3 levels in selected cell nuclei. C- Lens Capsule, LC- Lens cells, Scale bar- 35 μm. (For interpretation of the references to color in this figure legend, the reader is referred to the Web version of this article.)
3.3. Automated cell counting from tissue sections
Determination of the number of cells in a tissue slice can be important when assessing a growth phenotype or the extent of cell proliferation following tissue injury. The method described below using nuclear counts as a proxy for cell counts is quick, easy, accurate, and less labor-intensive than manual cell counting, especially when a tissue section contains a large number of cells [12,13] or tissue morphology is altered by the experimental manipulation. One caveat is that great care needs to be taken to ensure that sections are taken in similar planes and are representative of the tissue as artifacts can be incorporated if peripheral and central sections from a tissue sample are compared. Note-if the number of cells to be counted is low, automated cell counting may not be advantageous over doing manual counts even if the morphology of the tissue is different.
-
1.
Follow the steps described under approach 1 (3.2.1) of steps 1 and 2. This time, we will be using an image that is stained with a nuclear stain (we used the dye DRAQ5 to stain nuclear DNA in this example) (Fig. 5A and B).
-
2.
Click on the ‘Image’ option and then pick the ‘Adjust’ to select the ‘Threshold’. Next, adjust the threshold to make all the nuclear staining visible. We have kept the color as ‘B&W’ but other options like Red & Black may work better in other circumstances. (https://imagej.net/Particle_Analysis). Then, hit the ‘apply’ button on the ‘Threshold’ window box (Approach 2 (3.2.2), step 2) (Fig. 5C). Based on our experience, the upper scroll bar effectively adjusts the threshold value, however, it is not mandatory. Also, auto thresholding is possible using the ‘Otsu’ option, and it is particularly effective for this application (‘Otsu’ thresholding is explained under the section ‘Automated determination of mean fluorescence intensity of cells expressing a nuclear/non-nuclear protein of interest’‘-3.4).
-
3.
Next, click on the ‘Process’ followed by the ‘Binary’ and hit the ‘Make Binary’ button. This step is required for the further processing of the image.
-
4.
(Optional) Click on the ‘Process’ again followed by ‘Binary’ and then click on ‘Fill Holes’. This step corrects for uneven nuclear staining and will ensure the precise identification of all the nuclei by the software (Fig. 5D). However, if an object has holes, it will still be counted as a single object. Thus, this step is optional.
-
5.
(Optional) Click on ‘Process’ again followed by ‘Binary’ and then click on ‘Watershed’. This ‘Watershed’ option is optional. If cells on an image are distributed randomly and are not attached/aggregated, this ‘Watershed’ feature is not required. However, if nuclei overlap in certain areas due to tissue density or an image representing multiple planes (common if the image is a maximum intensity projection), this feature is helpful to separate nuclei from each other to allow counting. However, the image processing steps need to be consistent from image to image for unbiased analyses. For example, if the ‘watershed’ feature is used for one set of samples, this step needs to be performed for all the images to be compared (Fig. 5E).
-
6.
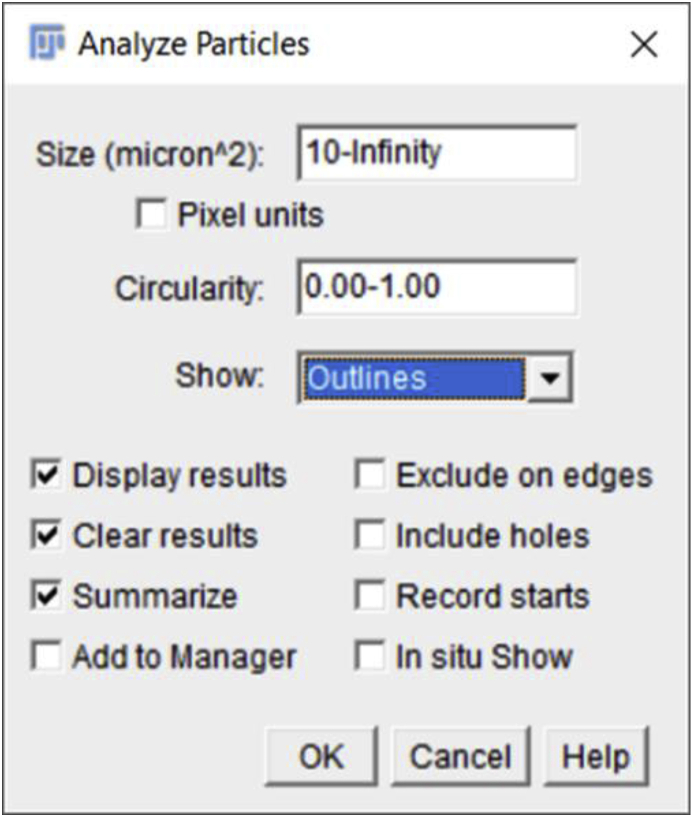
Click on ‘Analyze’ followed by the ‘Analyze Particles’. A window will pop up named ‘Analyze Particles’. This window gives several options including the ‘Size’ of the nucleus or particle, ‘Circularity’ of the particle, ‘Show’ etc. The choice of these options is based on the type of analysis desired. For example- ‘Circularity’ values between 0.0 and 1.0 can be selected to help exclude unwanted objects. It is recommended to pick the size of the particle to be above 0 to avoid noise. Details can be found at (https://imagej.net/Particle_Analysis). Note that it is important for these parameters to be kept the same for all the images being compared. Here, we have kept ‘Size’ of the particle – ‘10- Infinity’ (choice of particle size range depends on a user's objects of interest), ‘Circularity’- ‘0.00–1.00’, and ‘Show’ – ‘Outlines’. We have also checked the boxes such as ‘Display results’, ‘Clear results’, and ‘Summarize’ to reveal the automated cell counting results. After clicking the ‘OK’ button of the ‘Analyze Particles’ window, two windows will pop up with the summary of the analysis and particle counts.
-
7.
Particle counting can also be used to determine the ratio between the total number of nuclei compared to the number positive for a signal of interest. In the example given in Fig. 6, we counted both the number of Ki-67 positive nuclei (a nuclear protein whose expression is often used to identify cells actively transiting the cell cycle [14,15] which is expressed robustly at 3 days post cataract surgery in wildtype remnant lens tissue- Fig. 5, Fig. 6A) and total nuclei in the same tissue section (Fig. 6) to determine the percentage of cells present in a tissue section that are actively in the cell cycle.
Fig. 5.
Automated cell counting based on quantification of the number of nuclei in an image A. Original confocal image of a section taken through a WT lens capsule at 3 days post cataract surgery (three-color imaging; (Ki 67- Alexa Fluor 568- red), αSMA (FITC- green) & DNA (DRAQ5-blue)). B. The 633 channel showing only the DNA staining. C. Identification of ROIs stained for DNA using the ‘Threshold’ feature. D. The results from the use of the ‘Fill holes’ feature to correct for the detection of only a portion of some nuclei. E. The use of the ‘Watershed’ feature to separate “overlapping” nuclear signals to allow for automated counting. F. Automated cell counting is based on the number of nuclei identified by the prior image processes steps. C- Lens Capsule, LC- Lens cells, ROI- Region of interest, Scale bar- 35 μm. (For interpretation of the references to color in this figure legend, the reader is referred to the Web version of this article.)
Fig. 6.
Automated counting of the number of nuclei in a section positive for a signal of interest A. Original confocal image of a section through a WT lens capsule 3 days post cataract surgery (three-color imaging; (Ki 67- Alexa Fluor 568- red), αSMA (FITC- green) & DNA (DRAQ5-blue)). B. Red channel that shows the Ki 67 staining alone. C. Identification of the Ki 67 positive nuclei using the ‘Threshold’ function. D. The use of the ‘Fill holes’ feature to ensure that the “positive” nuclei are detected as a single particle. E. Application of the ‘Watershed’ feature to distinguish areas where the signals for two or more nuclei overlap in the image. F. The ROIs exhibiting Ki 67 staining identified by the prior image processing steps are counted by the software. C- Lens Capsule, LC- Lens cells, ROI- Region of interest, Scale bar- 35 μm. (For interpretation of the references to color in this figure legend, the reader is referred to the Web version of this article.)
3.4. Automated determination of mean fluorescence intensity of cells expressing a nuclear/non-nuclear protein of interest
This method provides a quick and easy way to determine the mean fluorescence intensity (MFI) of a transcription factor which can be advantageous when the manual selection of nuclei is laborious due to the presence of many cells [12,13]. This method is especially helpful if the positive nuclei in a ROI are expected to express similar amounts of the signal of interest (as would be expected for pSmad1/5/8 staining which detects a phosphorylated transcription factor whose levels are often a readout of Bone Morphogenetic Protein (BMP) pathway activation [16]) as comparisons of MFI between samples can serve as a proxy for the extent of transcription factor expression (or as in this case phosphorylation).
Note: This method is particularly useful when comparing images taken at different times which would prevent the standardization of a threshold across experimental conditions.
-
1.
As the use of a common threshold for all images is difficult, the ROI will be chosen by using the regions positive for a DNA stain, in this case, DRAQ5.
-
2.
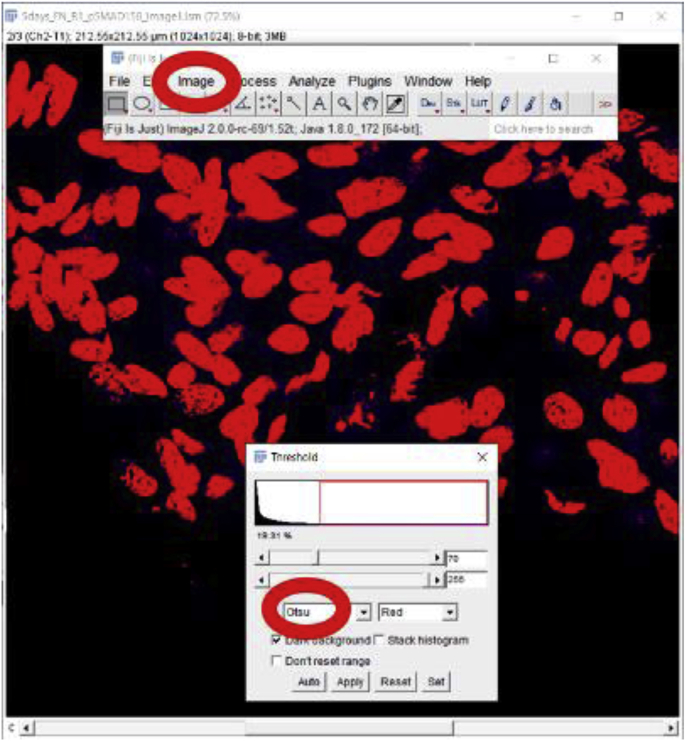
The threshold used to differentiate nuclei will be determined using Otsu (Image → Adjust → Threshold), an automatic method that identifies then excludes background signals. Otsu is used to perform automatic image thresholding. The algorithm returns a single intensity threshold that separates pixels into two classes, foreground, and background. The Otsu method could also be used in ‘Automated cell counting from tissue sections (3.3)’ to count the number of nuclei in a tissue section.
-
3.
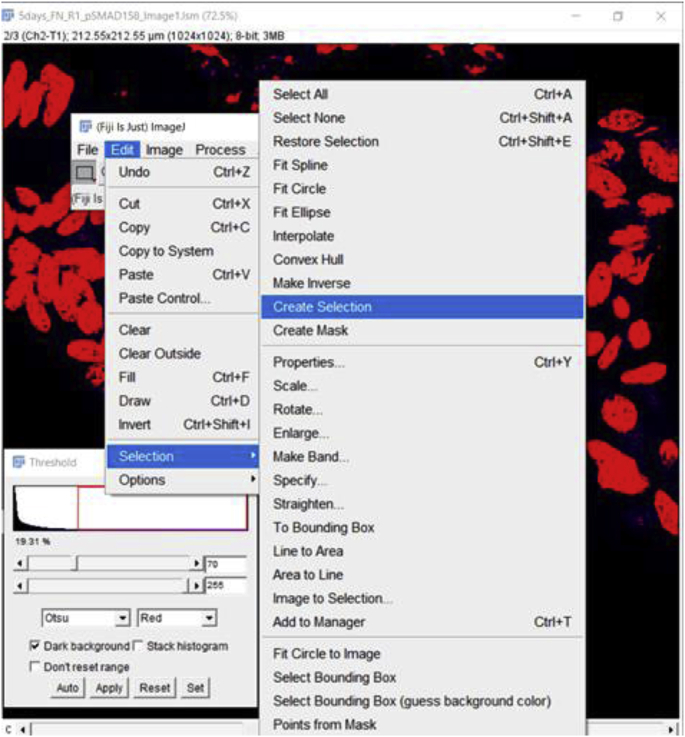
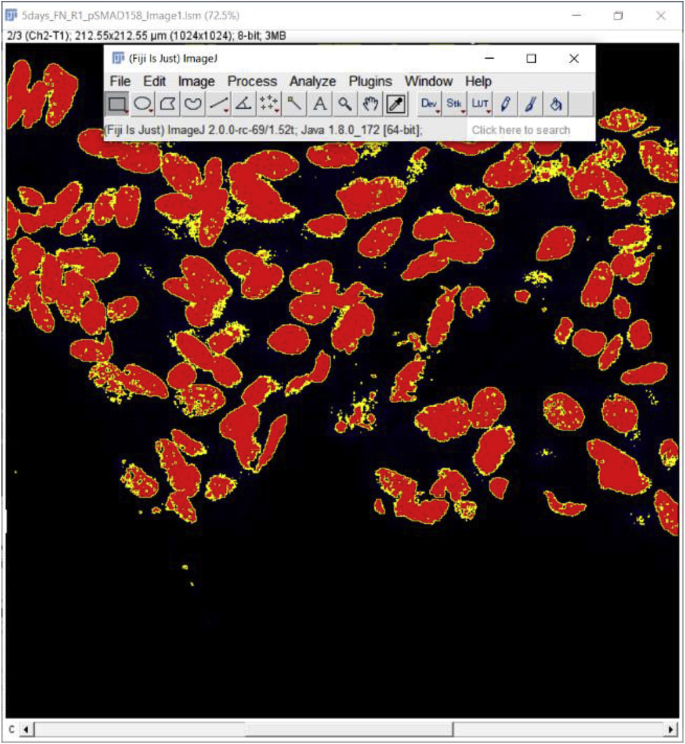
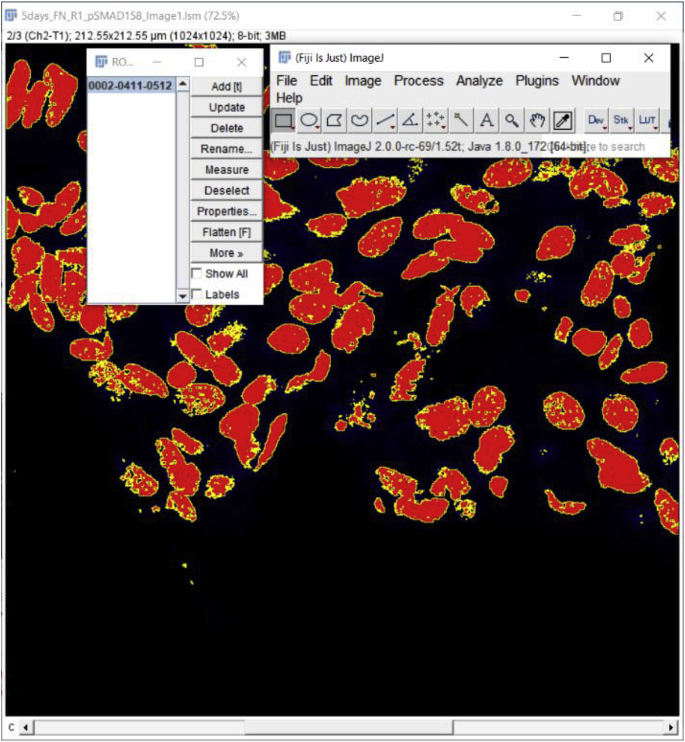
Using the DRAQ5 signal, create a Selection, which will outline the positive nuclei which are intended to be translated onto the image of interest. To create a Selection, go to Edit → Selection → Create Selection.
The Selection will look like the below:
-
4.
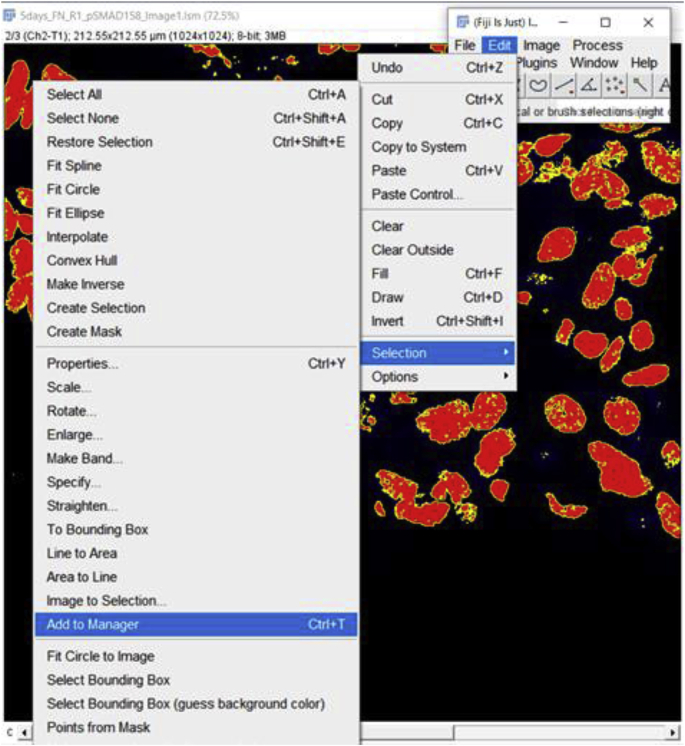
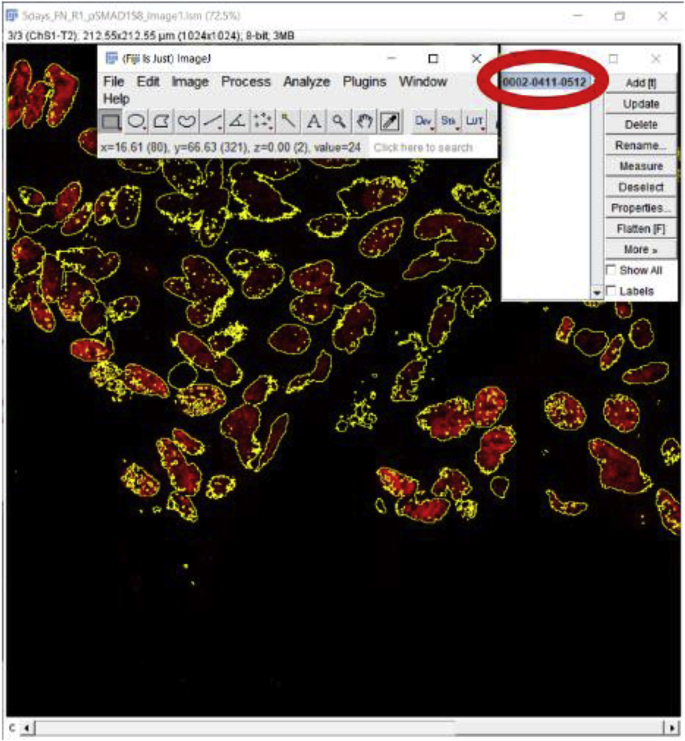
Add the “Create Selection” to the Manager so it can be used as a “mask” that can be applied to the image of interest. To add to Manager, go to Edit → Selection → Add to Manager.
If the Selection was successfully added to the Manager, then it will look like the following screen:
-
5.
Select the image of interest and add the Selection (image mask) to the image of interest via the Manager. To add the Selection, find and click on the ROI Manager Window and then click on the selection for it to apply to the image of interest.
-
6.
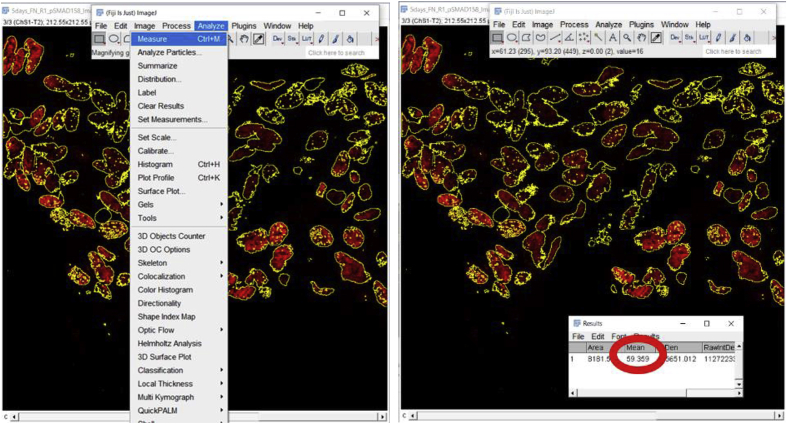
Calculate the MFI of the Selection using the method described above (3.2.2). First, ensure that “Limit to threshold” was selected under Analyze > Set Measurements. Then, go to Analyze → Measure. The MFI is the value under Mean on the Results Menu Screen, in this case, 59.359. Background signal then needs to be measured (explained above how to measure background signal) and subtracted from this value.
Note: This method can quickly allow for comparisons of nuclear signal intensities between samples when all or most nuclei selected are positive for the probe of interest, and can serve as a proxy for the number of nuclei positive for a marker if positive cells all exhibit similar levels of signal. However, if the researcher is interested in the percentage of cells positive for a marker (such as Ki-67 used to determine whether a cell is in the cell cycle), we recommend using the method described above under ‘Automated cell counting from tissue sections’. Also, the data obtained from this method should be interpreted with care if only a subset of cells in the region of interest are positive for the signal of interest as it will include many ROIs that lack any staining or positive cells. Therefore, the data obtained should be treated similarly to a Western Blot, where both positive cells and negative cells contribute to the lysate that is analyzed.
Further, this automated method can be used for the precise determination of MFI of a non-nuclear protein of interest. In our approach 1 (3.2.1) and 2 (3.2.2), we have shown two ways to measure the expression of E-cadherin, a non-nuclear protein expressed by wildtype lens cells at 0-h post cataract surgery. However, the mean area included the nuclei which do not harbor E-cadherin which lowers the measured MFI of E-cadherin. Thus, it can be desirable for the pixels representing these E-cadherin negative nuclei to be removed from the MFI measurement of E-cadherin using the nuclear counterstain as a marker, particularly if nuclear size changes due to the experimental manipulation of interest.
-
1.
Follow steps 1–5 described under the section ‘Automated determination of mean fluorescence intensity of cells expressing a nuclear/non-nuclear protein of interest’.
-
2.
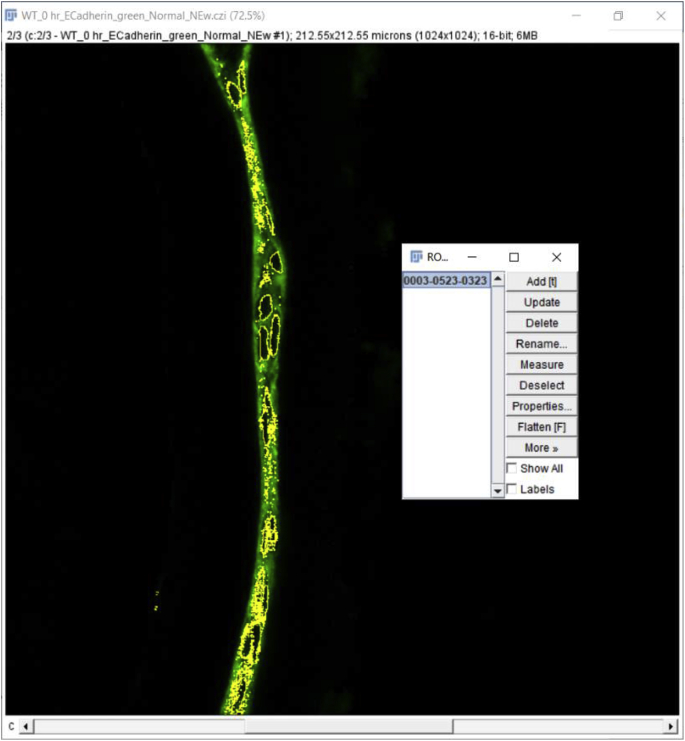
After performing step 5, it will look like the following screen.
-
3.
Go to Edit > Clear. Now all the green-positive signal in nuclei has been removed in the green channel image.
-
4.
Now this image is thresholded as described above to select non-nuclear regions. Image > Adjust > Threshold.
-
5.
Next, use the ‘Wand (tracing tool)’ option to outline the ROI selected based on the threshold.
-
6.
Finally, click on the ‘Reset’ button to get back to the original green image representing the E-cadherin expression. At this stage, this image is ready for quantitation (MFI of an ROI of protein expression – MFI of Background).
4. Method Validation and discussion
We study posterior capsular opacification (PCO), the major post cataract surgical complication [17] by using an in vivo mouse cataract surgical model. This in vivo model of cataract surgery has many strengths including the study of bona fide lens epithelial cells in a natural ocular environment, and the ability to genetically manipulate gene expression to study mechanisms of disease progression. However, the mouse lens is a 2–3 mm in diameter tissue, and after surgery, the cells of interest remaining behind represent 5000 or fewer cells which do not provide enough cells/tissue for many quantitative approaches to measure protein expression. However, this system easily provides sufficient material for quantitative RNA analysis approaches including quantitative RT-PCR and RNA-Seq [1,11,18]. Thus, in Shihan et al., 2020 [1], we were able to compare the mRNA level changes observed by RNA-Seq with the protein expression changes revealed by ImageJ quantitation of confocal immunofluorescence data, and found excellent concordance between the methods for many of the proteins/genes under study, with the added advantage that the confocal analysis allowed us to disentangle signals arising from the different cell types found in PCO material (lens fibers, lens epithelial cells, myofibroblasts, and immune cells) [1,11] which gave us a depth of understanding into PCO pathogenesis that bulk analysis of protein expression by western blotting could not provide.
Due to its linearity of detection, confocal microscopy is advantageous for quantitative studies in which the intensity of fluorophores are used as a proxy for protein quantification, which is extremely important in biological research [19]. As a result, image quantification provides the opportunity to reveal new biological insights from complex samples where the material is limiting. Here, we took the advantage of a free and commonly used image analysis software package, Fiji (Fiji is just ImageJ) [2] to both quantitate the expression of numerous proteins of interest and to perform automated cell counting on tissue derived from a mouse model of cataract surgery. We have successfully quantitated the relative expression of several different proteins across different time points following cataract surgery [1]. Overall, we found that the ImageJ quantitation of confocal data correlated well with the dynamics of mRNA expression changes seen in this model, (Table 1). We have further shown that Fiji can be used to reproducibly quantitate the number of nuclei in a tissue section in a manner that is less time consuming and more accurate than manual counting consistent with a previous report [12].
Table 1.
Examples of ImageJ quantitation method validation with other analytical approaches post cataract surgery (PCS).
| Gene ID and description | Transcriptome analysis (RNAseq) | Fiji quantitation | Additional analytical tools | Remarks and references |
|---|---|---|---|---|
| Acta2 actin, alpha 2, smooth muscle, aorta (αSMA) | 0 h vs 48 h FC- (4.4) FDR- 3.39E-08 |
0 h vs 3 d FC- (8.87) ***P < 0.001 0 h vs 5 d  FC- (6.35) *P = 0.013 |
Fluorescent activated cell sorting (FACS) 0 h vs 5 d  FC- (2.92) ***P < 0.001 |
Consistent and validated [1] |
| Cdh1 cadherin 1 (E− cadherin) | 0 h vs 48 h FC- (−2.12) FDR- 7.0E-05 |
0 h vs 48 h FC- (−1.68) *P = 0.019 |
Qualitative immunofluorescent image observation 0 h vs 5 d Downregulation 
|
Consistent and validated [1] |
| Col1a1 Collagen, type I, alpha 1 |
0 h vs 48 h FC- (83) FDR- 2.1E-42 |
0 h vs 48 h FC- (7.35) ***P < 0.001 |
Qualitative immunofluorescent image observation 0 h vs 48 h Robust expression/upregulation 
|
Consistent and validated [1] |
| Tnc tenascin C | 0 h vs 48 h FC- (116) FDR- 7.7E-44 |
0 h vs 48 h FC- 12.78 **P = 0.005 |
qRT-PCR 0 h vs 24 h ***P < 0.0001 |
Consistent and validated [1,18] |
h-hour, d-day, FC- fold change, FDR-false discovery rate, FACS- Fluorescence-activated cell sorting, P - probability value, qRT-PCR- Real-Time Quantitative Reverse Transcription PCR.
 -- Upregulation,
  -- Downregulation.
5. Conclusion
Overall, ImageJ quantitation of confocal images is an easy, fast, and reliable way to reproducibly quantitate hundreds of images derived from confocal immunofluorescent detection. This expands the data that can be extracted from the study of animal models of disease pathogenesis as it can work with limiting quantities of cells/tissue and in situations where the tissues are comprised of multiple cell types.
Grant information
This study was supported by the National Institutes of Health grants (EY015279 & EY028597) to MKD; INBRE program grant P20 GM103446 supports the University of Delaware Bioimaging Center, and 1S10 (RR027273-01) funded the acquisition of one of the confocal microscopes used in this study.
CRediT authorship contribution statement
Mahbubul H. Shihan: Conceptualization, Methodology, Writing - original draft, Writing - review & editing, Validation. Samuel G. Novo: Conceptualization, Methodology, Writing - original draft, Writing - review & editing, Validation. Sylvain J. Le Marchand: Methodology, Writing - review & editing. Yan Wang: Investigation. Melinda K. Duncan: Conceptualization, Supervision, Writing - review & editing, Project administration, Funding acquisition.
Declaration of competing interest
The authors declare that they have no competing financial interests or personal relationships that could have appeared to influence the work reported in this paper.
Acknowledgments
We thank Dr. Jeff Caplan, Associate Professor of the Department of Plant and Soil Sciences, and Director of Bioimaging Center, Delaware Biotechnology Institute, University of Delaware, Newark, Delaware, USA for his generous help, support, direction, and guidance regarding confocal microscope and ImageJ method development and training.
References
- 1.Shihan M.H., Kanwar M., Wang Y., Jackson E.E., Faranda A.P., Duncan M.K. Fibronectin has multifunctional roles in posterior capsular opacification (PCO) Matrix Biol. August 2020;90:79–108. doi: 10.1016/j.matbio.2020.02.004. [DOI] [PMC free article] [PubMed] [Google Scholar]
- 2.Schindelin J., Arganda-Carreras I., Frise E., Kaynig V., Longair M., Pietzsch T., Preibisch S., Rueden C., Saalfeld S., Schmid B., Tinevez J.-Y., White D.J., Hartenstein V., Eliceiri K., Tomancak P., Cardona A. Fiji: an open-source platform for biological-image analysis. Nat. Methods. 2012;9:676–682. doi: 10.1038/nmeth.2019. [DOI] [PMC free article] [PubMed] [Google Scholar]
- 3.Call M.K., Grogg M.W., Del Rio-Tsonis K., Tsonis P.A. Lens regeneration in mice: implications in cataracts. Exp. Eye Res. 2004;78:297–299. doi: 10.1016/j.exer.2003.10.021. [DOI] [PubMed] [Google Scholar]
- 4.Reed N.A., Oh D.J., Czymmek K.J., Duncan M.K. An immunohistochemical method for the detection of proteins in the vertebrate lens. J. Immunol. Methods. 2001;253:243–252. doi: 10.1016/s0022-1759(01)00374-x. [DOI] [PubMed] [Google Scholar]
- 5.Toomre Derek K., Langhorst Matthias F., Davidson Michael W. Digital Imaging Considerations. http://zeiss-campus.magnet.fsu.edu/print/spinningdisk/introduction-print.html
- 6.Firtina Z., Danysh B.P., Bai X., Gould D.B., Kobayashi T., Duncan M.K. Abnormal expression of collagen IV in lens activates unfolded protein response resulting in cataract. J. Biol. Chem. 2009;284:35872–35884. doi: 10.1074/jbc.M109.060384. [DOI] [PMC free article] [PubMed] [Google Scholar]
- 7.Scheiblin D.A., Gao J., Caplan J.L., Simirskii V.N., Czymmek K.J., Mathias R.T., Duncan M.K. Beta-1 integrin is important for the structural maintenance and homeostasis of differentiating fiber cells. Int. J. Biochem. Cell Biol. 2014;50:132–145. doi: 10.1016/j.biocel.2014.02.021. [DOI] [PMC free article] [PubMed] [Google Scholar]
- 8.Wang Y., Mahesh P., Wang Y., Novo S.G., Shihan M.H., Hayward-Piatkovskyi B., Duncan M.K. Spatiotemporal dynamics of canonical Wnt signaling during embryonic eye development and posterior capsular opacification (PCO) Exp. Eye Res. 2018;175:148–158. doi: 10.1016/j.exer.2018.06.020. [DOI] [PMC free article] [PubMed] [Google Scholar]
- 9.McCloy R.A., Rogers S., Caldon C.E., Lorca T., Castro A., Burgess A. Partial inhibition of Cdk1 in G 2 phase overrides the SAC and decouples mitotic events. Cell Cycle. 2014;13:1400–1412. doi: 10.4161/cc.28401. [DOI] [PMC free article] [PubMed] [Google Scholar]
- 10.Verrecchia F., Mauviel A. Transforming growth factor-β and fibrosis. World J. Gastroenterol. 2007;13:3056–3062. doi: 10.3748/wjg.v13.i22.3056. [DOI] [PMC free article] [PubMed] [Google Scholar]
- 11.Jiang J., Shihan M.H., Wang Y., Duncan M.K. Lens epithelial cells initiate an inflammatory response following cataract surgery. Invest. Ophthalmol. Vis. Sci. 2018;59:4986–4997. doi: 10.1167/iovs.18-25067. [DOI] [PMC free article] [PubMed] [Google Scholar]
- 12.Grishagin I.V. Automatic cell counting with ImageJ. Anal. Biochem. 2015;473:63–65. doi: 10.1016/j.ab.2014.12.007. [DOI] [PubMed] [Google Scholar]
- 13.O'Brien J., Hayder H., Peng C. Automated quantification and analysis of cell counting procedures using ImageJ plugins. JoVE. 2016:54719. doi: 10.3791/54719. [DOI] [PMC free article] [PubMed] [Google Scholar]
- 14.Scholzen T., Gerdes J. The Ki-67 protein: from the known and the unknown. J. Cell. Physiol. 2000;182:311–322. doi: 10.1002/(SICI)1097-4652(200003)182:3%3c311::AID-JCP1%3e3.0.CO;2-9. [DOI] [PubMed] [Google Scholar]
- 15.Sun X., Kaufman P.D. Ki-67: more than a proliferation marker. Chromosoma. 2018;127:175–186. doi: 10.1007/s00412-018-0659-8. [DOI] [PMC free article] [PubMed] [Google Scholar]
- 16.Ueki Y., Reh T.A. Activation of BMP-smad1/5/8 signaling promotes survival of retinal ganglion cells after damage in vivo. PloS One. 2012;7 doi: 10.1371/journal.pone.0038690. [DOI] [PMC free article] [PubMed] [Google Scholar]
- 17.Shihan M.H., Novo S.G., Duncan M.K. Cataract surgeon viewpoints on the need for novel preventative anti-inflammatory and anti-posterior capsular opacification therapies. Curr. Med. Res. Opin. 2019;35:1971–1981. doi: 10.1080/03007995.2019.1647012. [DOI] [PMC free article] [PubMed] [Google Scholar]
- 18.Mamuya F.A., Wang Y., Roop V.H., Scheiblin D.A., Zajac J.C., Duncan M.K. The roles of alphaV integrins in lens EMT and posterior capsular opacification. J. Cell Mol. Med. 2014;18:656–670. doi: 10.1111/jcmm.12213. [DOI] [PMC free article] [PubMed] [Google Scholar]
- 19.Vogel B., Siebert H., Hofmann U., Frantz S. Determination of collagen content within picrosirius red stained paraffin-embedded tissue sections using fluorescence microscopy. Methods. 2015;2:124–134. doi: 10.1016/j.mex.2015.02.007. [DOI] [PMC free article] [PubMed] [Google Scholar]


