

Abstract
This study describes trends in use of in-person, telephone, and video primary care and behavioral health visits to California Federally Qualified Health Centers from 2019 to August 2020 before and during the coronavirus disease 2019 (COVID-19) pandemic.
Federally Qualified Health Centers (FQHCs) are outpatient health centers that provide comprehensive primary care to 30 million low-income individuals.1 When the coronavirus disease 2019 (COVID-19) pandemic began in March 2020, the Centers for Medicare & Medicaid Services (CMS) granted flexibilities to FQHCs to furnish video and telephone (audio only) visits to patients at any location. Pandemic-related regulatory waivers led to a substantial increase in telehealth across the health care system.2
Little is known about visit trends during the COVID-19 pandemic among patients of FQHCs. We described trends in the use of in-person, telephone, and video visits among California FQHCs before and during the COVID-19 pandemic.
Methods
In July 2020, the California Health Care Foundation (CHCF) provided funding to expand telehealth capacity for 43 health centers (including 20% of California’s FQHCs) and provide data for evaluation through a reporting tool aligned with the Health Resources and Services Administration Uniform Data System (UDS).3 The FQHCs submitted aggregated data on billable outpatient primary care and behavioral health visits, reporting in-person, telephone, and video visits for each month by patient demographics from February 2019 to August 2020.
Using UDS data on characteristics of FQHCs,3 we analyzed descriptive statistics comparing FQHCs participating in the CHCF initiative and FQHCs not participating. We calculated the number of primary care and behavioral health visits (by visit type) per 1000 patients served in 2019. We estimated fixed-effects linear regressions examining changes in the log-transformed number of primary care and behavioral health visits during the March-August 2020 pandemic period relative to February 2019–February 2020, controlling for time-invariant differences of FQHCs and monthly seasonality. Statistical significance was defined as a 2-sided P < .05. The analyses were conducted using Stata version 16.1 (StataCorp). The RAND Corporation institutional review board declared the study exempt.
Results
Forty-one FQHCs with 534 physical locations provided data. The FQHCs participating in the CHCF initiative served 1.7 million patients in 2019 and were similar to FQHCs in California that were not included in the sample; however, the smallest FQHCs (serving ≤9999 patients in 2019) were underrepresented (Table).
Table. Characteristics of Federally Qualified Health Centers in California by Participation in the California Health Care Foundation Initiative.
| Characteristics | Federally Qualified Health Centers by participation in the California Health Care Foundation initiativea | |
|---|---|---|
| Participating (n = 35) | Not participating (n = 147) | |
| Region in California, No. (%) | ||
| Northern | 9 (25.7) | 49 (33.3) |
| Central | 8 (22.9) | 21 (14.3) |
| Southern | 18 (51.4) | 77 (52.4) |
| No. of unique patients, No. (%) | ||
| ≤9999 | 5 (14.3) | 54 (36.7) |
| 10 000-49 999 | 21 (60.0) | 73 (49.7) |
| 50 000-99 999 | 7 (20.0) | 12 (8.2) |
| ≥100 000 | 2 (5.7) | 8 (5.4) |
| Patient demographics, mean (SD), % | ||
| Aged >65 y | 8.4 (5.3) | 10.4 (6.9) |
| Racial/ethnic minorityb | 78.5 (21.6) | 73.9 (23.6) |
| Best served in another language (not English) | 36.3 (21.9) | 32.7 (21.3) |
| At or below 100% of poverty line | 71.6 (13.5) | 69.4 (16.6) |
Data are from the Health Resources and Service Administration Uniform Data System.
Defined as individuals who self-identified as Black, Asian, American Indian, Alaska Native, Native Hawaiian, Pacific Islander, other non-White race, more than 1 race, or Hispanic/Latino. The Health Resources and Service Administration Uniform Data System reports these data because patient health care access and use can be influenced by race/ethnicity.
During the prepandemic period, there was a mean of 231.7 primary care visits per 1000 patients per month compared with 228.6 visits per 1000 patients per month during the COVID-19 pandemic period. Adjusted models showed a 6.5% decrease (95% CI, −104% to −2.3%; P = .03) in total visit volume for primary care, with the decline concentrated in March and April 2020. There was no significant change in total behavioral health visits (Figure).
Figure. Primary Care and Behavioral Health Visits per 1000 Patients by Visit Type From February 2019 Through August 2020.
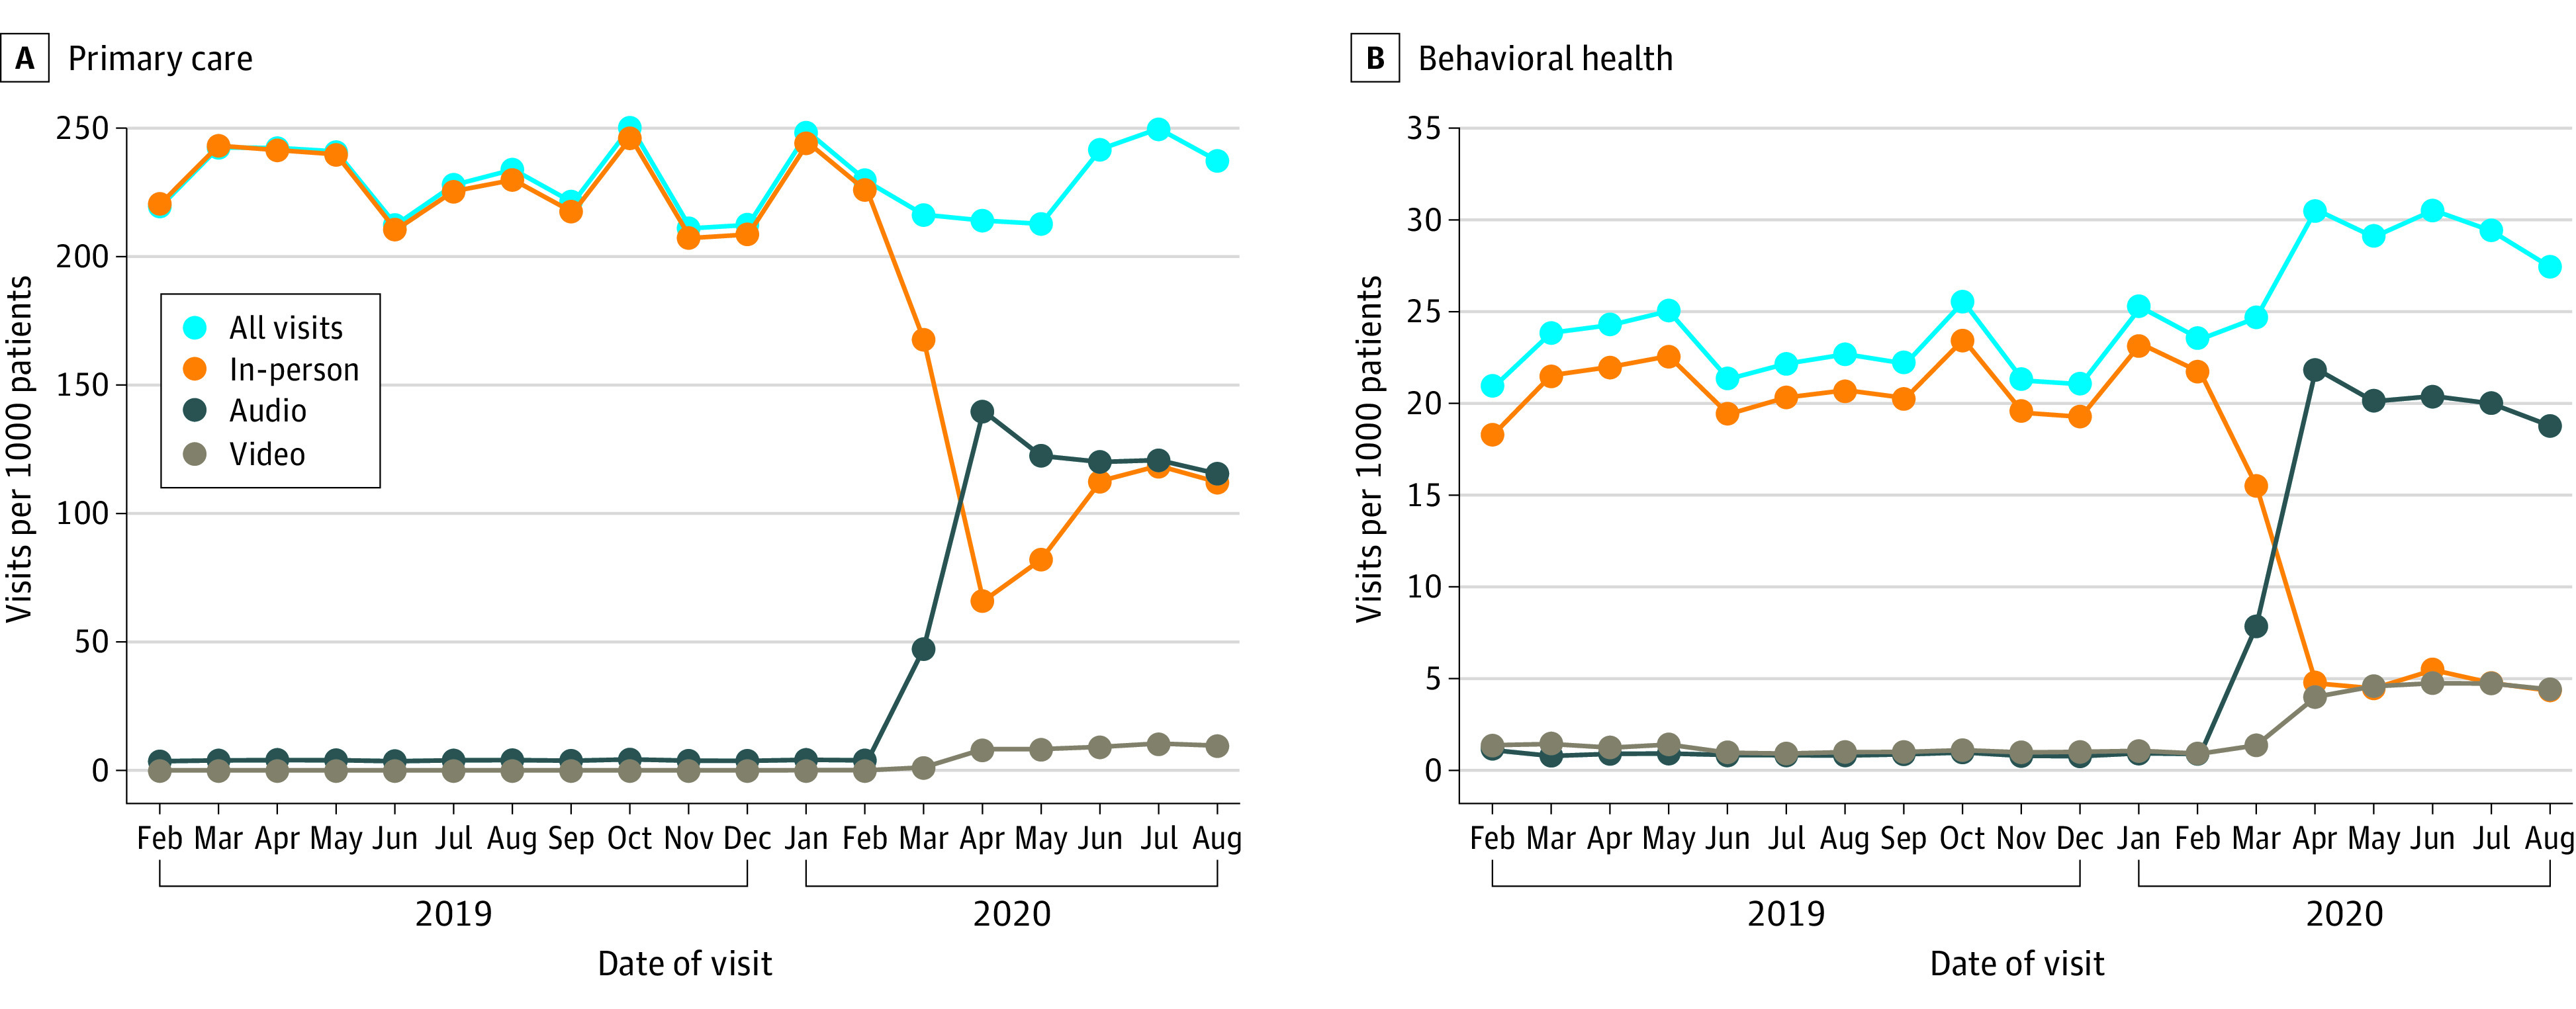
The rate of visits per 1000 patients was calculated by summing all visits each month across health centers and dividing by 1 731 326, which is the sum of all unique patients seen across all health centers in 2019. Primary care visits were defined as visits delivered by primary care clinicians including physicians (internal medicine, pediatrics, and family practice), nurse practitioners, and physician assistants. Behavioral health visits were defined as visits delivered by specialty behavioral health clinicians credentialed by the health center. For 2 participating health centers, in-person visit volume was imputed for February through April 2019; these data were missing due to changes in electronic health records.
Prior to the COVID-19 pandemic, there was minimal telehealth use. During March 2020, FQHCs rapidly substituted in-person visits with telephone and video visits. During the pandemic period, there were 109.9 in-person, 111.0 telephone, and 7.8 video visits per 1000 patients per month for primary care, with 48.1% occurring in person, 48.5% via telephone, and 3.4% via video. For behavioral health, there were 6.6 in-person, 18.2 telephone, and 4.0 video visits per 1000 patients per month, with 22.8% occurring in person, 63.3% via telephone, and 13.9% via video. Telephone visits peaked in April 2020, comprising 65.4% of primary care visits and 71.6% of behavioral health visits.
Discussion
During the COVID-19 pandemic, visit volume at a sample of FQHCs declined modestly for primary care visits and remained stable for behavioral health visits because telehealth visits (particularly by telephone) replaced in-person visits. Few studies have differentiated between telehealth modalities. However, CMS estimated that 30% of telehealth visits were audio only during the pandemic.2 Estimates reported here may be higher because low-income patients face unique barriers to accessing video visits and FQHCs lack resources to develop the necessary infrastructure. Study limitations include that only FQHCs in 1 state were tracked. Also, 5 FQHCs reported early challenges distinguishing visit types and categorized all telehealth visits by the dominant modality.
Prior to the pandemic, many definitions of telehealth excluded telephone visits, and telephone visits were seldom reimbursed.4,5 Furthermore, CMS signaled it may stop reimbursing for telephone visits when the public health emergency ends.6 There are some concerns that telephone visits could result in fraud, abuse, and unnecessary and lower-quality care. Although these concerns are important to assess, eliminating coverage for telephone visits could disproportionately affect underserved populations and threaten the ability of FQHCs to meet patient needs.
Section Editor: Jody W. Zylke, MD, Deputy Editor.
References
- 1.Health Resources and Services Administration . 2019 national health center data. Accessed December 2, 2020. https://data.hrsa.gov/tools/data-reporting/program-data/national
- 2.Verma S. Early impact of CMS expansion of Medicare telehealth during COVID-19. Health Affairs Blog. Accessed December 2, 2020. https://www.healthaffairs.org/do/10.1377/hblog20200715.454789/full/
- 3.Health Resources and Services Administration . Uniform Data System resources. Accessed November 2, 2020. https://bphc.hrsa.gov/datareporting/reporting/index.html
- 4.California Department of Health Care Services . Telehealth definitions. Accessed November 2, 2020. https://www.dhcs.ca.gov/provgovpart/Pages/telehealthdefinitions.aspx
- 5.Centers for Medicare & Medicaid Services . Telemedicine. Accessed November 2, 2020. https://www.medicaid.gov/medicaid/benefits/telemedicine/index.html
- 6.Centers for Medicare & Medicaid Services . Proposed policy, payment, and quality provisions changes to the Medicare physician fee schedule for calendar year 2021. Accessed December 2, 2020. https://www.cms.gov/newsroom/fact-sheets/proposed-policy-payment-and-quality-provisions-changes-medicare-physician-fee-schedule-calendar-year-4