

Abstract
Hot water scalds can be quite debilitating for a prolonged period of time. It has been previously determined that the severity of hot water scalds increases in a logarithmic trend with water temperature, which has led to legislations requiring changes to the physical environment to reduce the temperature of hot water. In September 2004, Ontario changed its Building Code, requiring all new or renovated residential buildings to lower the maximum setting of their hot water heaters to 49°C (120°F). The aim of the present study was to evaluate the effectiveness of the legislation at reducing both the overall incidence and hospitalizations caused by hot tap water scalds. Hot tap water scald cases were identified from the National Ambulatory Care Reporting System and Discharge Abstract Database databases provided by Canadian Institute for Health Information for April 2002 to March 2010. Annual incidences, hospitalizations, and outcomes were recorded. There were a total of 6952 hot tap water scald cases in Ontario, including 408 hospitalizations in the 8-year period. The average annual incidence rate for hot tap water scalds for the study period was 6.93 cases per 100,000 population and the average hospitalization rate was 0.4 cases per 100,000 population. The high-risk population group of children and elderly comprised the majority of hospitalization cases (60%); however, adults are responsible for the majority of the ambulatory cases (67%). There was a significant decrease in the age-standardized monthly ambulatory scald cases per 100,000 population after the intervention of 0.01055 (95% confidence interval [CI] [0.004, 0.017]; P = .0018) with a rate of change of 0.9455 (95% CI [0.90, 0.98]; P < .0001) and a long-term decrease of 0.19 per 100,000. There was no significant difference in length of stay of hospitalized cases after the intervention (rate ratio = 0.91; 95% CI (0.70, 1.18); P = .4624). Overall, the regulation of limiting the maximum hot water temperature in residential homes has had a positive impact on reducing the overall number of hot tap water scalds; however, they still cause a considerable amount of morbidity because the number of hospitalized cases did not change significantly. In addition to implementing regulations, active prevention and educational campaigns are still necessary to eliminate this preventable injury.
Burns are among the most distressing injuries as they can affect a person’s physical and mental well-being.1 In Canada, between 1994 and 2003 there were over 10,000 burn injuries in the pediatric population, with scalds from liquids and vapors accounting for half.2 Another study identified 7 to 17% of all scald injuries in children to be specifically caused by hot water.3 Studies have focused on the pediatric population; however, the elderly and the disabled population have also been shown to be at risk for hot water scalds.2–5 It has been suggested that these groups are more vulnerable because of factors such as thinner and more sensitive skin, slower reaction time, and impaired mobility.6
Hot tap water scalds cause a higher mortality rate and involves a larger BSA compared with other methods of scald injuries.3,7 The severity of hot water scalds increase in a logarithmic trend with water temperature; third-degree burns occur in 5 to 10 minutes at 49°C (120°F), 10 to 30 seconds at 55°C (131°F), and 2 to 5 seconds at 60°C (140°F).8 Of greater significance is, that hot tap water scalds are a preventable injury. There have been multiple efforts aimed at reducing the occurrence of hot water scalds. Interventions toward this aim include education aimed at children and their parents9 and the elderly,10 usage of antiscald devices,11 as well as regulation to reduce maximum hot water temperatures in residential buildings.6,7 Several countries, such as the United States, Sweden, New Zealand, and Australia have already established these legislations to decrease the incidence of hot water scalds.6,7,10,12
In September 2004, Ontario was the first province in Canada to implement a regulation that limits to 49°C (120°F), the maximum hot water temperature supplied to fixtures in residential occupancies. To comply with the regulation, all new residential buildings must have antiscalding mixing valves installed at either the outlet of the water heater or at each hot water faucet in a home, or install a water heater with an integral antiscald device. Existing buildings must follow this regulation once a water heater is replaced or the existing plumbing system is extended or altered.13
This study investigates the effect the legislation has had on the incidence and hospitalization rates of hot water scald injuries among the population of Ontario between April 2002 and March 2010. A comparison of the pre- and postintervention years has been performed, looking at the characteristics and demographics of the hot water scald cases.
METHODS
Hot water scald cases were identified for the 8-year period between fiscal years 2002 to 2003 and 2009 to 2010 from the National Ambulatory Care Reporting System and the Discharge Abstract Database collected by the Canadian Institute for Health Information (CIHI). Scald cases caused by hot tap water were identified by the International Classification of Diseases 10th revision diagnosis code “X11.” The National Ambulatory Care Reporting System database contains information from all hospital-based and community-based ambulatory care centers in Ontario.14 The Discharge Abstract Database contains information of patients who have been admitted to the hospital for acute burns, thereby identifying more severe injuries.
The severity of scalds was inferred from the triage level assigned to a case and the length of stay of hospitalized patients. Triage levels are used in the ambulatory setting to distinguish whether a patient is in emergent need of care ranging down to nonurgent. This is represented on a scale of 1 to 5, 1 being most urgent. The length of stay in hospital identifies patients who required more medical attention as a result of the initial insult.
Statistical Analysis
Age-standardized rates were calculated using 2001 Ontario census data. Time-series models for monthly ambulatory age-standardized rates and hospitalized age-standardized rates were developed to examine the effect of intervention introduced in September 2004. We identified, estimated, and diagnosed time-series autoregressive integrated moving average (ARIMA) models, using the observations before intervention. Because of the nature of the intervention where a gradual permanent impact is expected, we used a transfer function with two parameters, one corresponding to an indicator variable (0 for the months before intervention and 1 for after intervention) to assess the change at the time of intervention and a lagged value of the time series for the intervention component to estimate the rate of change after the intervention.15 The data were expressed as age-standardized rates per 100,000 population per month. The 30 months preintervention phase was used to identify an ARIMA (0,0,(4)) for the ambulatory rates and an ARIMA(0,0,1) for the hospitalization rates. The residuals obtained from the model were checked for autocorrelation using Q-statistics and inspected for normality. Age and sex differences in ambulatory and hospitalization rates, were tested using a negative binomial regression model with age group, sex and year, and age group and year interaction. Age groups were divided into five developmentally appropriate age ranges: infant (<2 years of age), children (2–8 years), youth (9–16 years), adult (17–64 years), and elderly (65+ years). Because the intervention had an impact on the ambulatory rates, we used only the postintervention data for this outcome. Triage level was categorized as urgent (1, 2, or 3 categories) versus nonurgent (4 or 5). The impact of intervention on hospital length of stay and triage level collapsed were analyzed using generalized estimating equations models with negative binomial and binary distribution respectively to take into account the clustering of the patients within a region. The analysis was done using SAS version 9.2 (SAS Institute Inc., Cary, NC). P values less than .05 were considered statistically significant.
RESULTS
There were a total of 6952 hot tap water scald cases in Ontario, including 408 hospitalizations in the 8-year period from April 2002 to March 2010. The average annual incidence rate for hot tap water scalds for the study period was 6.93 cases per 100,000 population and the average hospitalization rate was 0.4 cases per 100,000 population. Age-standardized incidence rates and hospitalization rates for hot tap water scalds for the period of study are shown in Figures 1 and 2, respectively. The intervention caused a decrease in the ambulatory rates of 0.01055 per 100,000(95% CI [0.004, 0.017]; P = .0018) with a rate of decline of 0.945 (95% CI [0.90, 0.98]; P < .0001) that will result in a decrease of 0.01055/ (1 − 0.945) = 0.19 in the long run. Nonetheless, the rate of decline is very slow and therefore this change will occur in 5 years or more, based on the present model. The change between month nth postintervention to month n+1th is (0.945)n × 0.01055. There is no significant decrease in the hospitalization rates after intervention −0.00104 (95% CI [−0.0007, 0.003]; P = .24). The multiple regression analysis for both ambulatory and hospitalized hot water scald cases are shown in Table 1. The interactions were not significant and therefore removed from the model.
Figure 1.
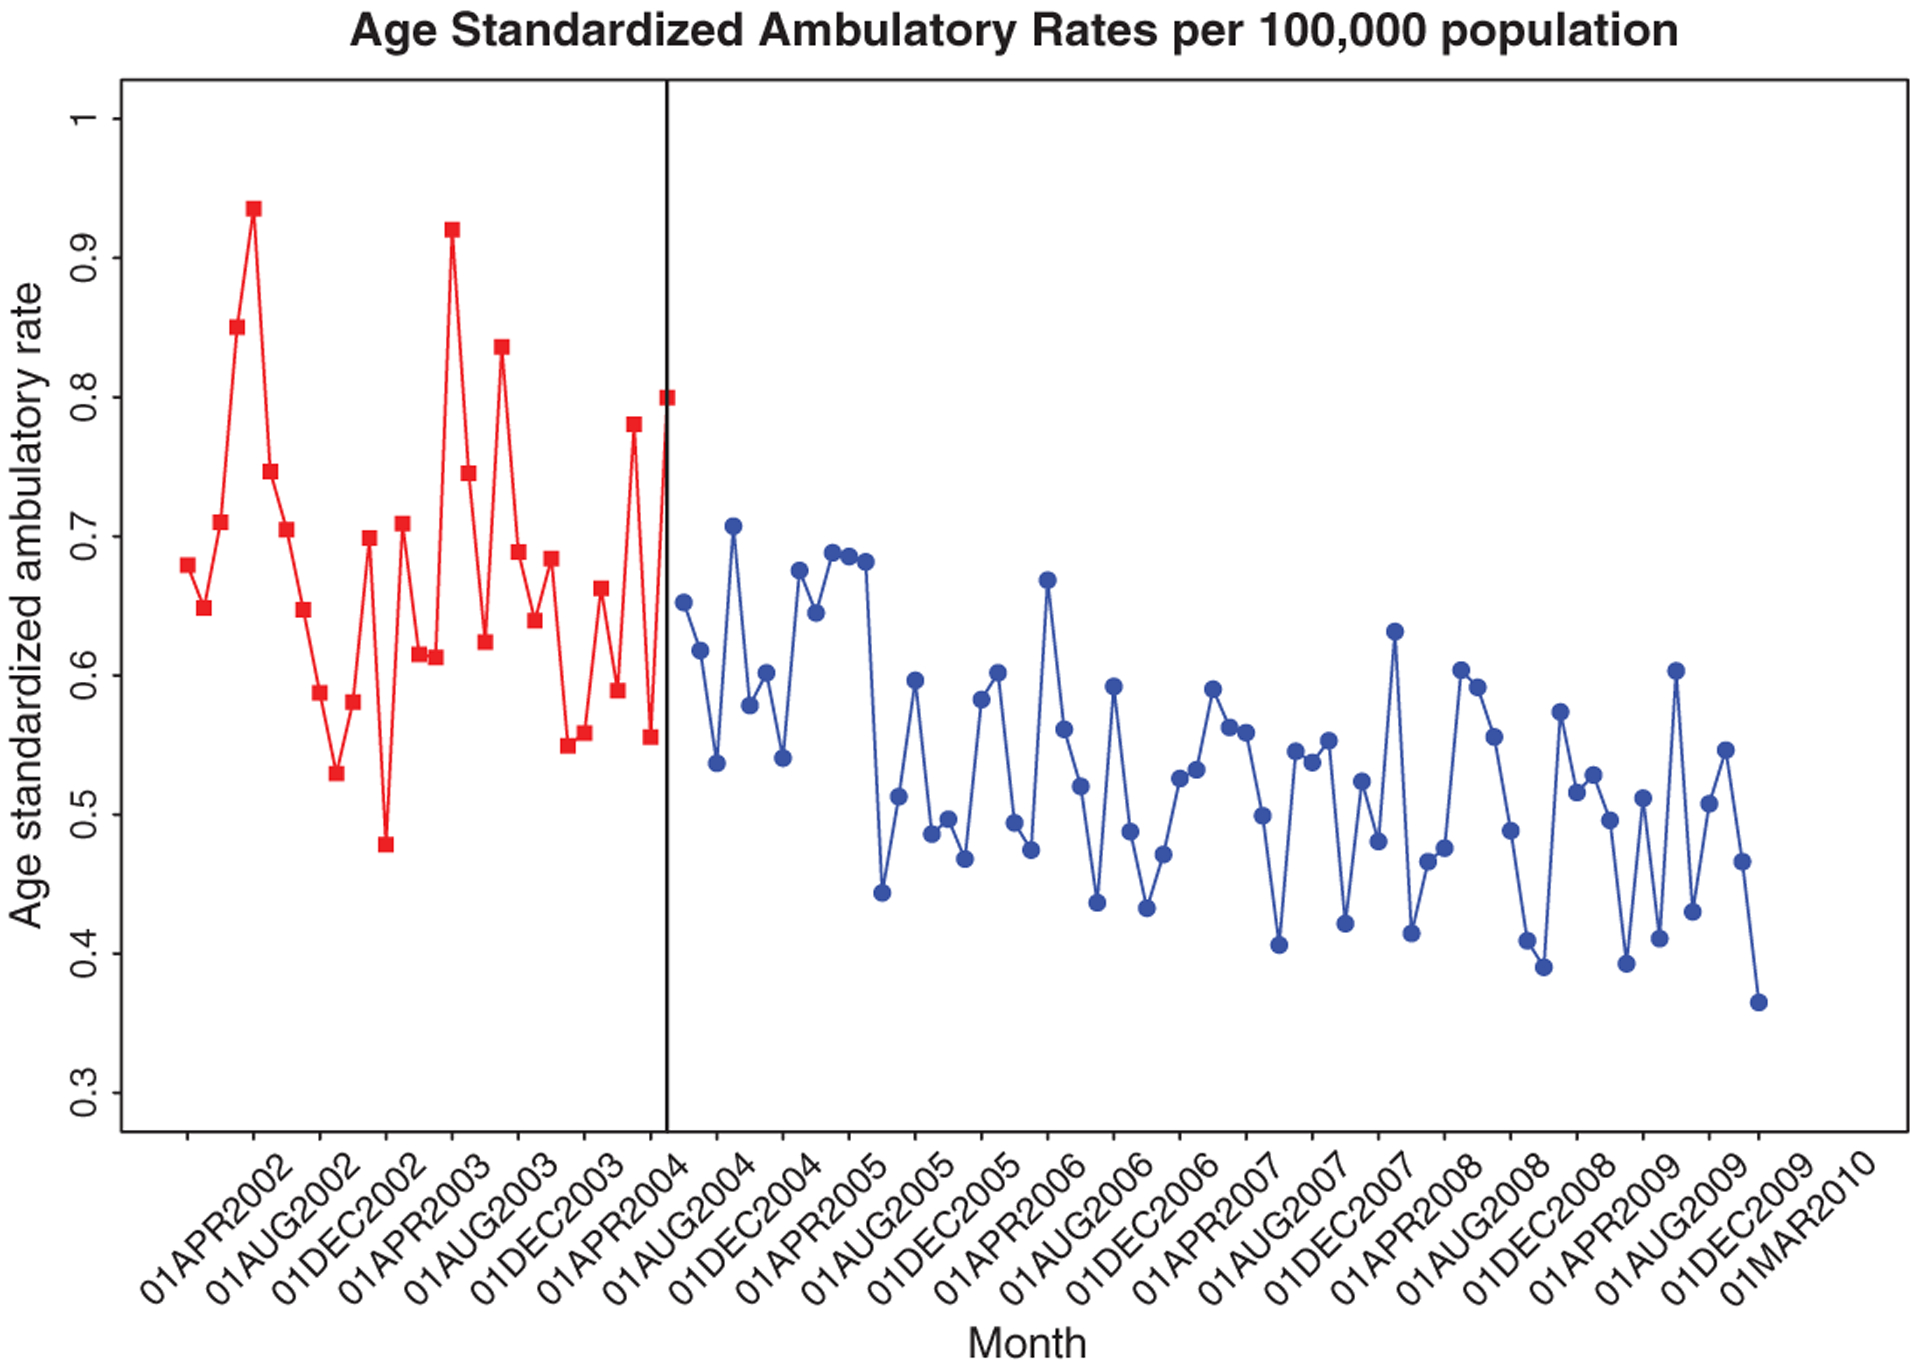
Age-standardized incidence rate for hot tap water scalds, Ontario, Canada, fiscal year 2002–2003 to 2009–2010. Intervention date: September 2004.
Figure 2.
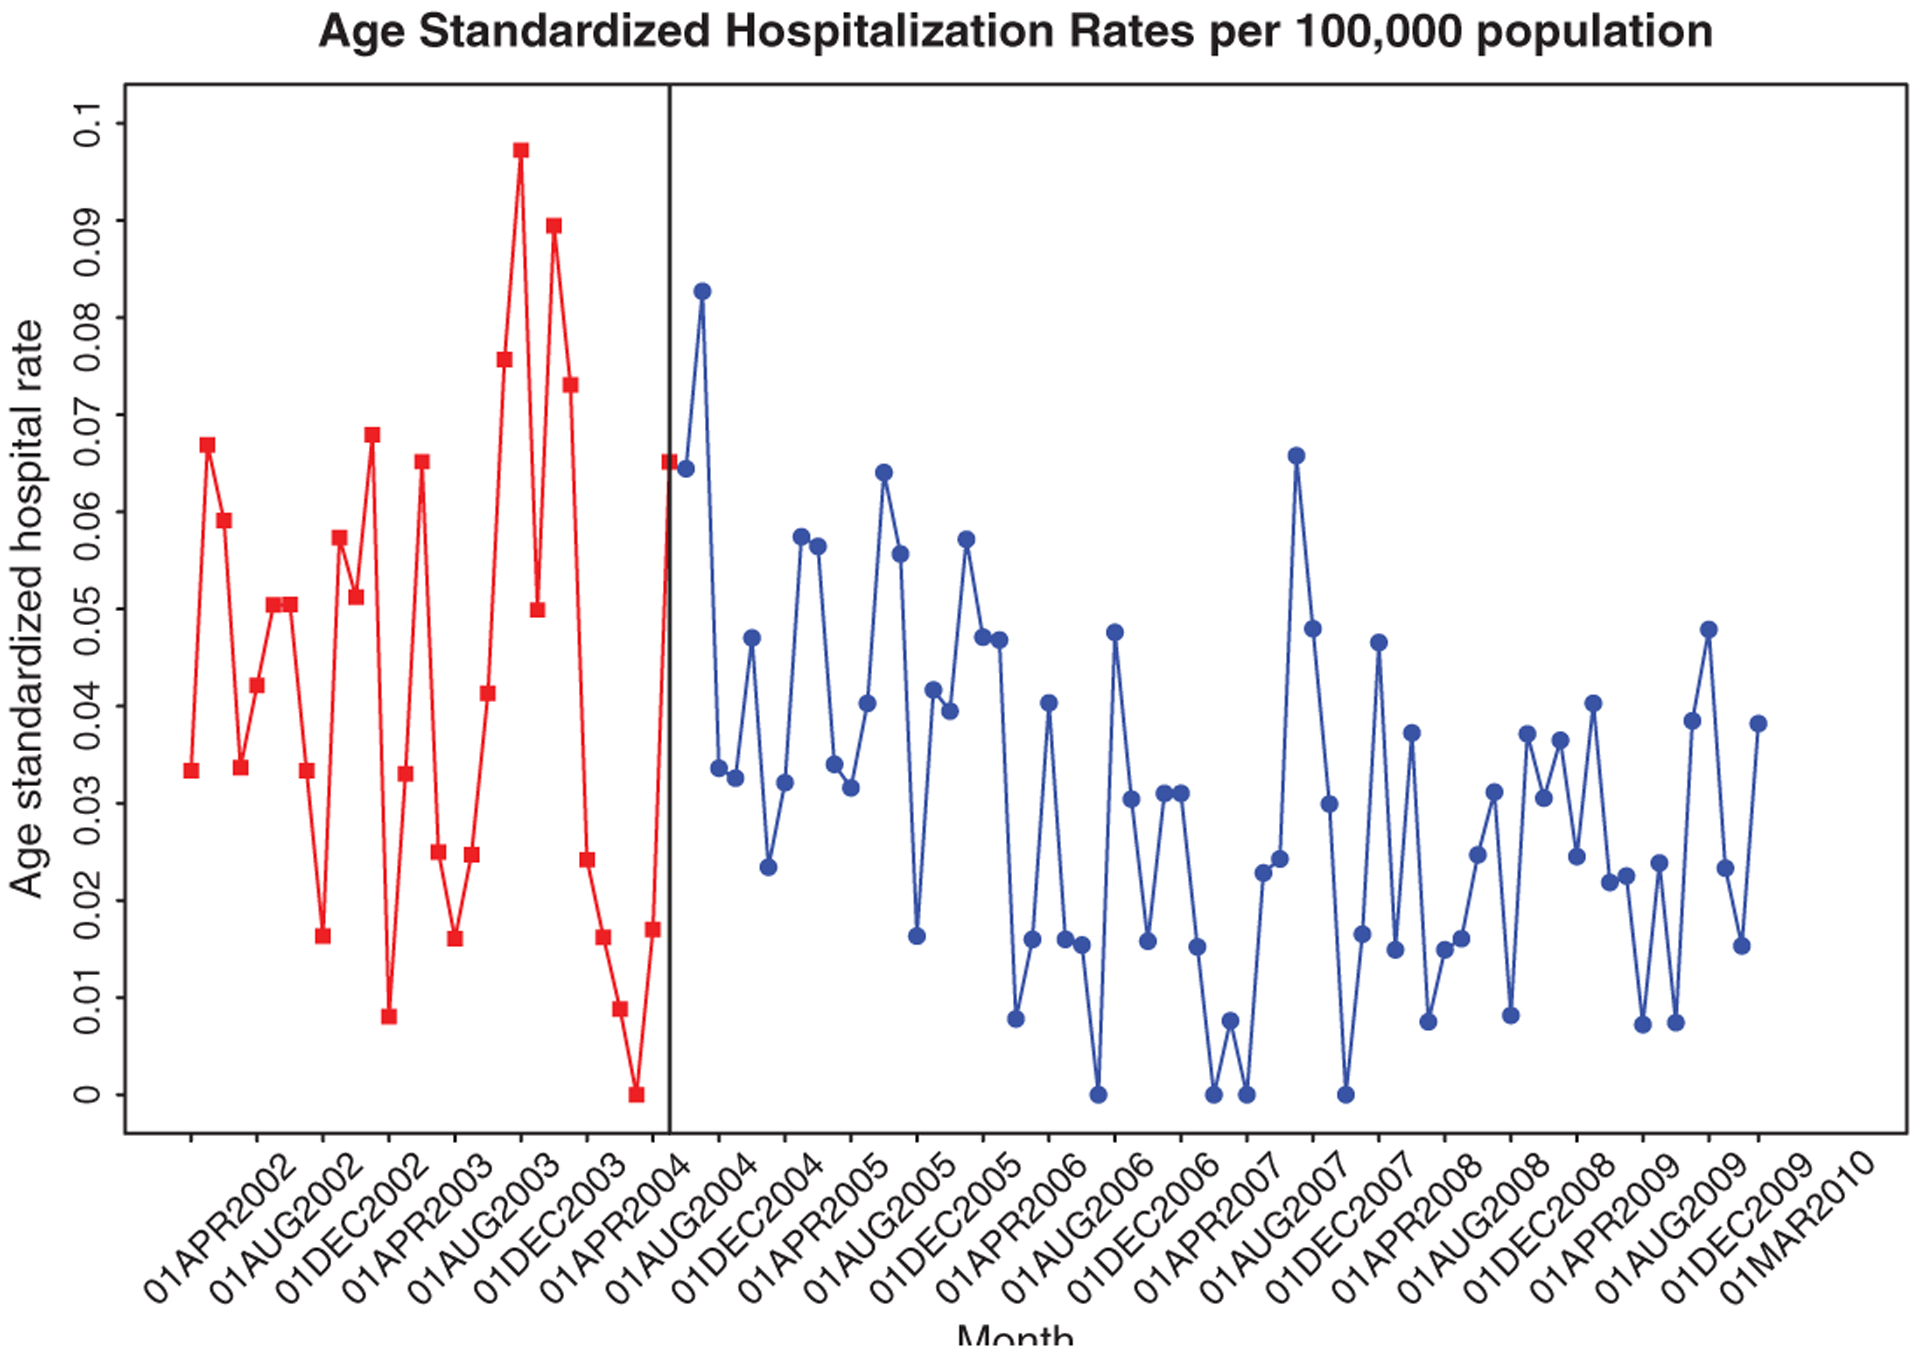
Age-standardized hospitalization rates for hot tap water scalds, Ontario, Canada, fiscal year 2002–2003 to 2009–2010. Intervention date: September 2004.
Table 1.
Rate ratios for ambulatory and hospitalization of hot water tap scalds by year, age group, and sex
| Rate Ratio | 95% CI | P | ||
|---|---|---|---|---|
| Ambulatory | ||||
| Year | 0.96 | (0.93, 0.99) | 0.017 | |
| Age, yr* | <2 | 6.76 | (5.75, 7.94) | <0.0001 |
| 2–8 | 1.40 | (1.18, 1.66) | 0.0001 | |
| 9–16 | 1.16 | (0.99, 1.38) | 0.074 | |
| 17–64 | 1.42 | (1.24, 1.62) | <0.0001 | |
| Sex: female | 1.18 | (1.07, 1.30) | 0.0009 | |
| Hospitalization Year | 0.903 | (0.86, 0.946) | <0.0001 | |
| Age, yr† | <2 | 27.8 | (15.47, 50.10) | <0.0001 |
| 2–8 | 2.97 | (1.56, 5.68) | 0.0013 | |
| 17–64 | 1.93 | (1.10, 3.39) | 0.0232 | |
| 65+ | 7.20 | (4.06, 12.76) | <0.0001 | |
| Sex: female | 0.80 | (0.644, 0.99) | 0.0365 |
CI, confidence interval.
Reference level age group 65+ years.
Reference level age group 9–16 years.
Ambulatory rates are only for postintervention data.
The age distribution of cases for both ambulatory and hospitalizations are shown in Figure 3 and in both instances it is similar in pre- and postintervention periods. In the ambulatory cases, over 65% occurred in the adult group (17–64 years), with approximately 10% in both the infant (<2 years) and the elderly (65+). Hospitalization cases show a high proportion of adults representing approximately 40% of the cases. However, there is an increase in the number of cases in both the elderly to 30% and infant 20% compared with the ambulatory group.
Figure 3.
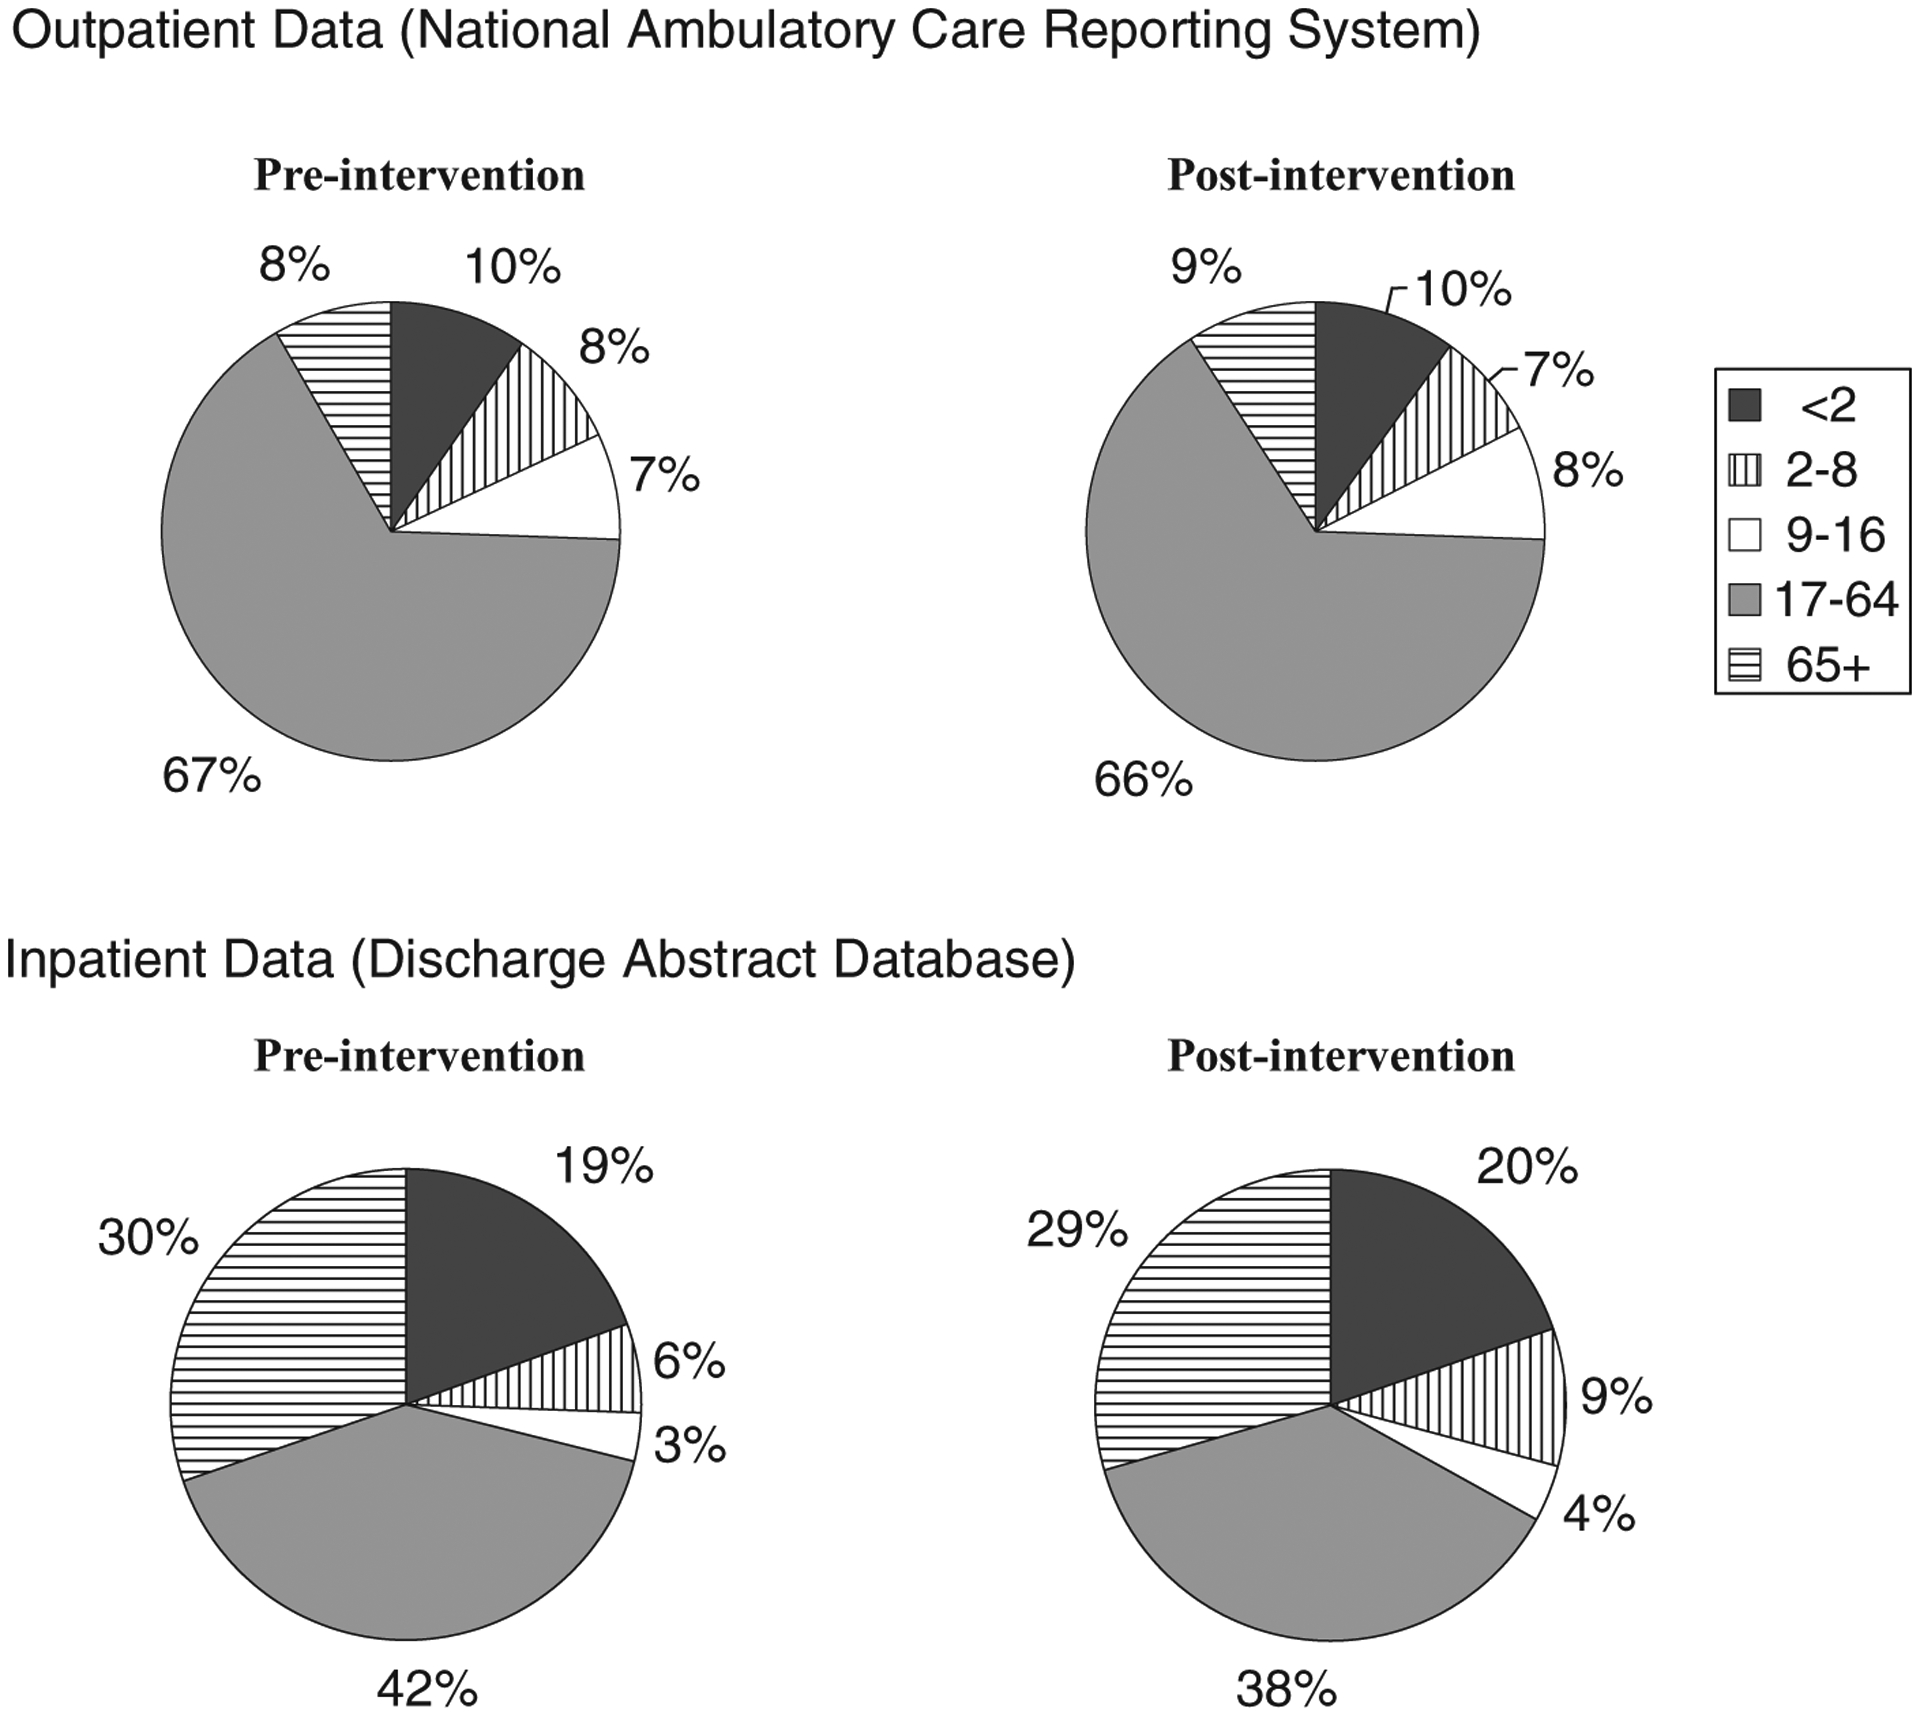
Age distribution of hot tap water scald cases pre- and postintervention of the ambulatory cases and hospitalized cases.
The distribution of hot tap water scalds across sexes is shown in Figure 4. In terms of ambulatory cases, there is a higher representation of females. Across the years, females consistently represent 55 to 57% of the hot tap water scald presenting in the ambulatory setting versus 43 to 45% males. However, we do not see the same clear distribution in hospitalization cases because of the low number of incidences; the sex difference is variable throughout each year.
Figure 4.
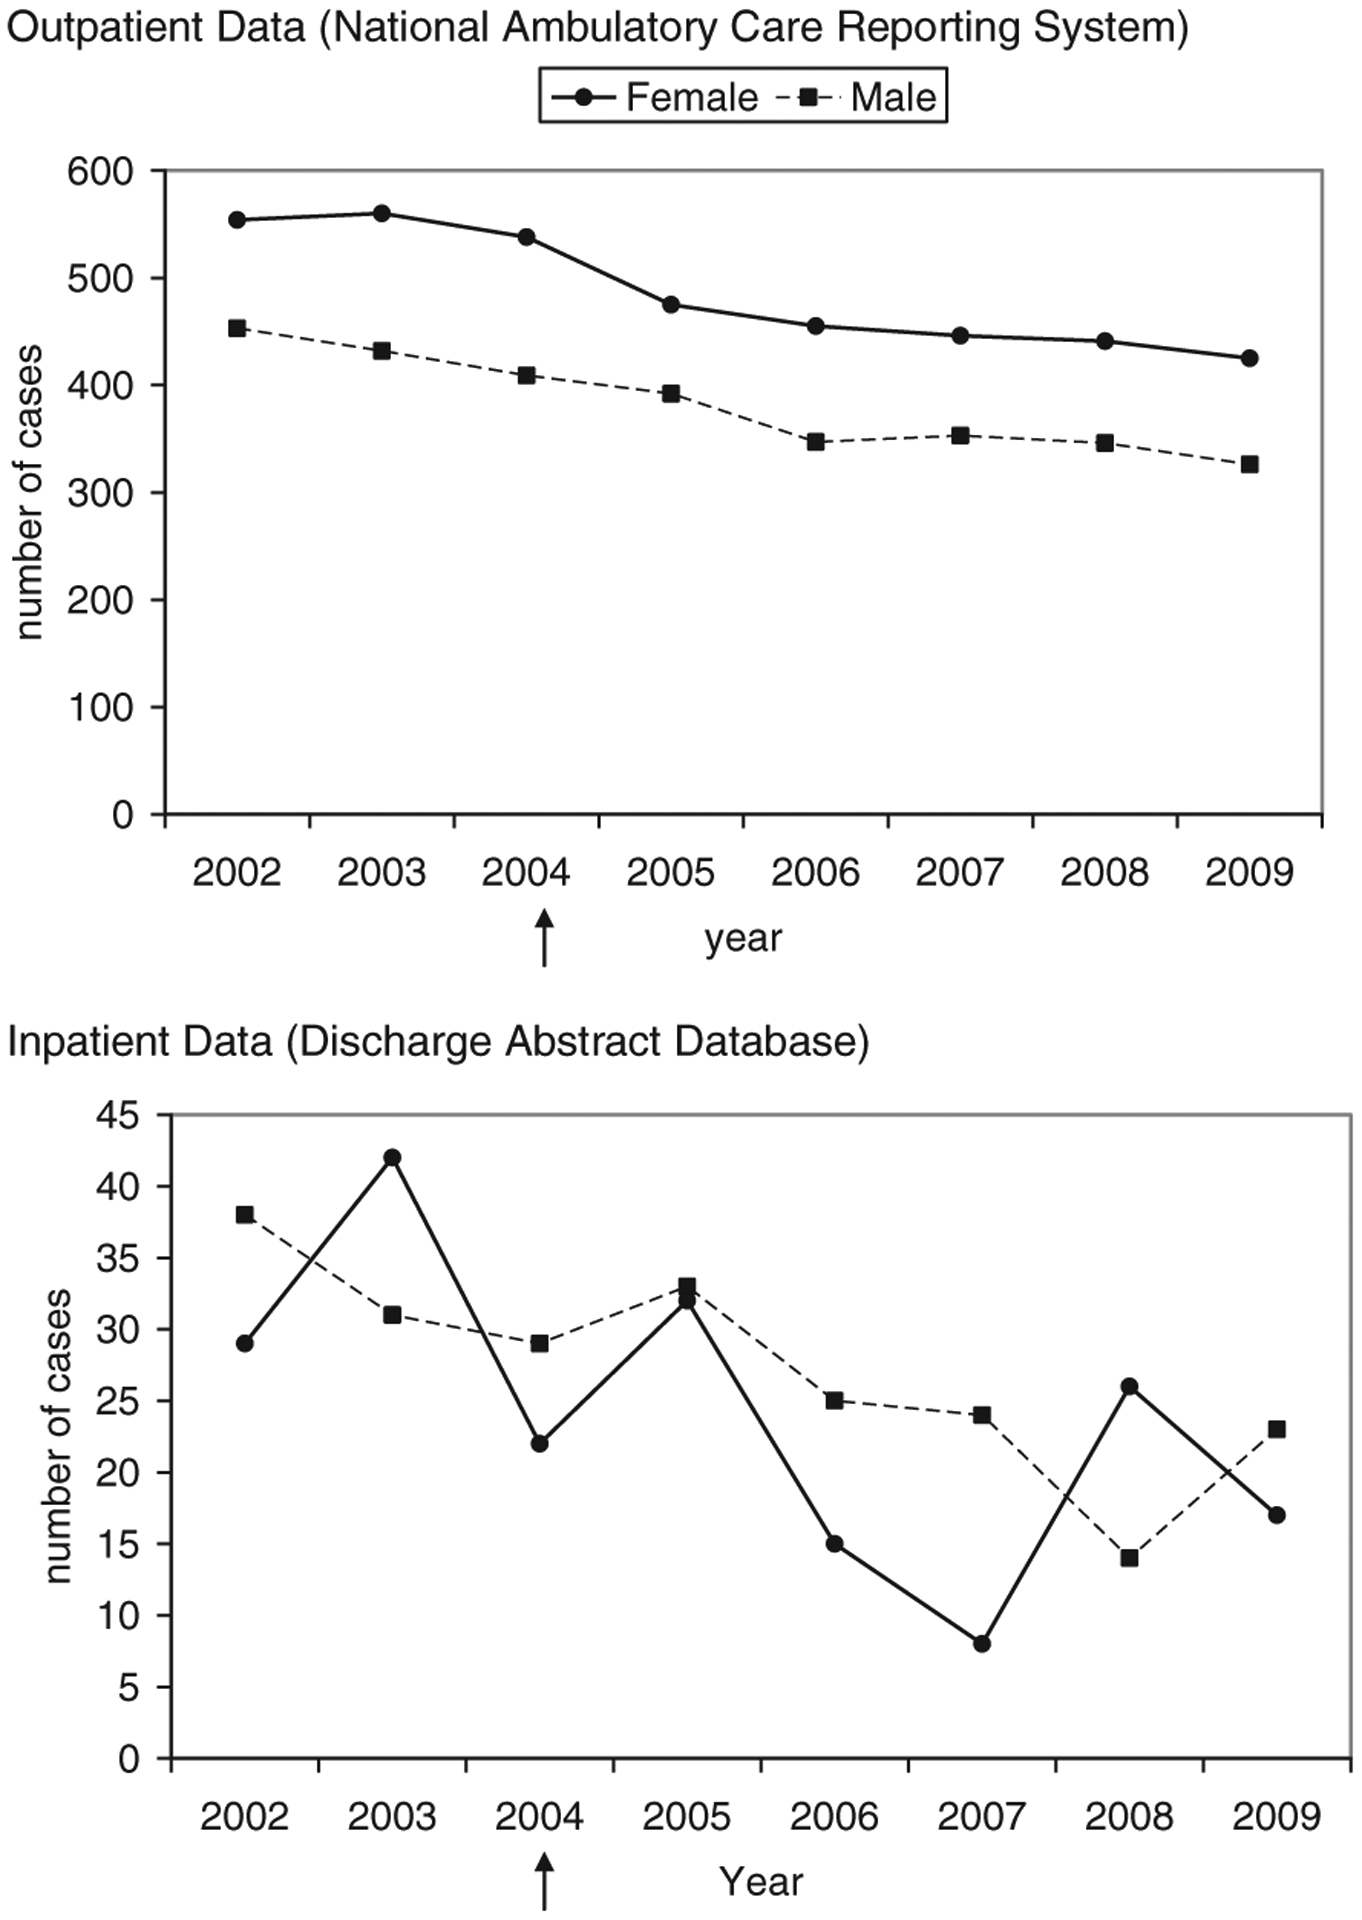
Sex distribution of hot tap water scald cases by year for the ambulatory cases and hospitalization cases, fiscal year 2002–2003 to 2009–2010. ↑indicates introduction of intervention.
Figure 5 demonstrates the change in median length of stay overall and between age groups. There was no significant change in the length of stay between pre- and postintervention groups after adjusting for age group and sex (rate ratio = 0.91 95% CI [0.70, 1.18] P = .4624), with the median length of stay of 9 days preintervention and 7 days postintervention days. In both groups, 13% of patients were hospitalized for over 1 month. There was no significant difference between pre- and postintervention cases for each age group.
Figure 5.
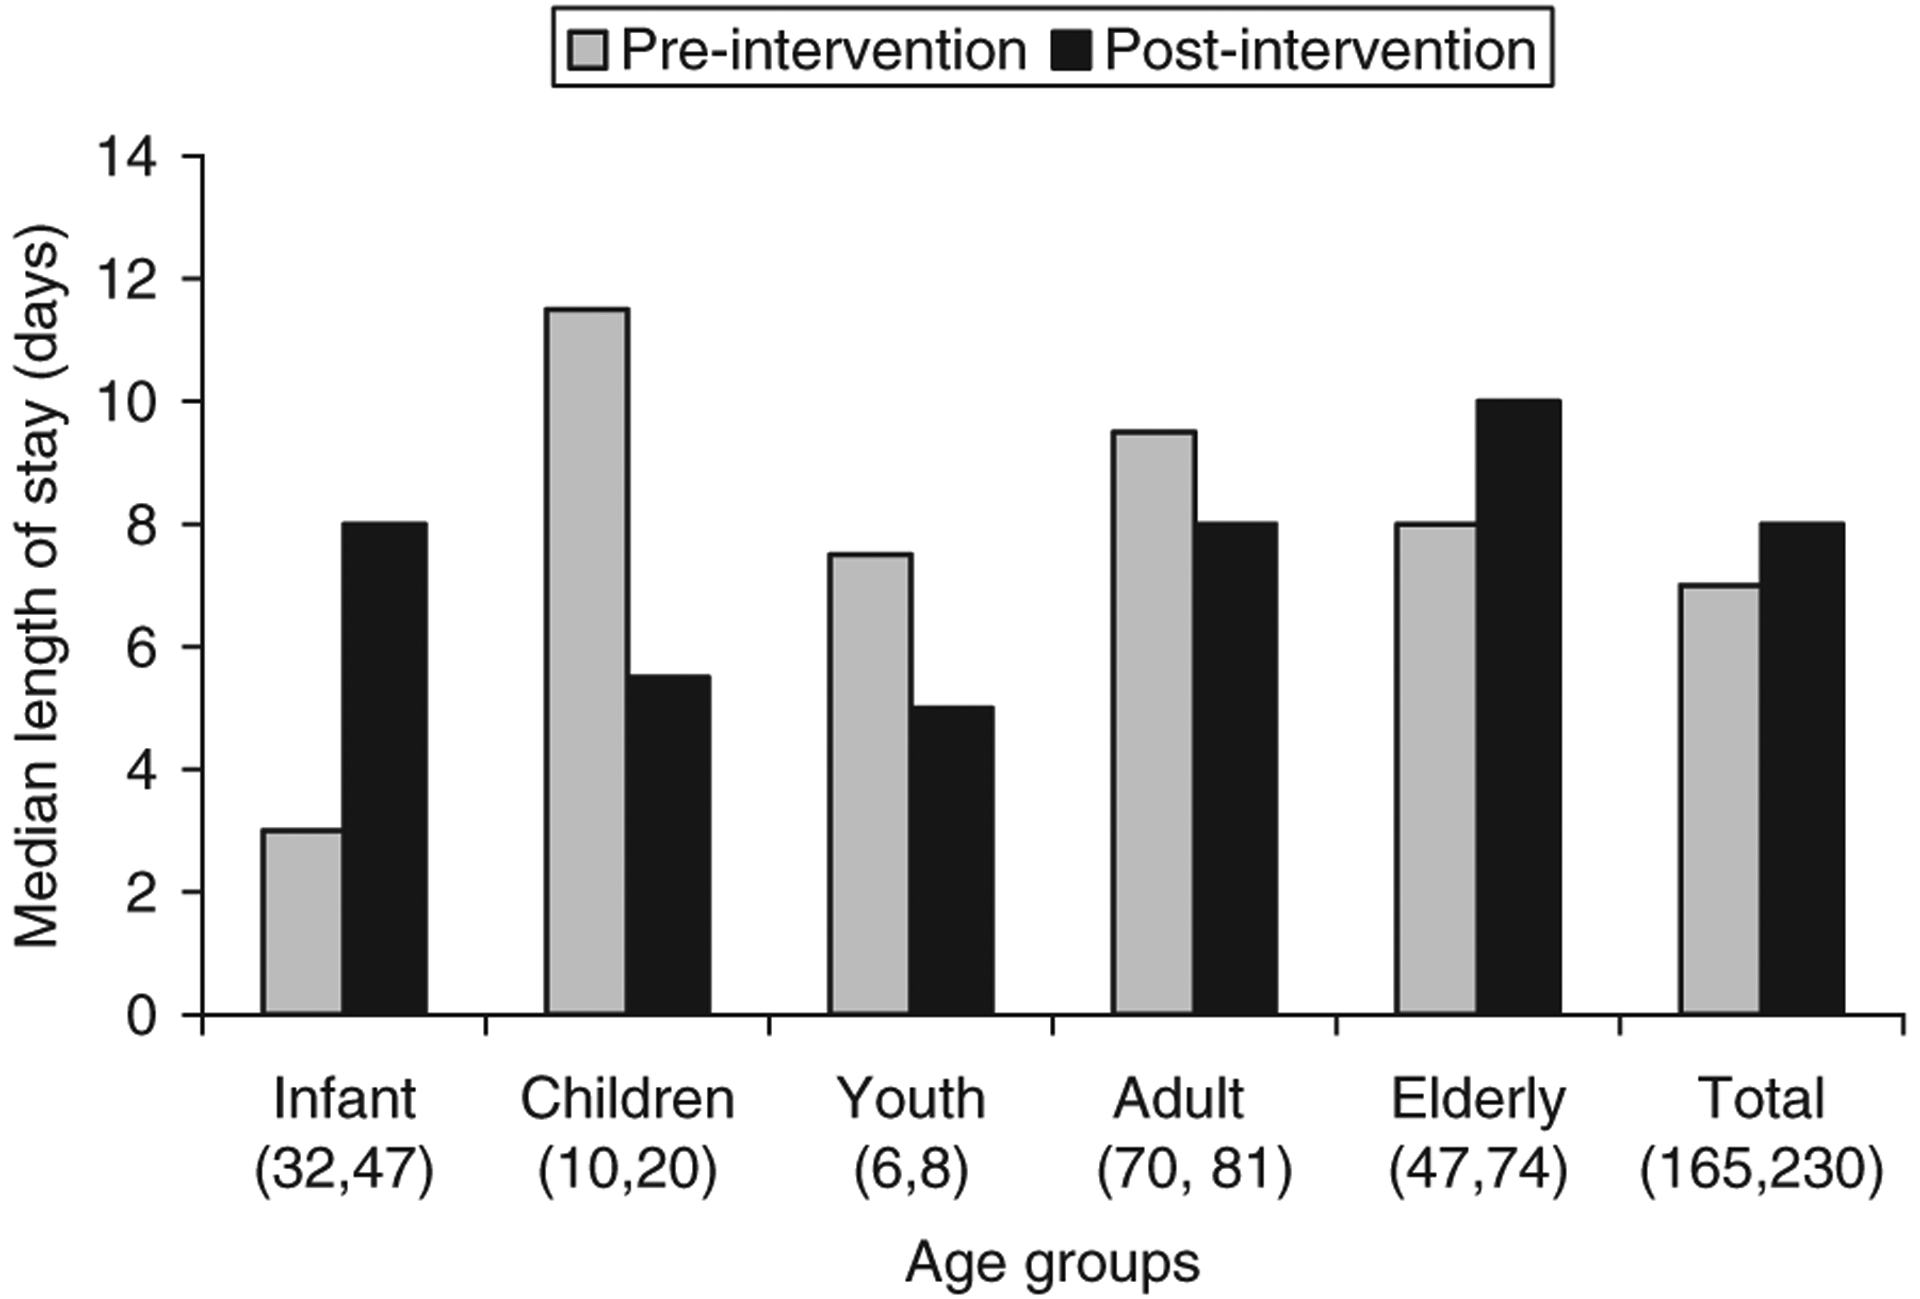
Median length of hospital stay for hot tap water scalds separated by age group and pre- and postintervention. Number of cases per group is shown in brackets (pre, post).
Figure 6 shows the distribution of cases in each triage level before and after the implementation. In both pre- and postintervention groups, the majority of cases are represented in the triage level 4 (46 and 42% respectively). There is a larger percentage of patients triaged to levels 1 to 3 after the intervention than before (OR = 1.36; 95% CI [1.19, 1.56]; P <.0001).
Figure 6.
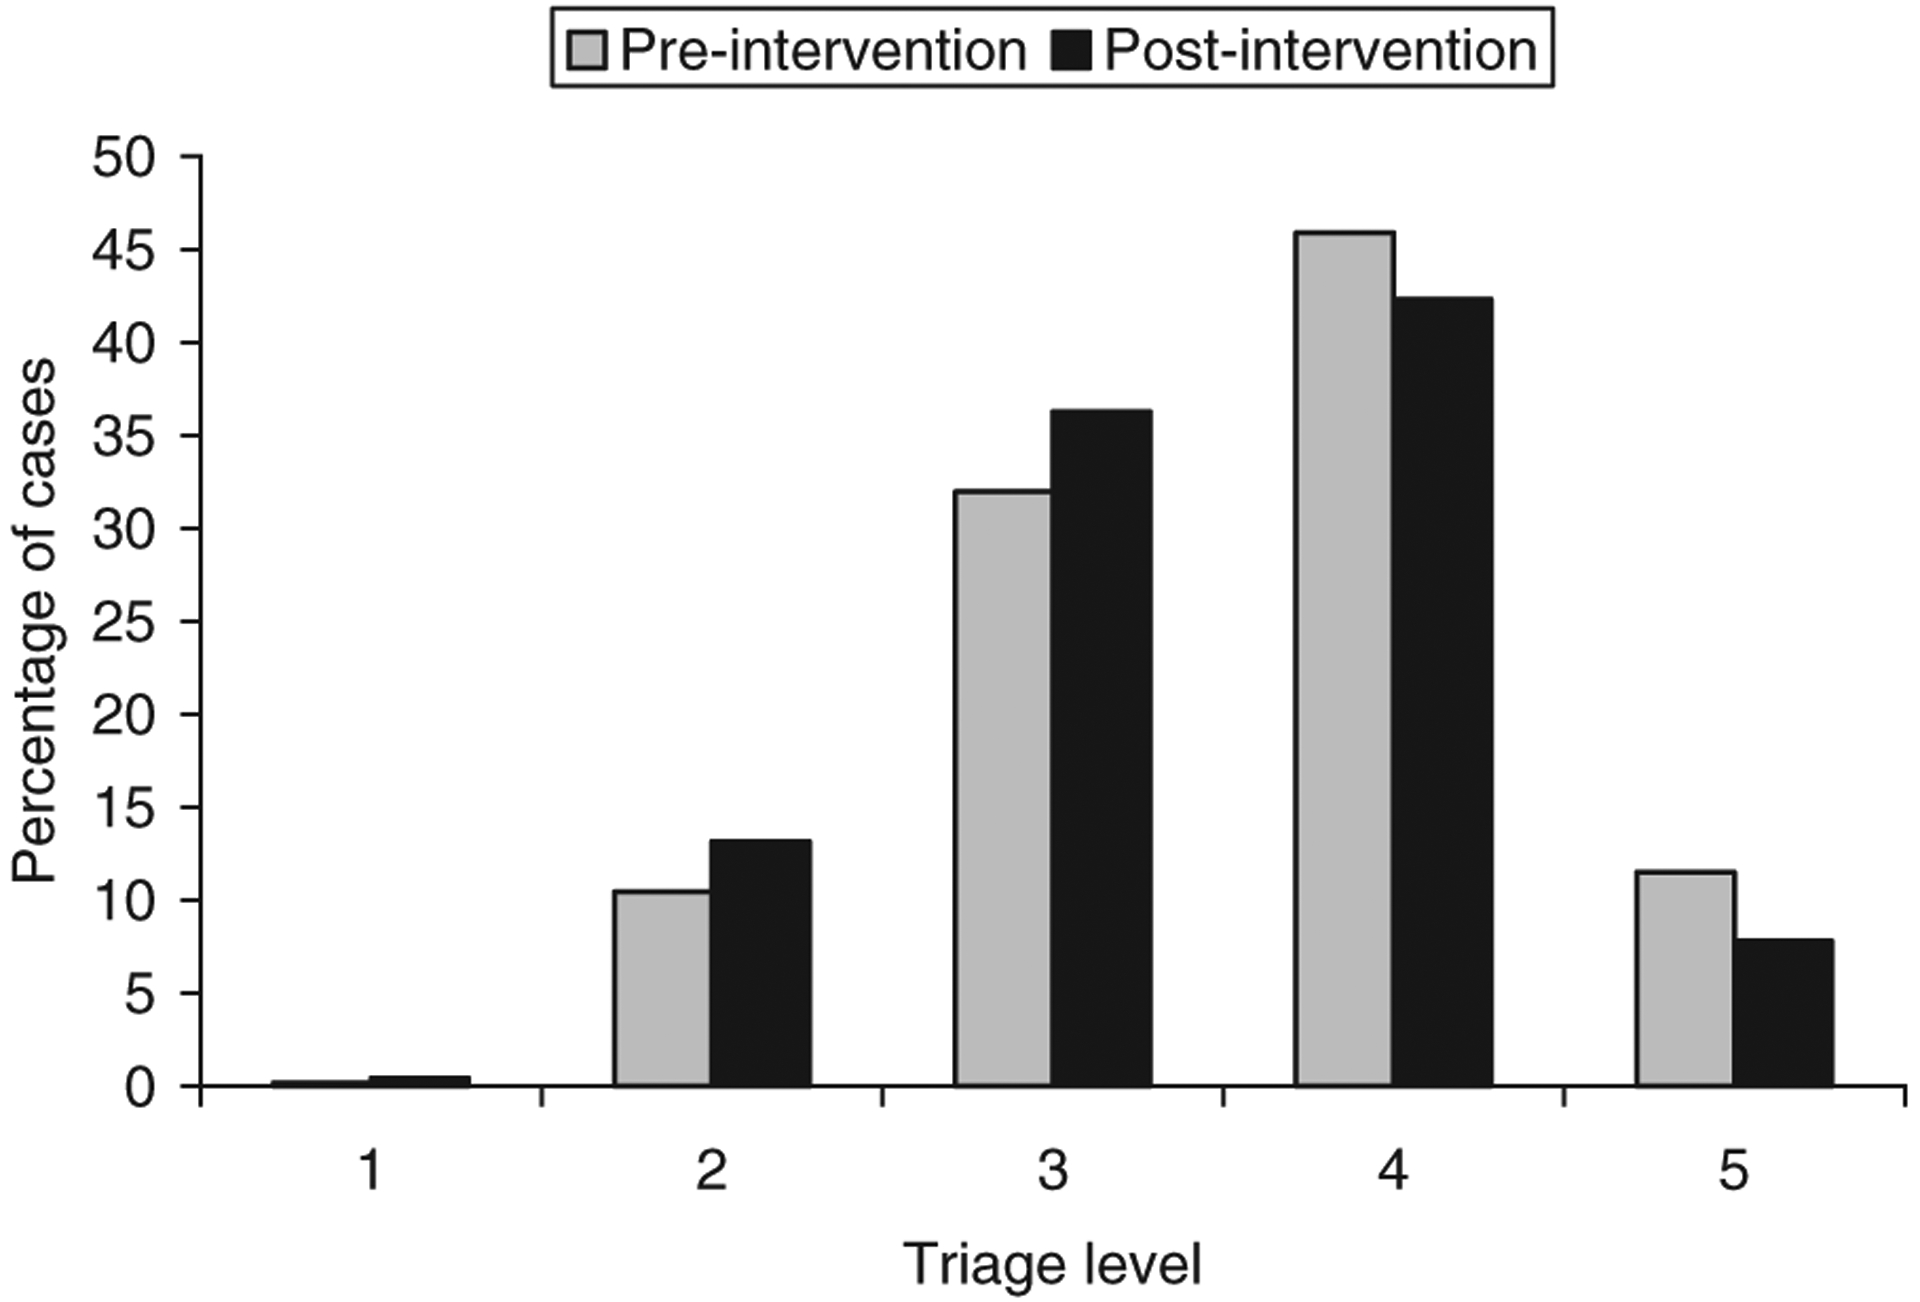
Percentage patients in each triage level for ambulatory hot tap water scald cases, pre- and postintervention. 1 = resuscitative, 2 = emergent, 3 = urgent, 4 = less urgent, 5 = nonurgent.
Interpretation
Our study has determined that there is an overall declining rate in ambulatory cases caused by hot tap water scalds in Ontario since the implementation of regulation to control the maximum temperature of water in residential homes. At the end of 5 years’ postintervention, there will be a decrease of 0.19 cases per 100,000 population. However, we did not find a significant decline in hospitalizations. These results are consistent with other international epidemiological studies that identified a positive effect after the intervention. One of the first studies evaluating this type of regulation was done in 1991 in Washington State. Erdmann et al16 studied the admission rates at two Washington state hospitals and reported a 56% decrease in the admission of patients under 15 years of age. A more recent study from New South Wales, Australia identified a 6% reduction per year in hospitalizations of all ages.7 The most important clinical relevance of these findings is that a decrease in scalding injuries, even only in ambulatory ones, leads to less converted deep burns, less surgeries, less infections, and subsequently less clinical burden. In addition, the financial impact of a decreased incidence of scald injuries appears significant and indicates that the investment of preventive measures pays off and that legislations should seriously consider implementing preventive laws and invest in such endeavors.
This is the first study that has looked at ambulatory cases in a large population setting. In general, there are higher incidences of hot tap water scalds, which require medical attention without the need for hospitalization. This study found that the regulation limiting the temperature of hot water has had a greater effect on ambulatory cases then in hospitalizations, suggesting that the passive prevention method may have had a larger impact in other countries as well but was not detected.
The CIHI data have allowed us to study the whole population of Ontario. We were able to identify the occurrences in each age group. Previous studies have focused their attention on children, the elderly, and the disabled as the primary groups affected by hot water scalds; however, in our study we found that the adult population has contributed the most in number of cases. This suggests that prevention measures should be directed to all age groups to help reduce the burden on the healthcare system.
It could be hypothesized that reducing the maximum temperature of hot water would decrease the severity of a scald because more time is required to induce an injury. We were unable to identify this relationship; in fact the results showed either a similar or increasing trend of severity of the hot tap water scalds depending on the factor analyzed. Length of stay in hospital did not change after the introduction of the regulation; and the triage level that ambulatory cases were assigned to showed a trend that cases are being assigned to a more urgent level. This may be explained by the increasing awareness of the severity of scalds in the medical field, leading a change in the urgency to treat.
There are a few limitations to this study. The lack of enough preintervention data has prevented us from accurately comparing the trend of incidence before and after the regulation. CIHI only has data available starting from 2002, limiting our preintervention group; therefore we can not be certain that the trend in hot tap water scald cases was already decreasing previous to the intervention. This is a retrospective cohort study and is sensitive to confounding factors. We are unable to determine a direct relationship between the introduction of the intervention and the occurrence of hot tap water scalds because of factors such as increased awareness to the danger of hot water, and improving knowledge of first aid. The low level of incidence of hospitalization limits our ability to detect a significant change through statistical analysis.
This study is first to have evaluated the effect of the Ontario legislation to reduce the maximum hot water temperature in residential homes. We have provided evidence that the regulation has been effective in reducing the incidence of ambulatory cases caused by hot tap water scalds. Taking into account previous studies as well, we support the introduction of this regulation in other provinces. However, we are not dismissing the fact that other interventions are still required in preventing hot water scalds because they are still causing considerable morbidity to the population. Public awareness and prevention campaigns are still necessary and recommended to help eliminate this highly preventable injury. It is suggested that this study should be repeated in 5 years to take into account the average life span of a hot water heater, which is 10 years. In 2016, we could assume that the majority of the tanks will be replaced, giving a better representation of the effect of regulating the maximum hot water temperature in residential homes.
ACKNOWLEDGMENTS
This research was supported by the Canadian Institute for Health Information (CIHI), Graduate Student Data Access Program (GSDAP), National Institutes of Health RO1 GM087285-01, Canada Foundation for Innovation Leader’s Opportunity Fund: project # 25407, and Physicians’ Services Incorporated Foundation—Health Research Grant Program. The data were supplied by CIHI; however, the results and views are the sole expression of the authors.
REFERENCES
- 1.Atiyeh BS, Gunn SW, Hayek SN. State of the art in burn treatment. World J Surg 2005;29:131–48. [DOI] [PubMed] [Google Scholar]
- 2.Spinks A, Wasiak J, Cleland H, Beben N, Macpherson AK. Ten-year epidemiological study of pediatric burns in Canada. J Burn Care Res 2008;29:482–8. [DOI] [PubMed] [Google Scholar]
- 3.Feldman KW, Schaller RT, Feldman JA, McMillon M. Tap water scald burns in children. 1997. Inj Prev 1998;4:238–42. [DOI] [PMC free article] [PubMed] [Google Scholar]
- 4.Backstein R, Peters W, Neligan P. Burns in the disabled. Burns 1993;19:192–7. [DOI] [PubMed] [Google Scholar]
- 5.Mezei R, Stanwick R. Hot tap water scalds prevention: A case for the power of public health partnerships in affecting regulatory change. Paediatr Child Health 2004;9:153–5. [DOI] [PMC free article] [PubMed] [Google Scholar]
- 6.Peck M, Brewer AC, Pressman M, Blank E, Mickalide A. Hot tap water legislation in the United States. J Burn Care Res 2010;31:918–25. [DOI] [PubMed] [Google Scholar]
- 7.Harvey LA, Poulos RG, Finch CF, Olivier J, Harvey JG. Hospitalised hot tap water scald patients following the introduction of regulations in NSW, Australia: who have we missed? Burns 2010;36:912–9. [DOI] [PubMed] [Google Scholar]
- 8.Moritz AR, Henriques FC. Studies of thermal injury: II. The relative importance of time and surface temperature in the causation of cutaneous burns. Am J Pathol 1947;23:695–720. [PMC free article] [PubMed] [Google Scholar]
- 9.Cagle KM, Davis JW, Dominic W, Gonzales W. Results of a focused scald-prevention program. J Burn Care Res 2006;27:859–63. [DOI] [PubMed] [Google Scholar]
- 10.Tan J, Banez C, Cheung Y, et al. Effectiveness of a burn prevention campaign for older adults. J Burn Care Rehabil 2004;25:445–51. [DOI] [PubMed] [Google Scholar]
- 11.Fallat ME, Rengers SJ. The effect of education and safety devices on scald burn prevention. J Trauma 1993;34:560–3; discussion 563–4. [DOI] [PubMed] [Google Scholar]
- 12.Jaye C, Simpson JC, Langley JD. Barriers to safe hot tap water: results from a national study of New Zealand plumbers. Inj Prev 2001;7:302–6. [DOI] [PMC free article] [PubMed] [Google Scholar]
- 13.Building Code Act, 1992. - O. Reg. 23/04 Available from http://www.e-laws.gov.on.ca/html/source/regs/english/2004/elaws_src_regs_r04023_e.htm; Internet; accessed 19 Nov. 2010.
- 14.Canadian Institute for Health Information. Emergency and ambulatory care. Available from http://www.cihi.ca/CIHIext-portal/internet/EN/TabbedContent/types+of+care/hospital+care/emergency+care/cihi016745; Internet; accessed 20 Nov. 2010.
- 15.Box GEP, Tiao GC. Intervention analysis with applications to economic and environmental problems. J Am Statist Assoc 1975;70:70–9. [Google Scholar]
- 16.Erdmann TC, Feldman KW, Rivara FP, Heimbach DM, Wall HA. Tap water burn prevention: the effect of legislation. Pediatrics 1991;88:572–7. [PubMed] [Google Scholar]