Abstract
Dynamic functional connectivity (DFC) analysis can capture time‐varying properties of connectivity. However, studies on large samples using DFC to investigate transdiagnostic dysconnectivity across schizophrenia (SZ), bipolar disorder (BD), and major depressive disorder (MDD) are rare. In this study, we used resting‐state functional magnetic resonance imaging and a sliding‐window method to study DFC in a total of 610 individuals (150 with SZ, 100 with BD, 150 with MDD, and 210 healthy controls [HC]) at a single site. Using k‐means clustering, DFCs were clustered into three functional connectivity states: one was a more frequent state with moderate positive and negative connectivity (State 1), and the other two were less frequent states with stronger positive and negative connectivity (State 2 and State 3). Significant 4‐group differences (SZ, BD, MDD, and HC groups; q < .05, false‐discovery rate [FDR]‐corrected) in DFC were nearly only in State 1. Post hoc analyses (q < .05, FDR‐corrected) in State 1 showed that transdiagnostic dysconnectivity patterns among SZ, BD and MDD featured consistently decreased connectivity within most networks (the visual, somatomotor, salience and frontoparietal networks), which was most obvious in both range and extent for SZ. Our findings suggest that there is more common dysconnectivity across SZ, BD and MDD than we previously expected and that such dysconnectivity is state‐dependent, which provides new insights into the pathophysiological mechanism of major psychiatric disorders.
Keywords: bipolar disorder, dynamic functional connectivity, major depressive disorder, schizophrenia, transdiagnostic study
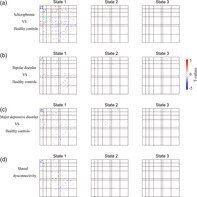
We identified three functional connectivity states across multiple psychiatric disorders and healthy controls: one was a more frequent state with weak connectivity, and the other two were less frequent states with strong connectivity. Dysconnectivity in the psychiatric patients was found nearly only in the weak connectivity state. Psychiatric patients spent less time in the weak connectivity state than HC patients.
1. INTRODUCTION
The traditional view of psychiatry holds that major psychiatric disorders (e.g., schizophrenia [SZ], bipolar disorder [BD], and major depressive disorder [MDD]) are separate diagnostic categories with distinct etiologies and clinical presentations. However, existing diagnostic categories are not clearly associated with distinct neurobiological abnormalities (Insel & Cuthbert, 2015; Xia et al., 2018), which may hinder the search for biomarkers in psychiatry (Singh & Rose, 2009). Major psychiatric disorders have common abnormalities in many characteristics, including genetic risk and etiology (Consortium, 2013; Lee et al., 2013), neural alterations (Goodkind et al., 2015; McTeague et al., 2017; Sha, Wager, Mechelli, & He, 2019), and clinical symptoms (Barch & Sheffield, 2014; Lee et al., 2015; Levit‐Binnun, Davidovitch, & Golland, 2013). In addition, comorbidity among psychiatric disorders is very common, with 22% of patients having 2 diagnoses and 23% having 3 or more diagnoses (Kessler, Chiu, Demler, & Walters, 2005). Taken together, the abovementioned findings suggest that no clear boundaries exist between different mental disorders. In contrast, each distinct psychiatric disorder is hypothesized to have broadly shared etiologies and mechanisms relative to the other psychiatric disorders (Cuthbert & Insel, 2013; Lahey, Zald, Hakes, Krueger, & Rathouz, 2014). Transdiagnostic studies are necessary because they focus on fundamental processes underlying multiple psychiatric disorders, help to explain comorbidity among disorders, and may lead to improved assessment and treatment of disorders (Caspi et al., 2014; Husain, 2017; Nolen‐Hoeksema & Watkins, 2011).
An important application of transdiagnostic models of psychopathology is to uncover shared (common) neurobiological abnormalities across multiple psychiatric disorders. The vast majority of previous studies, however, have merely compared patients with one specific group of psychiatric disorders to healthy controls (HC). Of the small number of transdiagnostic studies, many were meta‐analyses based on individual studies using different methodologies (Brandl et al., 2019; Goodkind et al., 2015; Sha et al., 2019; Wise et al., 2017). For example, a previous study found that gray matter loss in the salience network is a common abnormality across six diverse psychiatric disorders (Goodkind et al., 2015). Recently, a small but rapidly growing number of original transdiagnostic studies have been conducted to directly investigate the shared abnormalities in brain structure, functional connectivity and regional brain activity across multiple mental disorders (Baker et al., 2014, 2019; Chang et al., 2017; Elliott, Romer, Knodt, & Hariri, 2018; Gong et al., 2019; Wei et al., 2018; Xia et al., 2018). For example, a previous study reported that disruptions within the frontoparietal network may be a shared feature across both SZ and affective psychosis (Baker et al., 2014); this finding was validated and extended by a recent study (Baker et al., 2019). In addition, a recent study found that the risk of common mental illnesses mapped onto hyperconnectivity between the visual association cortex and both the frontoparietal and default‐mode networks (Elliott et al., 2018). Our previous studies (Chang et al., 2017; Wei et al., 2018; Xia, Womer, et al., 2018) also found broad common structural and functional differences across SZ, BD and MDD and suggested that SZ was the most serious in extent.
Despite the contribution of advancing transdiagnostic research with regard to studies using functional connectivity, these studies assumed that the functional properties of the brain during the entire functional magnetic resonance imaging (fMRI) scan were static rather than dynamic. In fact, interactions among large‐scale brain networks are highly dynamic, and time‐averaged or static connectivity provides limited information about the functional organization of neural circuits (Allen et al., 2014; Calhoun, Miller, Pearlson, & Adalı, 2014). Therefore, using time‐varying or dynamic methods to investigate shared patterns of dysfunction in large‐scale functional connectivity networks across major psychiatric disorders may provide further information about their psychopathology. Correspondingly, a few transdiagnostic studies have used dynamic functional connectivity (DFC) to investigate the dynamic functional architecture of brain networks in healthy young adults or the neurobiological abnormalities associated with psychiatric disorders (Han et al., 2019; Liao, Cao, Xia, & He, 2017; Liu, Liao, Xia, & He, 2018; Pang et al., 2018; Rashid, Damaraju, Pearlson, & Calhoun, 2014; Reinen et al., 2018; Wang et al., 2019). For example, a previous study showed that DFC can reveal state‐dependent connectivity abnormalities that are not observed in static functional connectivity, suggesting that DFC is more sensitive than static functional connectivity (Rashid et al., 2014). Recently, another transdiagnostic study demonstrated that DFC was quite reliable within participants (within and across visits) and could act as a fingerprint, identifying specific individuals from within a larger group (Reinen et al., 2018). Although these studies that used DFC were very important, all of them had relatively small sample sizes (especially the patient groups) or studied only two diseases (i.e., SZ and BD or MDD and BD).
Here, we employed a widely used sliding‐window approach (Allen et al., 2014; Calhoun et al., 2014; Damaraju et al., 2014; Hutchison et al., 2013) to characterize DFC networks among patients with SZ (N = 150), BD (N = 100), or MDD (N = 150) and HC (N = 210). We aimed to investigate differences in dynamic connectivity between HC and patients with SZ, BD or MDD. Based on previous findings (Baker et al., 2014, 2019; Goodkind et al., 2015; Rashid et al., 2014), we hypothesized that the three disorders share dysconnectivity in the salience and frontoparietal networks as well as that this dysconnectivity is state‐dependent.
2. MATERIALS AND METHODS
2.1. Participants
The study was approved by the Institutional Review Board of China Medical University. All participants provided written informed consent after receiving a detailed description of the study. Eight hundred and fifty‐one individuals participated in this study, including 332 HC, 183 SZ patients, 132 BD patients and 204 MDD patients. After head motion control, we excluded 41 HC, 30 SZ, 18 BD and 25 MDD patients (see Section 2.4 for details). To match the four groups by age and sex, we further excluded 81 HC patients (including 2 HC patients who lacked age and gender information), 3 SZ patients, 14 BD patients and 29 MDD patients. Therefore, we finally included 610 participants (see Section 2.4 for details), including 210 HC, 150 SZ patients, 100 BD patients and 150 MDD patients. The demographic characteristics, clinical characteristics, cognitive function and head motion information of the included participants are summarized in Table 1. All participants with SZ, BD, and MDD were recruited from the inpatient and outpatient services at the Shenyang Mental Health Center and the Department of Psychiatry at the First Affiliated Hospital of China Medical University, Shenyang, China, between February 2009 and April 2018. HC were recruited from the local community by advertisement. Please refer to the Supporting Information for the detailed inclusion and exclusion criteria.
TABLE 1.
Demographic characteristics, clinical characteristics, and the cognitive function of the healthy controls and patients with schizophrenia, bipolar disorder, and major depressive disorder
| HC | SZ | BD | MDD | |||
|---|---|---|---|---|---|---|
| Variable | (n = 210) | (n = 150) | (n = 100) | (n = 150) | F/χ 2 values | p values |
| Demographic characteristic | ||||||
| Age at scan (years) | 24.37 (5.74) | 23.67 (8.77) | 24.56 (5.95) | 25.53 (8.30) | 1.663 | .174 |
| Male | 86 (41%) | 59 (39%) | 36 (36%) | 43 (29%) | 6.269 | .099 |
| Clinical characteristic | ||||||
| Duration (months) | N/A | 23.27 (34.97) | 36.61 (36.09) | 20.57 (28.10) | 7.745 | .001 |
| First episode (yes) | N/A | 96 (64%) | 48 (48%) | 122 (81%) | 30.599 | 2.267E‐7 |
| Medication (yes) | N/A | 111 (74%) | 65 (65%) | 85 (57%) | 9.941 | .007 |
| Antidepressants | N/A | 12 (8%) | 30 (30%) | 58 (39%) | 39.395 | 2.788E‐9 |
| Antipsychotics | N/A | 71 (47%) | 28 (28%) | 6 (4%) | 72.958 | 1.110E‐16 |
| Mood stabilizers | N/A | 5 (3%) | 39 (39%) | 2 (1%) | 99.370 | .000 |
| Anxiolytics | N/A | 14 (9%) | 7 (7%) | 31 (21%) | 12.762 | .002 |
| Other drugs | N/A | 9 (6%) | 0 (0%) | 0 (0%) | N/A | N/A |
| HAMD‐17 | (n = 194) | (n = 121) | (n = 94) | (n = 147) | ||
| 1.06 (1.71) | 6.82 (6.14) | 11.92 (9.78) | 19.18 (9.84) | 187.866 | 4.151E‐84 | |
| HAMA | (n = 194) | (n = 113) | (n = 94) | (n = 135) | ||
| 0.92 (2.15) | 5.99 (6.22) | 9.56 (9.33) | 15.99 (9.78) | 127.235 | 3.937E‐62 | |
| YMRS | (n = 192) | (n = 113) | (n = 97) | (n = 135) | ||
| 0.17 (0.66) | 1.93 (4.70) | 6.72 (9.71) | 1.27 (2.88) | 40.150 | 2.095E‐23 | |
| BPRS | (n = 162) | (n = 147) | (n = 86) | (n = 98) | ||
| 18.40 (1.24) | 33.82 (13.11) | 26.20 (9.45) | 27.18 (7.39) | 78.791 | 1.362E‐41 | |
| Cognitive function | ||||||
| WCST | (n = 173) | (n = 107) | (n = 87) | (n = 114) | ||
| Correct responses | 33.09 (10.43) | 19.79 (11.44) | 28.10 (11.30) | 26.11 (11.20) | 33.111 | 1.865E‐19 |
| Categories completed | 4.46 (1.90) | 1.88 (1.93) | 3.57 (1.97) | 3.15 (1.97) | 39.934 | 4.874E‐23 |
| Total errors | 14.95 (10.59) | 28.21 (11.44) | 19.54 (11.23) | 21.85 (11.24) | 32.645 | 3.308E‐19 |
| Perseverative errors | 5.30 (6.46) | 11.36 (9.71) | 7.74 (8.50) | 8.79 (8.71) | 12.624 | 5.919E‐8 |
| Nonperseverative errors | 9.58 (5.55) | 16.79 (8.15) | 12.09 (6.15) | 13.06 (6.50) | 27.310 | 2.598E‐16 |
| Head motion parameters | ||||||
| Mean FD (mm) | 0.10 (0.03) | 0.10 (0.04) | 0.11 (0.04) | 0.10 (0.03) | 1.923 | .125 |
| Percentage of excessive FD | 0.07 (0.07) | 0.06 (0.06) | 0.08 (0.08) | 0.06 (0.06) | 1.805 | .145 |
| Max translation (mm) | 0.44 (0.46) | 0.53 (0.55) | 0.50 (0.47) | 0.50 (0.44) | 1.080 | .357 |
| Max rotation (degree) | 0.38 (0.34) | 0.40 (0.38) | 0.46 (0.37) | 0.46 (0.46) | 1.919 | .125 |
Notes: Data are presented as either a number (%) or the mean (SD).
Abbreviations: BD, bipolar disorder; BPRS, Brief Psychiatric Rating Scale; FD, framewise displacement; HAMA, Hamilton Anxiety Scale; HAMD, Hamilton Depression Scale; HC, healthy control; MDD, major depressive disorder; N/A, not available/not applicable; SZ, schizophrenia; WCST, Wisconsin Card Sorting Test; YMRS, Young Mania Rating Scale.
2.2. MRI acquisition
MRI data were acquired using a GE Signa HD 3.0‐T scanner (General Electric, Milwaukee, WI) with a standard 8‐channel head coil at the First Affiliated Hospital of China Medical University. Functional imaging was performed using a gradient‐echo‐planar imaging (EPI‐GRE) sequence. The following parameters were used: repetition time = 2,000 ms, echo time = 30 ms, flip angle = 90°, field of view = 240 mm × 240 mm, matrix = 64 × 64, slice thickness = 3 mm with no gap, and number of slices = 35. The scan lasted 6 min and 40 s, resulting in 200 volumes. The participants were instructed to rest and relax with their eyes closed but to remain awake during the scan.
2.3. Data preprocessing
All images were preprocessed using SPM12 (www.fil.ion.ucl.ac.uk/spm/) and Data Processing & Analysis of Brain Imaging (Yan, Wang, Zuo, & Zang, 2016). The volumes from the first 10 time points were discarded to allow the signal to reach equilibrium. The subsequent preprocessing steps included slice‐timing correction and head motion correction. The corrected functional images were spatially normalized to the Montreal Neurological Institute space using the EPI template in SPM12, resampled to 3‐mm × 3‐mm × 3‐mm isotropic voxels, and further smoothed via a Gaussian kernel. Considering that spatial smoothing with a large kernel may blur the subtle information hidden in the fMRI data (Zeng, Shen, Liu, & Hu, 2014) and that using a Gaussian kernel with a 4‐mm full width at half‐maximum, we obtained stable results in our previous work (Xia, Womer, et al., 2018), we set the Gaussian kernel to 4‐mm full width at half‐maximum. Then, we performed linear detrending and temporal bandpass filtering (0.01–0.1 Hz) to reduce low‐frequency drift and high‐frequency noise. Next, several confounding covariates, including the Friston‐24 head motion parameters, white matter, cerebrospinal fluid, and global signals, were regressed out of the blood oxygen level‐dependent (BOLD) time series for all voxels.
2.4. Head motion control
Because excessive head motion can significantly affect dynamic connectivity analysis (Hutchison et al., 2013; Van Dijk, Sabuncu, & Buckner, 2012), we carried out head motion control and excluded participants with excessive head motion before dynamic connectivity analysis. We excluded participants if they had mean framewise displacement (FD) values >0.2 mm, if the outliers of FD accounted for >30% of all volumes (190 volumes), or if head motion exceeded 3 mm or 3°. According to these criteria, we excluded 41 HC, 30 SZ, 18 BD and 25 MDD patients. The mean FD, percentage of outliers and maximum head motion are presented in Table 1.
2.5. DFC analysis
The average BOLD time series of 114 nodes within the 17‐network functional atlas of Yeo et al. (2011) were extracted. Dynamic connectivity was estimated from these time series with a widely used sliding‐window approach in the software GIFT (Calhoun, Adali, Pearlson, & Pekar, 2001; Erhardt et al., 2011). The window was a rectangular window of 17× the repetition time (TR) convolved with a Gaussian of sigma 3 × TR to obtain a tapered window and slid in steps of 1 TR. A previous study (Shirer, Ryali, Rykhlevskaia, Menon, & Greicius, 2012) suggested that a sliding window width range of 30–60 s was appropriate for dynamic connectivity analyses. This previous study also revealed consistent state solution stability across varying sliding window sizes of 33–63 s. Consequently, a width of 17 × TR (i.e., 34 s) was chosen to maximize signal estimates while still capturing the properties of transient functional connectivity. As previous studies suggest that covariance estimation using shorter time series can be noisy, we estimated covariance from the regularized precision matrix (inverse covariance matrix) (Smith et al., 2011; Varoquaux, Gramfort, Poline, & Thirion, 2010). Furthermore, we imposed a penalty on the L1 norm of the precision matrix to promote sparsity using the graphical least absolute shrinkage and selection operator method (Friedman, Hastie, & Tibshirani, 2008). For each participant, the regularization parameter lambda was optimized by evaluating the log‐likelihood of unseen data from the same subject in a cross‐validation framework. For each participant, we obtained a total of 173 windows, each of which had (114 × 113)/2 = 6,441 unique functional connectivity measurements. Finally, Fisher r‐to‐z transformation was performed for all functional connectivity measurements. All analysis code is available here: https://github.com/lichao312214129/lc_rsfmri_tools_matlab/tree/master/Workstation/code_workstation2018_dynamicFC.
2.6. State clustering analysis
The k‐means algorithm can identify sets of time‐varying network configurations in different windows that have common features, grouping them into clusters that are more similar to each other than to configurations in other clusters. We used the Manhattan distance (L 1 distance) as a similarity measure in clustering, as it has been demonstrated to be the most effective measure for high‐dimensional data (Aggarwal, Hinneburg, & Keim, 2001). To reduce the computational demands and to diminish redundancy between windows, following a previous study (Allen et al., 2014), we first used the subject exemplars as a subset of windows with local maxima in functional connectivity variance to perform k‐means clustering with varying numbers of clusters k (2–10). The optimal number of clusters k = 3 was determined based on the Davies–Bouldin criterion as suggested by a recent work (Vergara, Salman, Abrol, Espinoza, & Calhoun, 2020). The resulting three cluster centroids were used as starting points to cluster all DFC data (610 subjects × 173 windows = 105,530 matrices) into three clusters. The final resulting cluster centroids were regarded as functional connectivity states at the group level. For each participant, each state was regarded as the median of the windowed functional connectivity with the same cluster index (i.e., 1, 2 and 3).
2.7. Statistical analysis
Group effects on dynamic connectivity were examined using one‐way analysis of covariance (ANCOVA), with age, sex and the mean FD as covariates. Regarding post hoc analyses, two‐sample t tests were performed on significant group effects identified by ANCOVA. We used the false discovery rate (FDR) to correct for multiple comparisons in both the ANCOVA and the post hoc analyses (q < .05). Shared dysconnectivity was defined as a situation in which all three patient groups had abnormal connectivity compared with the HC group.
To highlight those regions with significantly different connectivity when comparing patients with HC, we calculated the “abnormal score” for dysconnectivity. Specifically, any two brain regions that formed a dysconnectivity were assigned a weight equal to the T value of this dysconnectivity. The T value was set to 1 for shared dysconnectivity due to its binary matrix (0 indicated normal connectivity, and 1 indicated dysconnectivity). Since a brain region may be involved in many dysconnectivities, the total weight of the brain region was defined as 1‐norm of the vector of multiple single weights. Therefore, we took the total weight value as the “abnormal score.” We only calculated the “abnormal score” for State 1 because significant 4‐group differences occurred only in State 1 (please see Section 3).
In addition, we also identified unique dysconnectivity related to each disorder. A unique dysconnectivity was defined as dysconnectivity that occurs only in one disorder. Additionally, we examined the effect of patient medication on dynamic connectivity in each state (Supporting Information).
In addition, we performed temporal property analyses. Temporal properties included the mean dwell time, the fraction of time and the number of transitions. The mean dwell time is defined as the average number of consecutive windows belonging to the same state, the fraction of time is defined as the proportion of total windows belonging to one state, and the number of transitions is defined as the number of state transitions and represents the reliability of each state. Group effects on temporal properties were examined using one‐way ANCOVA, with age, sex and the mean FD as covariates. Two‐sample t tests were performed on significant group effects identified by ANCOVA, which were compared in a pairwise fashion with the HC group as the common comparison group. We used the FDR to perform multiple‐comparison correction for both the ANCOVA and post hoc analyses (q < .05). Associations between temporal properties and disease symptoms or cognitive performance were investigated by using Pearson's correlation analysis.
2.8. Validation analyses
We carried out additional validation analyses (please see Supporting Information for details). For example, we additionally chose a 20 × TR window size to validate our findings of 17 × TR (Supporting Information); we repeated the analyses for all subjects with good head motion (737 subjects). Overall, our main conclusions were not influenced.
3. RESULTS
3.1. Three DFC states
We used a sliding‐window approach to construct the dynamic connectivity network. Then, we identified three patterns of dynamic connectivity network states (State 1, State 2 and State 3) using the k‐means clustering method. State 1 was more frequent (the percentage of total occurrence was 55%) and featured relatively moderate positive and negative connectivity. States 2 and 3 were the less frequent (the percentage of total occurrence was 24 and 21%) and featured stronger positive and negative connectivity. The three states (represented by the centroids of the clusters) are shown in Figure 1. We aggregated the 17 networks into 7 major networks to better visualize the subsequent results (Figure 2).
FIGURE 1.
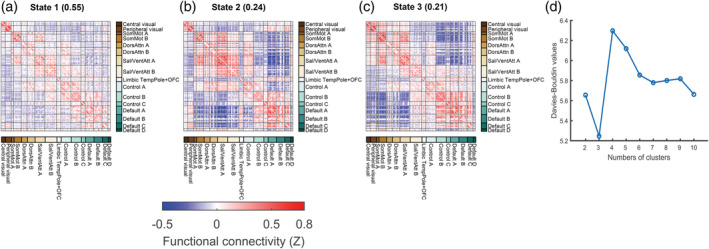
The cluster medians for each state. (a–c) The percentage of total occurrences is listed above each cluster median. The color bar represents the z value of dynamic functional connectivity. (d) Davies–Bouldin values for k‐means clustering from 2 to 10 clusters. Note that optimal clusters are minimal for Davies–Bouldin. Control, frontoparietal control; Default, default mode; DorsAttn, dorsal attention; OFC, orbitofrontal gyrus; Sal/VentAttn, salience/ventral attention; SomMot, somatomotor; TempPole, temporal pole
FIGURE 2.
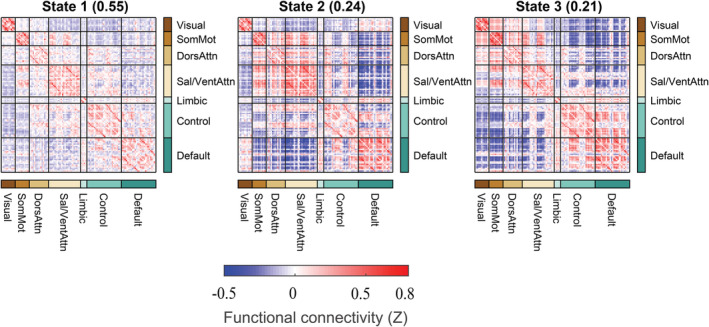
The cluster medians for each state that aggregated the 17 networks into 7 major networks. The percentage of total occurrences is listed above each cluster median. The color bar represents the z value of dynamic functional connectivity. Control, frontoparietal control; Default, default mode; DorsAttn, dorsal attention; Sal/VentAttn, salience/ventral attention; SomMot, somatomotor
3.2. Differences in DFC
Significant 4‐group differences occurred only in State 1 (Figure 3e; ANCOVA, FDR q < .05).
Post hoc analyses in each state identified significant dysconnectivity between the patient groups (i.e., SZ, BD and MDD) and the HC group (Figure 4a–c; two‐sample t test, FDR‐corrected q < .05). The effect size for the post hoc two‐sample t test among the four groups is shown in Figures S2 and S3. In general, SZ was more broad in range (Figure 4) than BD and MDD, given that the numbers of dysconnectivities were 134, 65 and 67 for SZ, BD and MDD, respectively. Furthermore, SZ was more serious in extent (please see Figure 8). To illustrate the pattern of differences at the level of the brain network, we present the average T values of the dysconnectivity within and between networks for each disorder in State 1 (Figure 5). Based on the post hoc analyses, we further identified significant dysconnectivity common to the SZ, BD, and MDD groups (Figure 4d). The shared dysconnectivity within networks presented a consistent pattern of decreased connectivity, while the shared dysconnectivity between networks presented a mixed pattern of increased and decreased connectivity. Specifically, patients shared decreased connectivity within the visual, somatomotor, salience and frontoparietal control networks. Several patterns of dysconnectivity between networks were also common to these disorders. Specifically, connectivity was increased between the visual network with the frontoparietal (State 3), salience and limbic networks and between some pairs of regions in the frontoparietal and default‐mode networks, while decreased connectivity was found between the salience and frontoparietal control, default mode and somatomotor networks, and some pairs of connectivity were found between the frontoparietal and default‐mode networks.
FIGURE 3.
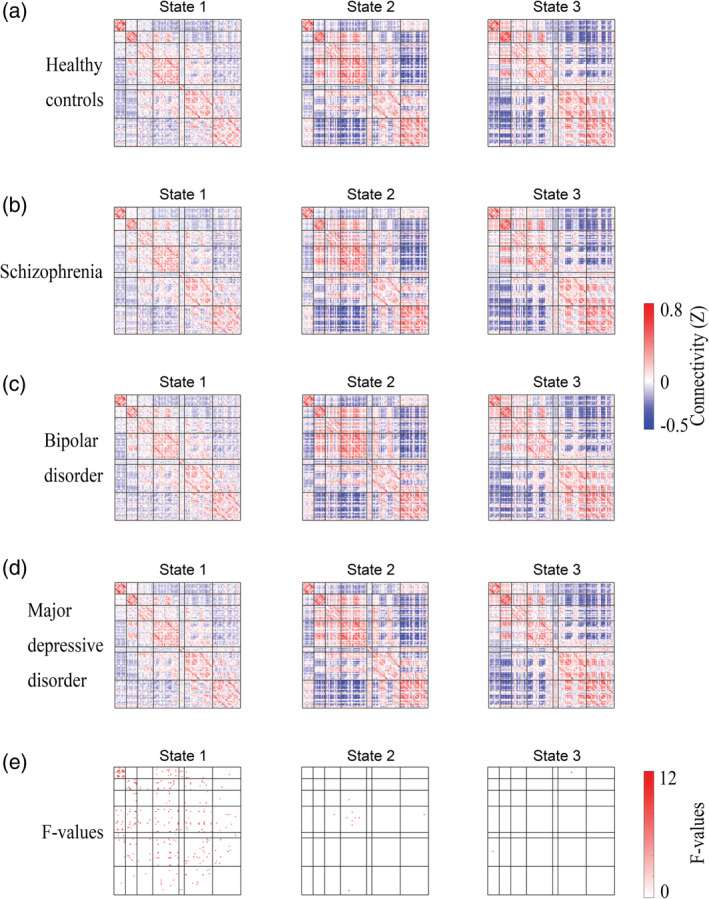
Group mean dynamic functional connectivity and significant 4‐group differences. (a–d) Group mean dynamic functional connectivity for each group. (e) Four‐group differences among schizophrenia, bipolar disorder, and major depressive disorder patients and healthy controls (analysis of covariance [ANCOVA], false‐discovery rate [FDR]‐corrected q < .05)
FIGURE 4.
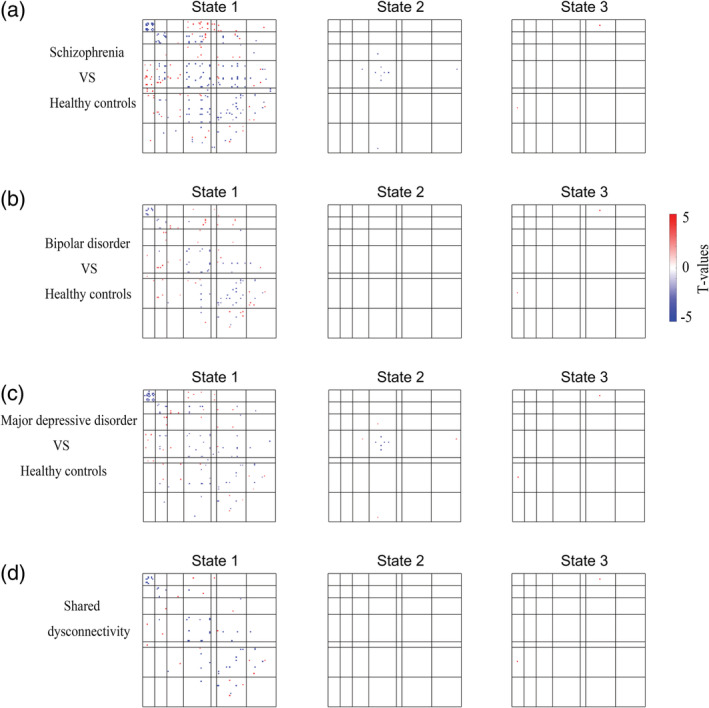
Significant differences in dynamic functional connectivity between patients and healthy controls. (a–c) Group differences between patients and healthy controls (two‐sample t test, FDR‐corrected q < .05). (d) Transdiagnostic dysconnectivity across the three disorders. The red dots indicate increased connectivity, and the blue dots indicate decreased connectivity
To highlight those regions with significantly different connectivity when comparing patients with HC, we calculated the “abnormal score” for dysconnectivity (Figure 6).
FIGURE 5.
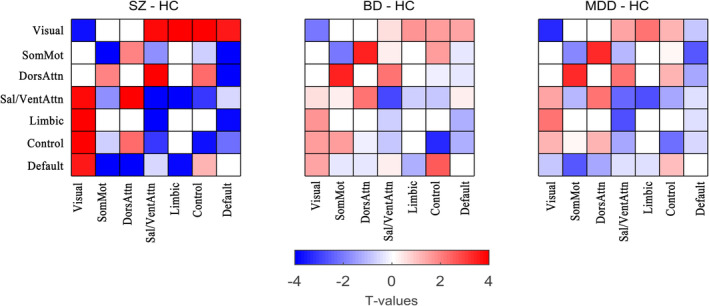
The average T values of the dysconnectivity between patients and healthy controls in State 1. BD, bipolar disorder; control, frontoparietal control; default, default mode; DorsAttn, dorsal attention; HC, healthy control; MDD, major depressive disorder; Sal/VentAttn, salience/ventral attention; SomMot, somatomotor; SZ, schizophrenia
We also identified the unique dysconnectivity for each disorder based on the post hoc analyses. Interestingly, we found that almost only patients with SZ had unique dysconnectivity and only showed in State 1 (Figure 7).
FIGURE 6.
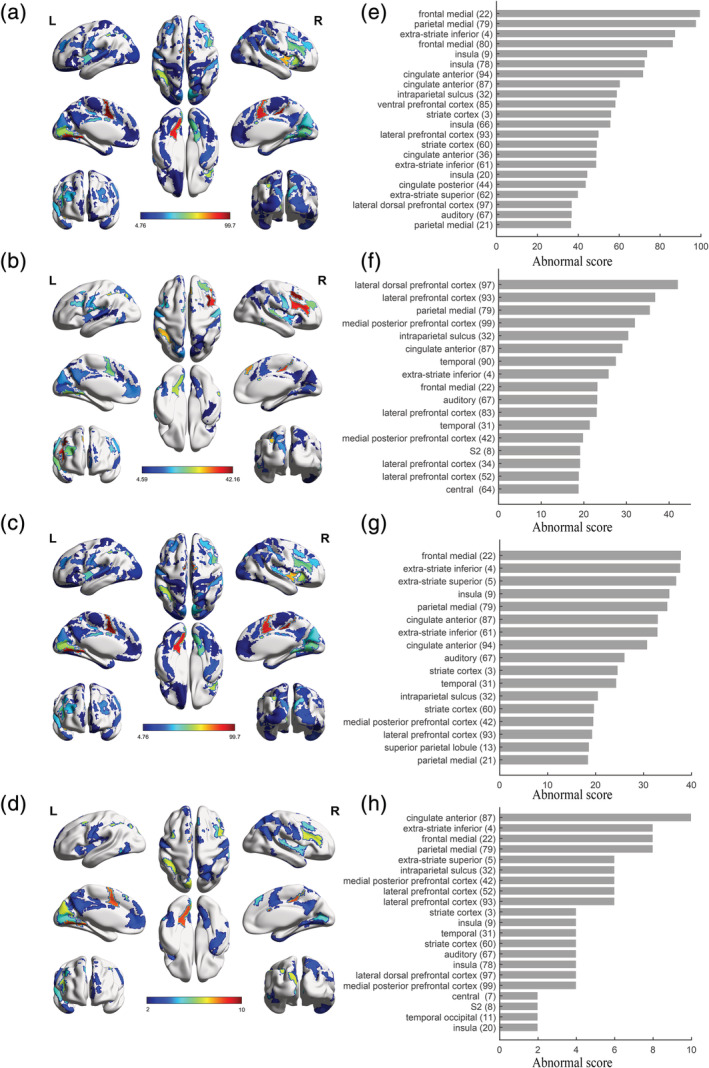
Regions with significantly different connectivity. Abnormal score maps for SZ (a), BD (b), MDD (c) and shared dysconnectivity (d). Ranking of abnormal scores for SZ (e, the top 30%), BD (f, the top 30%), MDD (g, the top 30%) and shared dysconnectivity (h, the top 50%). Showing the top ranking for better visualization. Color bars in abnormal score maps indicate abnormal scores. BD, bipolar disorder; MDD, major depressive disorder; SZ, schizophrenia
The comparison among the patients' groups showed that the SZ was the most serious in extent among the three diseases in most networks. For example, connectivity in salience network of these three disorders were decreased compared with HC (Figure 3). Meanwhile, SZ had further weaker connectivity than both BD and MDD in salience network (Figure 8a,b). Most of the other dysconnectivity were similar.
FIGURE 7.
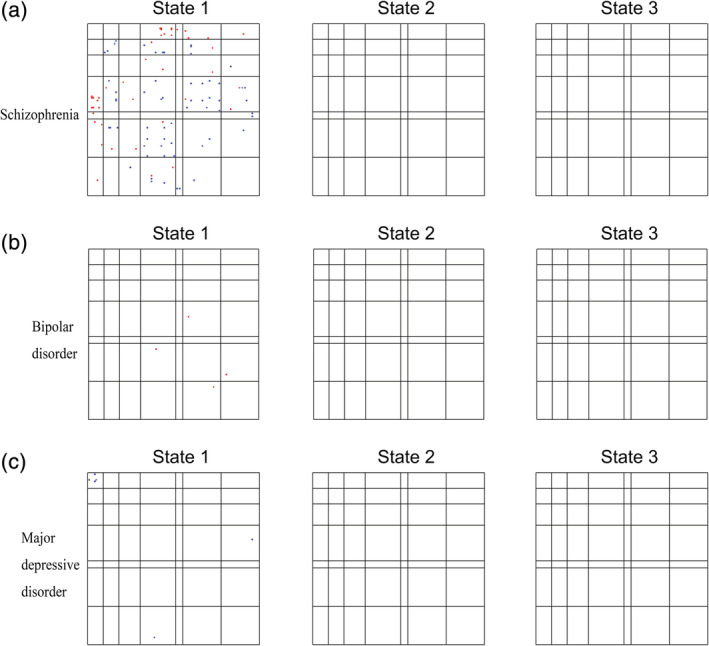
Unique dysconnectivity for each disorder. The red dots indicate increased connectivity, and the blue dots indicate decreased connectivity. Patients with schizophrenia had obviously more unique dysconnectivity than patients with bipolar and major depressive disorders, and these unique dysconnectivities were only observed in State 1
3.3. Differences in temporal properties and their correlations with disease symptoms or cognitive performance
As reported in Figure 9, significant group differences were identified in the fraction of time in State 1 and State 2. Post hoc analyses revealed that the patients with SZ and MDD showed significantly shorter fractions of time in State 1 compared with HC. Patients with SZ showed significantly longer fractions of time in State 2 compared with HC. Patients with MDD showed significantly longer fractions of time in State 2 compared with BD. Correlation analyses showed that the mean dwell time and fraction of time in State 1 and State 2 of MDD were correlated with non‐perseverative errors (Figure 9d,f; p < .05, uncorrected). The fraction of time in State 1 and State 2 of SZ were correlated with perseverative errors (Figure 9e; p < .05, uncorrected).
FIGURE 8.
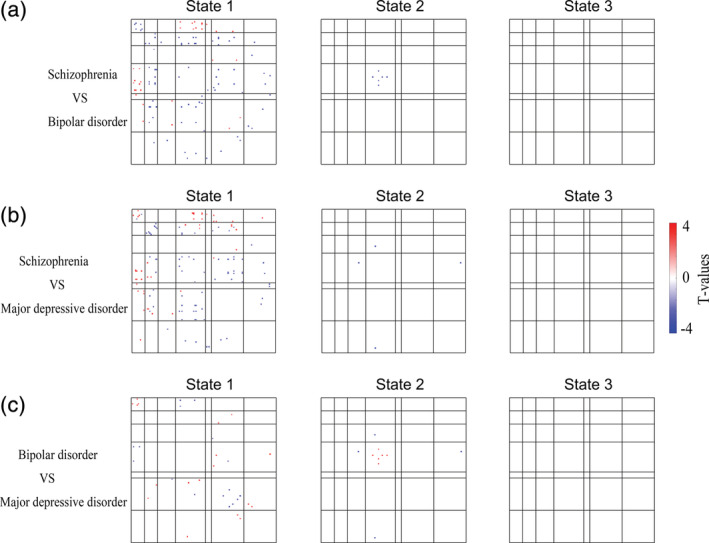
Significant differences in dynamic functional connectivity among patient groups. The comparison among the patient groups showed that schizophrenia was the most serious among the three diseases in most networks. Two‐sample t test, false‐discovery rate (FDR)‐corrected q < .05
4. DISCUSSION
The present study was the first to examine alterations of DFC in SZ, BD and MDD with a relatively large sample size at a single site. We identified three distinct functional connectivity states during resting‐state scanning across the entire group: State 1, a more frequent moderate state with weaker connectivity, and States 2 and 3, less frequent “extreme” states characterized by stronger positive and negative connectivity. However, the group differences in DFC were expressed only in State 1. Post hoc analyses identified that shared patterns of dysconnectivity were marked by consistently decreased connectivity within most networks (visual, somatomotor, salience and frontoparietal networks), which was most obvious in both range and extent for SZ. Please note that we placed greater emphasis on dysconnectivity within the visual, somatomotor, salience and between frontoparietal and default‐mode networks, given that these networks showed statistically more dysconnectivity (see Figure S15). However, our discussion tended to be descriptive for networks that did not show statistically more dysconnectivity. These findings suggest that decreased connectivity within both lower‐order (visual and somatomotor) and higher‐order (salience and frontoparietal) networks may serve as a transdiagnostic marker of SZ, BD and MDD and that such dysconnectivity is state‐dependent. This study sheds new light on the current transdiagnostic knowledge for these disorders.
FIGURE 9.
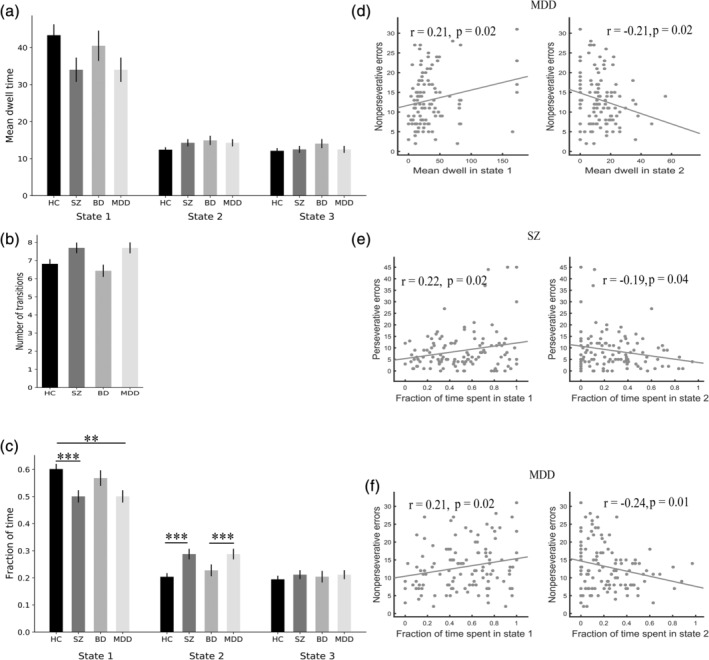
Significant 4‐group differences in temporal properties and their correlations with cognitive performance. Error bars represent the SE. ** indicates p < .01, *** indicates p < .001. BD, bipolar disorder; HC, healthy control; MDD, major depressive disorder; SZ, schizophrenia
In the present study, we also analyzed static functional connectivity (see Supporting Information). The transdiagnostic dysconnectivity in the static connectivity was consistent with that in the dynamic connectivity. However, dynamic analysis showed that dysconnectivity was state‐dependent (Damaraju et al., 2014; Rashid et al., 2014), which cannot be found via static connectivity analysis. Moreover, temporal property analyses of dynamic connectivity additionally showed that patients with SZ and MDD showed an abnormal fraction of time, which was correlated with cognitive performance.
Comparison of the findings with those of other studies (Fu et al., 2019; Kim et al., 2017; Reinen et al., 2018; Tu et al., 2019, 2020) confirms that humans spent more time in a weak connectivity state (or states) but spent less time in a strong connectivity state (or states) in a resting state. Although the underlying mechanisms of DFC states have not been fully clarified, some studies (Teng et al., 2019; Wang, Ong, Patanaik, Zhou, & Chee, 2016) that investigated the relationship between states and behavior suggest that such a weak connectivity state (State 1) is a low attentional state, but the strong connectivity states (States 2 and 3) are high attention or task‐ready states.
In the present study, SZ and MDD patients spent less time in the weak connectivity states than HC patients. SZ patients also spent more time in the strongly connectivity states compared with HC. These observations were consistent with previous findings on temporal characteristics of the DFC states in neuropsychiatric disorders (Kim et al., 2017; Reinen et al., 2018; Tu et al., 2019, 2020): patients spent less time in a weak connectivity state but spent more time in a strong connectivity state. We speculated that this phenomenon may be due to the out‐off balance of the time allotment of dynamic connectivity states in neuropsychiatric disorders, which might be an essential characteristic of neuropsychiatric disorders. Importantly, we found that the fraction of time in State 1 and State 2 of SZ and MDD were correlated with cognitive performance. Our findings support that dynamic characteristics may be a potential biomarker for neuropsychiatric disorders.
Interestingly, dysfunctional connectivity in the patients was found only in the low arousal state (State 1), a more frequent moderate state with weaker connectivity. This observation was consistent with previous studies (Rashid et al., 2014; Reinen et al., 2018). Reinen et al. (2018) found that psychosis shows the most dysconnectivity in “State A4”, a more frequent moderate state with weaker connectivity. Rashid et al. (2014) found that SZ shows the most dysconnectivity in “State 3,” still one of the most frequent states with weaker connectivity. We speculate that the reason why the dysconnectivity was largely only shown in the low attentional state while there was almost no difference in the high attentional or task‐ready states was that patients with psychiatric disorders can successfully reach the connectivity pattern of the high attentional state, but they cannot return to the pattern of the low attentional or baseline states. However, a previous study (Damaraju et al., 2014) found that most of the abnormalities of SZ are found in those “strong” states, rather than in “weak” states. We speculate that such inconsistencies may be due to the differences between transdiagnostic and nontransdiagnostic studies.
Interestingly, all shared dysconnectivity patterns within networks were consistently decreased. Specifically, we found decreased connectivity within the visual, somatomotor, salience and frontoparietal networks across these psychiatric disorders. The finding of dysconnectivity in the frontoparietal network was consistent with previous studies showing transdiagnostic disruptions in this network across multiple psychiatric disorders (Baker et al., 2014, 2019) as well as in SZ patients (Barch, Carter, MacDonald, Braver, & Cohen, 2003; MacDonald et al., 2005; Perlstein, Carter, Noll, & Cohen, 2001; Sui et al., 2018), BD patients (Anticevic et al., 2013) and MDD patients (Holmes & Pizzagalli, 2008a, 2008b; Pizzagalli, 2011). The frontoparietal network is the core hub for cognitive control, adaptive implementation of task demands and goal‐directed behavior (Cole et al., 2013; Diamond, 2013; Ptak, 2012; Zanto & Gazzaley, 2013). In addition to the frontoparietal network, we also found decreased connectivity in the salience network, another network that is important for executive function. These findings also matched those of earlier studies showing abnormalities in the salience network (Goodkind et al., 2015; Yang et al., 2019). Reduced intranetwork integration (or intranetwork modularity [van den Heuvel & Sporns, 2019]) in cognitive networks may be responsible for cognitive dysfunction, one of the most prominent transdiagnostic characteristics of psychiatric disorders (Caspi et al., 2014; Sha et al., 2019).
Although abnormalities in higher‐order brain networks such as the frontoparietal network were the dominant findings in previous studies, a recent study (Kebets et al., 2019) suggests that the focus of psychiatric neuroscience should be expanded beyond these networks to some lower‐order networks, such as the somatomotor and visual networks. The present findings of dysconnectivity within the somatomotor and visual networks corroborated earlier studies showing abnormalities in these networks in psychiatric disorders (Chang et al., 2019; Elliott et al., 2018; Xia, Womer, et al., 2018). Together, these findings suggest that intranetwork integration was decreased in patients with psychiatric disorders not only within higher‐order brain networks but also within lower‐order brain networks. Future research should direct additional attention toward lower‐order networks.
In contrast, the internetwork connectivity of patients versus HC was not consistently decreased but instead increased for some connections and decreased for others. Increased connectivity was found between the visual network and the frontoparietal, salience and limbic networks. Although dysconnectivity between the visual network and others was not often considered primary to psychopathological dysfunction in early studies, this finding was in line with that of a recent study (Elliott et al., 2018) showing that hyperconnectivity between the visual association cortex and the frontoparietal and default‐mode networks was correlated with increased p‐factor scores (a single general transdiagnostic factor associated with the risk for all common forms of mental illness). Considering that the patient groups in the present study were all psychiatric patients, our findings support and expand on that recent study, suggesting that dysconnectivity exists between the visual network and other networks not only in individuals who are at a high risk for psychiatric disorders but also in individuals who already suffer from psychiatric disorders. This shared feature represents the possibility of a trait common to multiple psychiatric disorders.
Decreased connectivity was mainly driven by dysconnectivity between the salience network and the frontoparietal network. Connectivity between the salience network and default‐mode network showed a mixed pattern of dysconnectivity with both increased and decreased connectivity. The salience, frontoparietal and default‐mode networks are the three most important high‐order cognitive networks. Many studies have indicated that the salience network plays a role in switching between the frontoparietal and default‐mode networks to improve performance on cognitively demanding tasks (Seeley et al., 2007; Sridharan, Levitin, & Menon, 2008). Abnormal communication between these networks may be one of the factors underlying cognitive impairment in psychiatric disorders. Our findings are consistent with a recent review (Sha et al., 2019) and an original work (Wang et al., 2019) that found BD and MDD showed abnormal DFC variability between default‐mode and frontoparietal networks.
Strikingly, the shared patterns of dysconnectivity across these disorders were all in the same direction, that is, they were either higher or lower than the patterns of the HC. Although speculative, this finding may support the idea that SZ, BD and MDD may lie along a transdiagnostic continuum of major endogenous psychoses (Pearlson, 2015).
Our study has several limitations. The first limitation is the choice of window size for sliding‐window analysis. In this study, we used an empirically validated fixed sliding window of 17 TRs (34 s) as suggested by previous studies (Reinen et al., 2018; Shirer et al., 2012) to maximize signal estimates while still capturing the properties of transient functional connectivity. Future work should evaluate DFC across a variety of window sizes. Second, we did not record respiratory and cardiac events or use them for denoising, which may have had an impact on our results. Third, this is a cross‐sectional study, and a longitudinal study is needed to better understand the transdiagnostic pathophysiological mechanisms for these psychiatric disorders. Fourth, to explore the biological significance of different states, we need to combine electrophysiological methods such as electroencephalogram to study dynamic connectivity (Stevner et al., 2019). Fifth, spatial group independent component analysis (ICA) (Calhoun & Adali, 2012) is a very important data‐driven method to extract brain networks, and future studies should try to use ICA to define nodes in DFC networks. Finally, our study should investigate socioeconomic status to ensure that this factor is not a major confounder since brain connectivity is also associated with poverty and adversity (Sripada, Swain, Evans, Welsh, & Liberzon, 2014).
In conclusion, to our knowledge, we performed the first time‐varying functional connectivity analyses in HC and SZ, BD and MDD patients in a single study with a relatively large sample size. Functional connectivity disruptions in psychosis were state‐specific and intermittent. The patterns of shared dysconnectivity were marked by consistently decreased connectivity within both higher‐order and lower‐order brain networks, while a mixed pattern of increased and decreased connectivity was observed between distributed networks. Our findings expand the current understanding of the transdiagnostic pathophysiological mechanisms for these three psychiatric disorders.
CONFLICT OF INTEREST
The authors declare no conflict of interest.
Supporting information
Appendix S1 Supporting Information.
ACKNOWLEDGMENTS
This work was supported by National Key R&D Program of China (Grant 2018YFC1311600 and 2016YFC1306900 to Yanqing Tang), Liaoning Revitalization Talents Program (Grant XLYC1808036 to Yanqing Tang), Science and Technology Plan Program of Liaoning Province (2015225018 to Yanqing Tang), National Science Fund for Distinguished Young Scholars (81725005 to Fei Wang), Liaoning Education Foundation (Pandeng Scholar to Fei Wang), Innovation Team Support Plan of Higher Education of Liaoning Province (LT2017007 to Fei Wang), Major Special Construction Plan of China Medical University (3110117059 and 3110118055 to Fei Wang).
Li C, Dong M, Womer FY, et al. Transdiagnostic time‐varying dysconnectivity across major psychiatric disorders. Hum Brain Mapp. 2021;42:1182–1196. 10.1002/hbm.25285
Chao Li and Mengshi Dong contributed equally to this study.
Funding information Innovation Team Support Plan of Higher Education of Liaoning Province, Grant/Award Number: LT2017007; Liaoning Education Foundation (Pandeng Scholar); Liaoning Revitalization Talents Program, Grant/Award Number: XLYC1808036; Major Special Construction Plan of China Medical University, Grant/Award Numbers: 3110117059, 3110118055; National Key R&D Program of China, Grant/Award Numbers: 2018YFC1311600, 2016YFC1306900; National Science Fund for Distinguished Young Scholars, Grant/Award Number: 81725005; Science and Technology Plan Program of Liaoning Province, Grant/Award Number: 2015225018
DATA AVAILABILITY STATEMENT
The data that support the findings of this study are available on request from the corresponding author. The data are not publicly available due to privacy or ethical restrictions.
REFERENCES
- Aggarwal, C. C. , Hinneburg, A. , & Keim, D. A. (2001). On the surprising behavior of distance metrics in high dimensional space (pp. 420–434). Berlin, Heidelberg: Springer. [Google Scholar]
- Allen, E. A. , Damaraju, E. , Plis, S. M. , Erhardt, E. B. , Eichele, T. , & Calhoun, V. D. (2014). Tracking whole‐brain connectivity dynamics in the resting state. Cerebral Cortex, 24, 663–676. [DOI] [PMC free article] [PubMed] [Google Scholar]
- Anticevic, A. , Cole, M. W. , Repovs, G. , Murray, J. D. , Brumbaugh, M. S. , Winkler, A. M. , … Glahn, D. C. (2013). Characterizing thalamo‐cortical disturbances in schizophrenia and bipolar illness. Cerebral Cortex, 24, 3116–3130. [DOI] [PMC free article] [PubMed] [Google Scholar]
- Baker, J. T. , Dillon, D. G. , Patrick, L. M. , Roffman, J. L. , Brady, R. O. , Pizzagalli, D. A. , … Holmes, A. J. (2019). Functional connectomics of affective and psychotic pathology. Proceedings of the National Academy of Sciences of the United States of America, 116, 9050–9059. [DOI] [PMC free article] [PubMed] [Google Scholar]
- Baker, J. T. , Holmes, A. J. , Masters, G. A. , Yeo, B. T. , Krienen, F. , Buckner, R. L. , & Ongur, D. (2014). Disruption of cortical association networks in schizophrenia and psychotic bipolar disorder. JAMA Psychiatry, 71, 109–118. [DOI] [PMC free article] [PubMed] [Google Scholar]
- Barch, D. M. , Carter, C. S. , MacDonald, A. W., III , Braver, T. S. , & Cohen, J. D. (2003). Context‐processing deficits in schizophrenia: Diagnostic specificity, 4‐week course, and relationships to clinical symptoms. Journal of Abnormal Psychology, 112, 132–143. [PubMed] [Google Scholar]
- Barch, D. M. , & Sheffield, J. M. (2014). Cognitive impairments in psychotic disorders: Common mechanisms and measurement. World Psychiatry, 13, 224–232. [DOI] [PMC free article] [PubMed] [Google Scholar]
- Brandl, F. , Avram, M. , Weise, B. , Shang, J. , Simões, B. , Bertram, T. , … Bäuml, J. (2019). Specific substantial dysconnectivity in schizophrenia: A transdiagnostic multimodal meta‐analysis of resting‐state functional and structural magnetic resonance imaging studies. Biological Psychiatry, 85, 573–583. [DOI] [PubMed] [Google Scholar]
- Calhoun, V. D. , & Adali, T. (2012). Multisubject independent component analysis of fMRI: A decade of intrinsic networks, default mode, and neurodiagnostic discovery. IEEE Reviews in Biomedical Engineering, 5, 60–73. [DOI] [PMC free article] [PubMed] [Google Scholar]
- Calhoun, V. D. , Adali, T. , Pearlson, G. D. , & Pekar, J. J. (2001). A method for making group inferences from functional MRI data using independent component analysis. Human Brain Mapping, 14, 140–151. [DOI] [PMC free article] [PubMed] [Google Scholar]
- Calhoun, V. D. , Miller, R. , Pearlson, G. , & Adalı, T. (2014). The chronnectome: Time‐varying connectivity networks as the next frontier in fMRI data discovery. Neuron, 84, 262–274. [DOI] [PMC free article] [PubMed] [Google Scholar]
- Caspi, A. , Houts, R. M. , Belsky, D. W. , Goldman‐Mellor, S. J. , Harrington, H. , Israel, S. , … Poulton, R. (2014). The p factor: One general psychopathology factor in the structure of psychiatric disorders? Clinical Psychological Science, 2, 119–137. [DOI] [PMC free article] [PubMed] [Google Scholar]
- Chang, M. , Edmiston, E. K. , Womer, F. Y. , Zhou, Q. , Wei, S. , Jiang, X. , … Zuo, X.‐N. (2019). Spontaneous low‐frequency fluctuations in the neural system for emotional perception in major psychiatric disorders: Amplitude similarities and differences across frequency bands. Journal of Psychiatry & Neuroscience: JPN, 44, 132–141. [DOI] [PMC free article] [PubMed] [Google Scholar]
- Chang, M. , Womer, F. Y. , Edmiston, E. K. , Bai, C. , Zhou, Q. , Jiang, X. , … Huang, H. (2017). Neurobiological commonalities and distinctions among three major psychiatric diagnostic categories: A structural MRI study. Schizophrenia Bulletin, 44, 65–74. [DOI] [PMC free article] [PubMed] [Google Scholar]
- Cole, M. W. , Reynolds, J. R. , Power, J. D. , Repovs, G. , Anticevic, A. , & Braver, T. S. (2013). Multi‐task connectivity reveals flexible hubs for adaptive task control. Nature Neuroscience, 16, 1348–1355. [DOI] [PMC free article] [PubMed] [Google Scholar]
- Cross‐Disorder Group of the Psychiatric Genomics Consortium . (2013). Identification of risk loci with shared effects on five major psychiatric disorders: A genome‐wide analysis. The Lancet, 381, 1371–1379. [DOI] [PMC free article] [PubMed] [Google Scholar]
- Cuthbert, B. N. , & Insel, T. R. (2013). Toward the future of psychiatric diagnosis: The seven pillars of RDoC. BMC Medicine, 11, 126. [DOI] [PMC free article] [PubMed] [Google Scholar]
- Damaraju, E. , Allen, E. A. , Belger, A. , Ford, J. M. , McEwen, S. , Mathalon, D. , … Preda, A. (2014). Dynamic functional connectivity analysis reveals transient states of dysconnectivity in schizophrenia. NeuroImage: Clinical, 5, 298–308. [DOI] [PMC free article] [PubMed] [Google Scholar]
- Diamond, A. (2013). Executive functions. Annual Review of Psychology, 64, 135–168. [DOI] [PMC free article] [PubMed] [Google Scholar]
- Elliott, M. L. , Romer, A. , Knodt, A. R. , & Hariri, A. R. (2018). A connectome‐wide functional signature of transdiagnostic risk for mental illness. Biological Psychiatry, 84, 452–459. [DOI] [PMC free article] [PubMed] [Google Scholar]
- Erhardt, E. B. , Rachakonda, S. , Bedrick, E. J. , Allen, E. A. , Adali, T. , & Calhoun, V. D. (2011). Comparison of multi‐subject ICA methods for analysis of fMRI data. Human Brain Mapping, 32, 2075–2095. [DOI] [PMC free article] [PubMed] [Google Scholar]
- Friedman, J. , Hastie, T. , & Tibshirani, R. (2008). Sparse inverse covariance estimation with the graphical lasso. Biostatistics, 9, 432–441. [DOI] [PMC free article] [PubMed] [Google Scholar]
- Fu, Z. , Caprihan, A. , Chen, J. , Du, Y. , Adair, J. C. , Sui, J. , … Calhoun, V. D. (2019). Altered static and dynamic functional network connectivity in Alzheimer's disease and subcortical ischemic vascular disease: Shared and specific brain connectivity abnormalities. Human Brain Mapping, 40, 3203–3221. [DOI] [PMC free article] [PubMed] [Google Scholar]
- Gong, Q. , Scarpazza, C. , Dai, J. , He, M. , Xu, X. , Shi, Y. , … Ai, Y. (2019). A transdiagnostic neuroanatomical signature of psychiatric illness. Neuropsychopharmacology, 44, 869–875. [DOI] [PMC free article] [PubMed] [Google Scholar]
- Goodkind, M. , Eickhoff, S. B. , Oathes, D. J. , Jiang, Y. , Chang, A. , Jones‐Hagata, L. B. , … Korgaonkar, M. S. (2015). Identification of a common neurobiological substrate for mental illness. JAMA Psychiatry, 72, 305–315. [DOI] [PMC free article] [PubMed] [Google Scholar]
- Han, S. , He, Z. , Duan, X. , Tang, Q. , Chen, Y. , Yang, Y. , … Chen, H. (2019). Dysfunctional connectivity between raphe nucleus and subcortical regions presented opposite differences in bipolar disorder and major depressive disorder. Progress in Neuro‐Psychopharmacology and Biological Psychiatry, 92, 76–82. [DOI] [PubMed] [Google Scholar]
- Holmes, A. J. , & Pizzagalli, D. A. (2008a). Response conflict and frontocingulate dysfunction in unmedicated participants with major depression. Neuropsychologia, 46, 2904–2913. [DOI] [PMC free article] [PubMed] [Google Scholar]
- Holmes, A. J. , & Pizzagalli, D. A. (2008b). Spatiotemporal dynamics of error processing dysfunctions in major depressive disorder. Archives of General Psychiatry, 65, 179–188. [DOI] [PMC free article] [PubMed] [Google Scholar]
- Husain, M. (2017). Transdiagnostic neurology: Neuropsychiatric symptoms in neurodegenerative diseases. Brain, 140, 1535–1536. [DOI] [PubMed] [Google Scholar]
- Hutchison, R. M. , Womelsdorf, T. , Allen, E. A. , Bandettini, P. A. , Calhoun, V. D. , Corbetta, M. , … Gonzalez‐Castillo, J. (2013). Dynamic functional connectivity: Promise, issues, and interpretations. NeuroImage, 80, 360–378. [DOI] [PMC free article] [PubMed] [Google Scholar]
- Insel, T. R. , & Cuthbert, B. N. (2015). Brain disorders? Precisely. Science, 348, 499–500. [DOI] [PubMed] [Google Scholar]
- Kebets, V. , Holmes, A. J. , Orban, C. , Tang, S. , Li, J. , Sun, N. , … Yeo, B. T. (2019). Somatosensory‐motor dysconnectivity spans multiple transdiagnostic dimensions of psychopathology. Biological Psychiatry, 86, 779–791. [DOI] [PubMed] [Google Scholar]
- Kessler, R. C. , Chiu, W. T. , Demler, O. , & Walters, E. E. (2005). Prevalence, severity, and comorbidity of 12‐month DSM‐IV disorders in the National Comorbidity Survey Replication. Archives of General Psychiatry, 62, 617–627. [DOI] [PMC free article] [PubMed] [Google Scholar]
- Kim, J. , Criaud, M. , Cho, S. S. , Díez‐Cirarda, M. , Mihaescu, A. , Coakeley, S. , … Strafella, A. P. (2017). Abnormal intrinsic brain functional network dynamics in Parkinson's disease. Brain, 140, 2955–2967. [DOI] [PMC free article] [PubMed] [Google Scholar]
- Lahey, B. B. , Zald, D. H. , Hakes, J. K. , Krueger, R. F. , & Rathouz, P. J. (2014). Patterns of heterotypic continuity associated with the cross‐sectional correlational structure of prevalent mental disorders in adults. JAMA Psychiatry, 71, 989–996. [DOI] [PMC free article] [PubMed] [Google Scholar]
- Lee, R. , Hermens, D. , Naismith, S. , Lagopoulos, J. , Jones, A. , Scott, J. , … Scott, E. (2015). Neuropsychological and functional outcomes in recent‐onset major depression, bipolar disorder and schizophrenia‐spectrum disorders: A longitudinal cohort study. Translational Psychiatry, 5, e555. [DOI] [PMC free article] [PubMed] [Google Scholar]
- Lee, S. H. , Ripke, S. , Neale, B. M. , Faraone, S. V. , Purcell, S. M. , Perlis, R. H. , … Witte, J. S. (2013). Genetic relationship between five psychiatric disorders estimated from genome‐wide SNPs. Nature Genetics, 45, 984. [DOI] [PMC free article] [PubMed] [Google Scholar]
- Levit‐Binnun, N. , Davidovitch, M. , & Golland, Y. (2013). Sensory and motor secondary symptoms as indicators of brain vulnerability. Journal of Neurodevelopmental Disorders, 5, 26. [DOI] [PMC free article] [PubMed] [Google Scholar]
- Liao, X. , Cao, M. , Xia, M. , & He, Y. (2017). Individual differences and time‐varying features of modular brain architecture. NeuroImage, 152, 94–107. [DOI] [PubMed] [Google Scholar]
- Liu, J. , Liao, X. , Xia, M. , & He, Y. (2018). Chronnectome fingerprinting: Identifying individuals and predicting higher cognitive functions using dynamic brain connectivity patterns. Human Brain Mapping, 39, 902–915. [DOI] [PMC free article] [PubMed] [Google Scholar]
- MacDonald, A. W., III , Carter, C. S. , Kerns, J. G. , Ursu, S. , Barch, D. M. , Holmes, A. J. , … Cohen, J. D. (2005). Specificity of prefrontal dysfunction and context processing deficits to schizophrenia in never‐medicated patients with first‐episode psychosis. American Journal of Psychiatry, 162, 475–484. [DOI] [PubMed] [Google Scholar]
- McTeague, L. M. , Huemer, J. , Carreon, D. M. , Jiang, Y. , Eickhoff, S. B. , & Etkin, A. (2017). Identification of common neural circuit disruptions in cognitive control across psychiatric disorders. American Journal of Psychiatry, 174, 676–685. [DOI] [PMC free article] [PubMed] [Google Scholar]
- Nolen‐Hoeksema, S. , & Watkins, E. R. (2011). A heuristic for developing transdiagnostic models of psychopathology: Explaining multifinality and divergent trajectories. Perspectives on Psychological Science, 6, 589–609. [DOI] [PubMed] [Google Scholar]
- Pang, Y. , Chen, H. , Wang, Y. , Long, Z. , He, Z. , Zhang, H. , … Chen, H. (2018). Transdiagnostic and diagnosis‐specific dynamic functional connectivity anchored in the right anterior insula in major depressive disorder and bipolar depression. Progress in Neuro‐Psychopharmacology & Biological Psychiatry, 85, 7–15. [DOI] [PubMed] [Google Scholar]
- Pearlson, G. D. (2015). Etiologic, phenomenologic, and endophenotypic overlap of schizophrenia and bipolar disorder. Annual Review of Clinical Psychology, 11, 251–281. [DOI] [PubMed] [Google Scholar]
- Perlstein, W. M. , Carter, C. S. , Noll, D. C. , & Cohen, J. D. (2001). Relation of prefrontal cortex dysfunction to working memory and symptoms in schizophrenia. American Journal of Psychiatry, 158, 1105–1113. [DOI] [PubMed] [Google Scholar]
- Pizzagalli, D. A. (2011). Frontocingulate dysfunction in depression: Toward biomarkers of treatment response. Neuropsychopharmacology, 36, 183–206. [DOI] [PMC free article] [PubMed] [Google Scholar]
- Ptak, R. (2012). The frontoparietal attention network of the human brain: Action, saliency, and a priority map of the environment. The Neuroscientist, 18, 502–515. [DOI] [PubMed] [Google Scholar]
- Rashid, B. , Damaraju, E. , Pearlson, G. D. , & Calhoun, V. D. (2014). Dynamic connectivity states estimated from resting fMRI identify differences among schizophrenia, bipolar disorder, and healthy control subjects. Frontiers in Human Neuroscience, 8, 897. [DOI] [PMC free article] [PubMed] [Google Scholar]
- Reinen, J. M. , Chen, O. Y. , Hutchison, R. M. , Yeo, B. T. T. , Anderson, K. M. , Sabuncu, M. R. , … Holmes, A. J. (2018). The human cortex possesses a reconfigurable dynamic network architecture that is disrupted in psychosis. Nature Communications, 9, 1157. [DOI] [PMC free article] [PubMed] [Google Scholar]
- Seeley, W. W. , Menon, V. , Schatzberg, A. F. , Keller, J. , Glover, G. H. , Kenna, H. , … Greicius, M. D. (2007). Dissociable intrinsic connectivity networks for salience processing and executive control. Journal of Neuroscience, 27, 2349–2356. [DOI] [PMC free article] [PubMed] [Google Scholar]
- Sha, Z. , Wager, T. D. , Mechelli, A. , & He, Y. (2019). Common dysfunction of large‐scale neurocognitive networks across psychiatric disorders. Biological Psychiatry, 85, 379–388. [DOI] [PubMed] [Google Scholar]
- Shirer, W. R. , Ryali, S. , Rykhlevskaia, E. , Menon, V. , & Greicius, M. D. (2012). Decoding subject‐driven cognitive states with whole‐brain connectivity patterns. Cerebral Cortex, 22, 158–165. [DOI] [PMC free article] [PubMed] [Google Scholar]
- Singh, I. , & Rose, N. (2009). Biomarkers in psychiatry. Nature, 460, 202–207. [DOI] [PubMed] [Google Scholar]
- Smith, S. M. , Miller, K. L. , Salimi‐Khorshidi, G. , Webster, M. , Beckmann, C. F. , Nichols, T. E. , … Woolrich, M. W. (2011). Network modelling methods for FMRI. NeuroImage, 54, 875–891. [DOI] [PubMed] [Google Scholar]
- Sridharan, D. , Levitin, D. J. , & Menon, V. (2008). A critical role for the right fronto‐insular cortex in switching between central‐executive and default‐mode networks. Proceedings of the National Academy of Sciences of the United States of America, 105, 12569–12574. [DOI] [PMC free article] [PubMed] [Google Scholar]
- Sripada, R. K. , Swain, J. E. , Evans, G. W. , Welsh, R. C. , & Liberzon, I. (2014). Childhood poverty and stress reactivity are associated with aberrant functional connectivity in default mode network. Neuropsychopharmacology, 39, 2244–2251. [DOI] [PMC free article] [PubMed] [Google Scholar]
- Stevner, A. , Vidaurre, D. , Cabral, J. , Rapuano, K. , Nielsen, S. F. V. , Tagliazucchi, E. , … Woolrich, M. (2019). Discovery of key whole‐brain transitions and dynamics during human wakefulness and non‐REM sleep. Nature Communications, 10, 1–14. [DOI] [PMC free article] [PubMed] [Google Scholar]
- Sui, J. , Qi, S. , van Erp, T. G. M. , Bustillo, J. , Jiang, R. , Lin, D. , … Calhoun, V. D. (2018). Multimodal neuromarkers in schizophrenia via cognition‐guided MRI fusion. Nature Communications, 9, 3028. [DOI] [PMC free article] [PubMed] [Google Scholar]
- Teng, J. , Ong, J. L. , Patanaik, A. , Tandi, J. , Zhou, J. H. , Chee, M. W. , & Lim, J. (2019). Vigilance declines following sleep deprivation are associated with two previously identified dynamic connectivity states. NeuroImage, 200, 382–390. [DOI] [PubMed] [Google Scholar]
- Tu, Y. , Fu, Z. , Mao, C. , Falahpour, M. , Gollub, R. L. , Park, J. , … Kong, J. (2020). Distinct thalamocortical network dynamics are associated with the pathophysiology of chronic low back pain. Nature Communications, 11, 3948. [DOI] [PMC free article] [PubMed] [Google Scholar]
- Tu, Y. , Fu, Z. , Zeng, F. , Maleki, N. , Lan, L. , Li, Z. , … Kong, J. (2019). Abnormal thalamocortical network dynamics in migraine. Neurology, 92, e2706–e2716. [DOI] [PMC free article] [PubMed] [Google Scholar]
- van den Heuvel, M. P. , & Sporns, O. (2019). A cross‐disorder connectome landscape of brain dysconnectivity. Nature Reviews Neuroscience, 1, 435–446. [DOI] [PMC free article] [PubMed] [Google Scholar]
- Van Dijk, K. R. , Sabuncu, M. R. , & Buckner, R. L. (2012). The influence of head motion on intrinsic functional connectivity MRI. NeuroImage, 59, 431–438. [DOI] [PMC free article] [PubMed] [Google Scholar]
- Varoquaux, G. , Gramfort, A. , Poline, J.‐B. , & Thirion, B. (2010). Brain covariance selection: Better individual functional connectivity models using population prior. arXiv:1008.5071, 2334–2342.
- Vergara, V. M. , Salman, M. S. , Abrol, A. , Espinoza, F. A. , & Calhoun, V. D. (2020). Determining the number of states in dynamic functional connectivity using cluster validity indexes. Journal of Neuroscience Methods, 337, 108651. [DOI] [PMC free article] [PubMed] [Google Scholar]
- Wang, C. , Ong, J. L. , Patanaik, A. , Zhou, J. , & Chee, M. W. (2016). Spontaneous eyelid closures link vigilance fluctuation with fMRI dynamic connectivity states. Proceedings of the National Academy of Sciences of the United States of America, 113, 9653–9658. [DOI] [PMC free article] [PubMed] [Google Scholar]
- Wang, J. , Wang, Y. , Huang, H. , Jia, Y. , Zheng, S. , Zhong, S. , … Huang, R. (2019). Abnormal dynamic functional network connectivity in unmedicated bipolar and major depressive disorders based on the triple‐network model. Psychological Medicine, 50, 1–10. [DOI] [PubMed] [Google Scholar]
- Wei, Y. , Chang, M. , Womer, F. Y. , Zhou, Q. , Yin, Z. , Wei, S. , … Duan, J. (2018). Local functional connectivity alterations in schizophrenia, bipolar disorder, and major depressive disorder. Journal of Affective Disorders, 236, 266–273. [DOI] [PubMed] [Google Scholar]
- Wise, T. , Radua, J. , Via, E. , Cardoner, N. , Abe, O. , Adams, T. , … Périco, C.d. A. M. (2017). Common and distinct patterns of grey‐matter volume alteration in major depression and bipolar disorder: Evidence from voxel‐based meta‐analysis. Molecular Psychiatry, 22, 1455–1463. [DOI] [PMC free article] [PubMed] [Google Scholar]
- Xia, C. H. , Ma, Z. , Ciric, R. , Gu, S. , Betzel, R. F. , Kaczkurkin, A. N. , … Vandekar, S. N. (2018). Linked dimensions of psychopathology and connectivity in functional brain networks. Nature Communications, 9, 3003. [DOI] [PMC free article] [PubMed] [Google Scholar]
- Xia, M. , Womer, F. Y. , Chang, M. , Zhu, Y. , Zhou, Q. , Edmiston, E. K. , … Xu, K. (2018). Shared and distinct functional architectures of brain networks across psychiatric disorders. Schizophrenia Bulletin, 45, 450–463. [DOI] [PMC free article] [PubMed] [Google Scholar]
- Yan, C. G. , Wang, X. D. , Zuo, X. N. , & Zang, Y. F. (2016). DPABI: Data processing & analysis for (resting‐state) brain imaging. Neuroinformatics, 14, 339–351. [DOI] [PubMed] [Google Scholar]
- Yang, Y. , Liu, S. , Jiang, X. , Yu, H. , Ding, S. , Lu, Y. , … Cui, Y. (2019). Common and specific functional activity features in schizophrenia, major depressive disorder, and bipolar disorder. Frontiers in Psychiatry, 10, 52. [DOI] [PMC free article] [PubMed] [Google Scholar]
- Yeo, B. T. , Krienen, F. M. , Sepulcre, J. , Sabuncu, M. R. , Lashkari, D. , Hollinshead, M. , … Buckner, R. L. (2011). The organization of the human cerebral cortex estimated by intrinsic functional connectivity. Journal of Neurophysiology, 106, 1125–1165. [DOI] [PMC free article] [PubMed] [Google Scholar]
- Zanto, T. P. , & Gazzaley, A. (2013). Fronto‐parietal network: Flexible hub of cognitive control. Trends in Cognitive Sciences, 17, 602–603. [DOI] [PMC free article] [PubMed] [Google Scholar]
- Zeng, L. , Shen, H. , Liu, L. , & Hu, D. (2014). Unsupervised classification of major depression using functional connectivity MRI. Human Brain Mapping, 35, 1630–1641. [DOI] [PMC free article] [PubMed] [Google Scholar]
Associated Data
This section collects any data citations, data availability statements, or supplementary materials included in this article.
Supplementary Materials
Appendix S1 Supporting Information.
Data Availability Statement
The data that support the findings of this study are available on request from the corresponding author. The data are not publicly available due to privacy or ethical restrictions.


