

Abstract
Activating transcription factor 3 (ATF3) is known to have an anti-inflammatory function, yet the role of hepatic ATF3 in lipoprotein metabolism or atherosclerosis remains unknown. Here we show that over-expression of human ATF3 in hepatocytes reduces the development of atherosclerosis in Western diet-fed Ldlr−/− or Apoe−/− mice, whereas hepatocyte-specific ablation of Atf3 has the opposite effect. We further show that hepatic ATF3 expression is inhibited by hydrocortisone. Mechanistically, hepatocyte ATF3 enhances HDL uptake, inhibits intestinal fat and cholesterol absorption, and promotes macrophage reverse cholesterol transport by inducing scavenger receptor group B type 1 (SR-BI) and repressing cholesterol 12α-hydroxylase (CYP8B1) in the liver through its interaction with p53 and hepatocyte nuclear factor 4α, respectively. Our data demonstrate that hepatocyte ATF3 is a key regulator of HDL and bile acid metabolism and atherosclerosis.
Keywords: Atherosclerosis, stress, ATF3, HDL, bile acid, SR-BI, CYP8B1, reverse cholesterol transport, p53, HNF4α
Introduction
Atherosclerosis is the leading cause of coronary heart disease, stroke and peripheral vascular diseases. The common risk factors for atherosclerosis include dyslipidemia, hypertension, diabetes and obesity. The liver plays a key role in regulating plasma lipoprotein metabolism by secreting very low-density lipoprotein (VLDL) and up-taking high-density lipoprotein (HDL), low-density lipoprotein (LDL) and chylomicron remnants. Among the hepatic lipoprotein receptors, scavenger receptor group B type 1 (SR-BI) has been established as a critical regulator of HDL metabolism, macrophage reverse cholesterol transport (RCT) and atherosclerosis 1. Macrophage RCT protects against atherosclerosis by delivering excessive cholesterol from macrophages to the liver and feces 2,3. Over-expression of hepatic SR-BI promotes macrophage RCT and protects against atherogenesis whereas loss of hepatic SR-BI has opposite effects 4–6. Importantly, loss-of-function mutations in human SR-BI is reported to increase plasma HDL-C levels and the risk of coronary heart disease (CHD) 7.
In the liver, free cholesterol may be converted to bile acids (BAs) or excreted to bile directly. Cholesterol 7α-hydroxylase (CYP7A1) catalyzes the first and rate-limiting step of the classic pathway of BA biosynthesis. Sterol 12α-hydroxylase (CYP8B1) is the key enzyme for biosynthesis of cholic acid. After BAs are synthesized and secreted to the intestine, 95% of BAs are reabsorbed and feedback inhibit both CYP7A1 and CYP8B1 expression to prevent BA overproduction in the liver. Cyp8b1−/− mice fail to produce cholic acid and other 12α-hydroxylated BAs, resulting in increased CYP7A1 expression and increased BA pool size 8. Cyp8b1−/− mice 9 or mice over-expressing hepatic CYP7A1 10 are resistant to diet-induced atherosclerosis likely by inducing cholesterol conversion to BAs in the liver and reducing cholesterol absorption in the intestine.
Activating transcription factor 3 (ATF3) is a member of the ATF/cAMP response element-binding (ATF/CREB) family of transcription factors. ATF3 binds to the consensus sequence TGACGTCA in gene promoters to regulate gene expression 11,12. Humans and mice share 95% identity in ATF3 amino acids. ATF3 is induced by lipopolysaccharide (LPS) and is a negative regulator of toll-like receptor 4 (TLR4) and other TLR signaling in macrophages, thus suppressing inflammatory genes and preventing immune system from overreacting 13,14. In addition, ATF3 is shown to mediate the anti-inflammatory effects of HDL in macrophages 15. Although the role of ATF3 in inflammation is well understood, nothing is known about the role of hepatic ATF3 in regulating BA homeostasis, lipoprotein metabolism or atherosclerosis.
Chronic stress is an independent risk factor for atherosclerosis 16–19, but the underlying mechanism is not well understood. Chronic stress may cause elevations of plasma LDL-C and triglycerides 20–23, platelet activation 18, as well as endothelial inflammation and dysfunction 16. Recent studies show that chronic stress may also induce monocytosis and neutrophilia in humans by activating hematopoietic stem cells 24. In response to acute or chronic stress, the hypothalamic-pituitary-adrenal (HPA) axis is activated to release cortisol and some other hormones 25. Elevated plasma or salivary cortisol levels are associated with increased incidence of CHD 26–29. In line with the latter finding, inhibition of cortisol synthesis prevents the development of atherosclerosis in mice 30. Interestingly, patients with adrenal insufficiency is associated with reduced plasma HDL-C levels 31,32 whereas treatment of such patients with hydrocortisone (HC) dose-dependently increases plasma HDL-C levels 33–36. So far, it is unclear how cortisol elevates plasma HDL-C levels and whether the elevated plasma HDL-C levels contribute to cortisol-induced CHD.
In this report, we investigated whether hydrocortisone affected hepatic ATF3 expression. We also determined whether and how hepatocyte ATF3 regulated bile acid and HDL metabolism and atherosclerosis. Our data indicate that hepatocyte ATF3 is an important regulator of HDL and bile acid metabolism and atherosclerosis, and suggest that hepatic ATF3 may be targeted for the treatment of CHD.
Results
Hydrocortisone represses hepatic ATF3 expression via activation of the cAMP-PKA pathway
In response to acute or chronic stress, the hypothalamic-pituitary-adrenal (HPA) axis is activated to promote the release of cortisol from the adrenal glands. In order to investigate whether stress signaling affected ATF3 expression, we treated mouse or human primary hepatocytes with hydrocortisone (HC), dexamethasone (DEX), angiotensin II (A-II) or glucagon (GCG). All these stress-related hormones/peptides significantly reduced ATF3 mRNA (Fig. 1a and 1b) and protein (Fig. 1c and Extended Data Fig. 1a) levels in both human and mouse primary hepatocytes. Interestingly, forskolin (FSK), which is known to raise intracellular cAMP levels, had similar effects on ATF3 expression (Fig. 1a–c and Extended Data Fig. 1a). Similar results were observed when HepG2 cells were treated with the stress-related hormones or FSK (Extended Data Fig. 1b).
Figure 1. Hydrocortisone represses hepatic ATF3 expression via activation of the cAMP-PKA pathway.

a-c. Mouse (a) or human (b) primary hepatocytes were treated with vehicle (Veh), 500 nM angiotensin II (A-II), 500 nM dexamethasone (DEX), 250 μM forskolin (FSK), 100 nM glucagon (GCG) or 250 nM hydrocortisone (HC) (n=4). mRNA (a, b) and protein (c) levels were determined after 6 or 24 h, respectively. In (a), **P=0.0003, 0.0062, 0.0002, 0.0002 or 0.0002 for Veh versus A-II, DEX, FSK, GCG or HC treatments, respectively. In (b), **P<1E-6 for Veh versus A-II, DEX, FSK, GCG or HC treatments, respectively.
d and e. Mouse or human primary hepatocytes were treated with vehicle or 500 μM dibutyryl-cAMP (db-cAMP) for 24 h (n=4). Immunoblotting was performed (d) and protein levels were quantified (e). **P=0.0003 or 0.00011 versus db-cAMP in mouse or human primary hepatocytes, respectively.
f and g. Mouse or human primary hepatocytes were pretreated with 10 μM H89 or 1 μM PKI 14-22 (PKI) for 2 h, followed by treatment of hydrocortisone for 24 h. Protein levels were determined (f, g) (n=4). For mouse primary hepatocytes, *P=0.036 and **P=6E-6, 0.00001, 0.00077 or 0.000011 for HC versus Veh, H89, PKI, HC+H89 or HC+PKI, respectively. For human primary hepatocytes, *P=0.038 for HC versus Veh, and **P<0.0001 for HC versus H89, PKI, HC+H89 or HC+PKI, respectively.
h-j. C57BL/6J mice were i.p. injected with either vehicle or hydrocortisone (2 mg/kg) once a day for 7 days (n=8). Plasma cholesterol (chol) (h, left panel) and bile acid (BA) (h, right panel) levels were analyzed. Hepatic protein levels were determined (i, j). In (h), **P<1E-6 or **P=0.0077 for HC versus vehicle treatments for plasma HDL-C or BA levels, respectively. In (j), **P=0.00098, 0.00064, 0.0016 or <1E-6 versus control for SR-BI, CYP7A1, CYP8B1 or ATF3 expression, respectively. k. Human primary hepatocytes were pretreated with 10 μM H89 or 1 μM PKI 14-22 for 2 h, followed by treatment with hydrocortisone for 24 h. mRNA levels were determined (n=4). For ATF3 expression, *P=0.043 and **P=0.0061 or 0.0016 for HC versus Veh, HC+89 or HC+PKI treatments, respectively. For SR-BI expression, **P=0.0017, 0.0003 or 0.000057 for HC versus Veh, HC+H89 or HC+PKI treatments, respectively. For CYP7A1 expression, **P=0.00037, 0.00012 or 0.000028 for HC versus Veh, HC+H89 or HC+PKI treatments, respectively. For CYP8B1 expression, *P=0.011 or 0.027, and **P=0.0071 for HC versus Veh, HC+H89 or HC+PKI treatments, respectively.
l-o. Atf3fl/fl mice and hepatocyte-specific Atf3−/− (L-Atf3−/−) mice were i.p. injected with either vehicle or hydrocortisone (2mg/kg) once a day for 7 days. Hepatic protein (l, m; n=3) and plasma HDL-C (n; n=8 for L-Atf3−/−+HC and n=7 for 3 other groups) and BA (o; n=8 for L-Atf3−/−+HC and n=7 for 3 other groups) levels were determined. In (m), for ATF3 expression, **P=0.001 or 0.000015 for Atf3fl/fl+Veh versus Atf3fl/fl+HC or L-Atf3−/−+Veh, respectively; for SR-BI expression, *P=0.04 and **P=0.0014 for Atf3fl/fl+Veh versus Atf3fl/fl+HC or L-Atf3−/−+Veh, respectively; for CYP7A1 expression, *P=0.023 or 0.017 for Atf3fl/fl+Veh versus Atf3fl/fl+HC or L-Atf3−/−+Veh, respectively; for CYP8B1 expression, **P=0.0031 or 0.0049 for Atf3fl/fl+Veh versus Atf3fl/fl+HC or L-Atf3−/−+Veh, respectively. In (n), **P=6E-6 or 0.00012 for Atf3fl/fl+vehicle versus Atf3fl/fl+HC or L-Atf3−/−+vehicle, respectively. In (o), **P=0.00064 or 0.00037 for Atf3fl/fl+vehicle versus Atf3fl/fl+HC or L-Atf3−/−+vehicle, respectively.
p. Hepatic ATF3 mRNA and plasma HDL-C levels were analyzed in subjects with normal liver tissues (normal) (n=10) or patients with autoimmune hepatitis (AIH) and/or primary biliary cholangitis (PBC) (n=14). *P=0.015 and **P=0.0057 for normal versus AIH/PBC for plasma HDL-C levels and ATF3 mRNA levels, respectively.
q. The correlation between hepatic ATF3 mRNA levels and plasma HDL-C levels in humans. Light blue dots stand for subjects with normal liver tissues (n=10). Red dots stand for patients with AIH and/or PBC (n=14). The expression of ATF3 in the normal liver tissues (r=−0.82, P=0.0036) or all the liver tissues (normal plus AIH/PBC) (r=−0.58, P=0.0029) shows negative correlation with plasma HDL-C levels.
All the data are expressed as mean±SEM. All the data points are biological replicates. A two-tailed Student’s t-test (e, h (BA), j, p), one-way (a, b, g, h (cholesterol), k) or two-way (m-o) ANOVA with Turkey’s post hoc test for multiple comparisons, or a two-tailed Pearson correlation analysis (q) was used for statistical analysis. NS, not significant. See also Extended Data Fig. 1 and Supplementary Table 1.
Consistent with the finding that FSK inhibits ATF3 expression, treatment with dibutyryl cAMP (db-cAMP) also reduced ATF3 mRNA and protein expression in both mouse and human primary hepatocytes (Fig. 1d and 1e; Extended Data Fig. 1c and 1d) or HepG2 cells (Extended Data Fig. 1e and 1f). These data suggest that stress-related hormones inhibit ATF3 expression likely by raising intracellular cAMP levels. To test the latter hypothesis, we treated mouse or human primary hepatocytes with HC in the presence or absence of protein kinase A (PKA) inhibitors H89 or PKI 14-22. H89 or PKI 14-22 increased the basal levels of ATF3 protein expression and completely blocked the inhibitory effect of HC on ATF3 mRNA or protein expression (Fig. 1f and 1g; Extended Data Fig. 1g and 1h).
Next, we investigated whether cortisol affected ATF3 expression in vivo. Interestingly, administration of HC to C57BL/6J mice raised plasma HDL-C levels by 60% without affecting plasma non-HDL-C levels, but reduced plasma bile acid (BA) levels by 53% (Fig. 1h and Extended Data Fig. 1i). The effect of HC on plasma HDL-C levels in mice is similar to what has been reported in humans 33–36. Consistent with the changes in plasma HDL-C and BA levels, HC treatment reduced hepatic ATF3, SR-BI, and CYP7A1 protein levels by 83%, 72% and 67%, respectively, but increased hepatic CYP8B1 protein levels by 2.8 fold (Fig. 1i and 1j).
The interesting findings in mice led us to ask whether cortisol also regulated SR-BI, CYP7A1 or CYP8B1 expression in human hepatocytes. In line with our findings from mouse studies, HC also inhibited SR-BI and CYP7A1 mRNA expression but induced CYP8B1 mRNA levels in human primary hepatocytes (Fig. 1k). Importantly, the regulation of these genes by HC was abolished in the presence of PKA inhibitors H89 or PKI 14-22 (Fig. 1k). Thus, the data of Fig. 1f and 1k indicate that cortisol regulates ATF3, SR-BI, CYP7A1 and CYP8B1 expression via activation of the cAMP-PKA pathway.
To investigate whether ATF3 mediated HC-induced changes in SR-BI, CYP7A1 and CYP8B1 expression, we treated Atf3fl/fl mice and hepatocyte-specific Atf3−/− (L-Atf3−/−) mice with either vehicle or HC. HC induced the changes in hepatic mRNA and protein levels of Scrab1 (SR-BI), Cyp7a1 and Cyp8b1 (Fig. 1l and 1m; Extended Data Fig. 1j), as well as plasma levels of HDL-C and BA (Fig. 1n and 1o; Extended Data Fig. 1k) only in Atf3fl/fl mice, but not in L-Atf3−/− mice (Fig. 1l–o; Extended Data Fig. 1j and 1k). There was no change in plasma ALT or AST levels (Extended Data Fig. 1l), suggesting that HC did not cause liver damage or toxicity. These data suggest that hepatic ATF3 mediates the effect of HC on regulating plasma HDL-C and BA levels.
Finally, we explored the correlation between hepatic ATF3 expression and plasma HDL-C levels in mice and humans. In mice, reduced hepatic Atf3 expression was associated with increased plasma HDL-C levels (Extended Data Fig. 1m) (r=−0.66, P=0.0072). Interestingly, patients with autoimmune hepatitis (AIH) and/or primary biliary cholangitis (PBC) had a 91% reduction in hepatic ATF3 mRNA levels and a 49.6% increase in plasma HDL-C levels compared to those with normal liver tissues (Fig. 1p and Supplementary Table 1). In subjects with normal liver tissues, hepatic ATF3 mRNA levels showed a strong negative correlation with plasma HDL-C levels (light blue dots; r=−0.82, P=0.0036) (Fig. 1q). When taking all the subjects into consideration, there was still a strong correlation between hepatic ATF3 mRNA levels and plasma HDL-C levels (r=−0.58, P=0.0029) (Fig. 1q). Thus, hepatic ATF3 expression is negatively correlated with plasma HDL-C levels in mice and humans.
Taken together, the data of Fig. 1 suggest that cortisol inhibits hepatic ATF3, SR-BI, and CYP7A1 expression and induces hepatic CYP8B1 expression via activation of the cAMP-PKA pathway, and that hepatic ATF3 mediates the effect of cortisol on plasma HDL-C and BA levels. In addition, we show that there is a strong negative correlation between hepatic ATF3 expression and plasma HDL-C levels in humans.
Hepatic ATF3 regulates plasma HDL-C levels and bile acid metabolism
The data of Fig. 1 suggest that ATF3 might directly regulate plasma HDL-C levels. Thus, we generated an adeno-associated virus expressing human ATF3 under the control of an albumin promoter (AAV8-ALB-hATF3), which was then i.v. injected into C57BL/6J mice on a chow diet. Compared to mice injected with AAV8-ALB-Null, mice over-expressing human ATF3 in hepatocytes had reduced plasma levels of total cholesterol (TC), HDL-C and ALT, with plasma levels of triglyceride (TG), non-HDL-C or AST being unchanged (Extended Data Fig. 2a–d). We then did RNA sequencing (RNA-Seq) to globally analyze hepatic genes regulated by human ATF3. Many genes were differentially regulated by ATF3 (Extended Data Fig. 2e), with over 2,500 genes being significantly up- or down-regulated by ≥1.4 fold (Supplementary Data 1; FDR adjusted p value <0.05). Among the differentially regulated genes, only a limited number of genes were known to regulate lipoprotein, cholesterol, or bile acid metabolism, such as Scarb1 (SR-BI), Ldlr, Apoe, Cyp7a1 and Cyp8b1 (Fig. 2a). We then did qRT-PCR and immunoblotting assays to confirm our RNA-Seq data. Hepatocyte-specific over-expression of human ATF3 significantly induced SR-BI, Ldlr, Apoe and Cyp7a1 mRNA and protein levels but markedly repressed Cyp8b1 mRNA and protein levels by >78% (Extended Data Fig. 2f–i). In contrast, there was no change in hepatic mRNA levels of sterol regulatory element-binding protein 2 (Srebp2), HMG-CoA reductase (Hmgcr) or HMG-CoA synthase (Hmgcs) (Extended Data Fig. 2f), or hepatic protein levels of microsomal triglyceride transfer protein (MTP), ApoB100 or ApoB48 (Extended Data Fig. 2h). Consistent with a >3-fold induction in hepatic CYP7A1 expression (Extended Data Fig. 2f–i), plasma BA levels were increased by 2.3 fold (Extended Data Fig. 2j). Analysis of BA composition in the bile showed that ATF3 over-expression increased tauroursodeoxycholic acid (TUDC) and taurochenodeoxycholic acid (TCDCA) levels by 2.6 and 1.7 fold, respectively, but reduced taurocholic acid (TCA) levels by 70% (Extended Data Fig. 2k). The changes in TUDC, TCDCA and TCA levels were in line with the finding that ATF3 increased CYP7A1 but reduced CYP8B1 expression in the liver (Extended Data Fig. 2f–i). Surprisingly, ATF3 inhibited both Cyp7a1 and Cyp8b1 promoter activities (Extended Data Fig. 2l). Since CYP8B1 expression was markedly repressed by ATF3 (Extended Data Fig. 2f–i), the induction of CYP7A1 expression by ATF3 is likely secondary to CYP8B1 repression.
Figure 2. Hepatocyte ATF3 regulates HDL uptake via SR-BI.
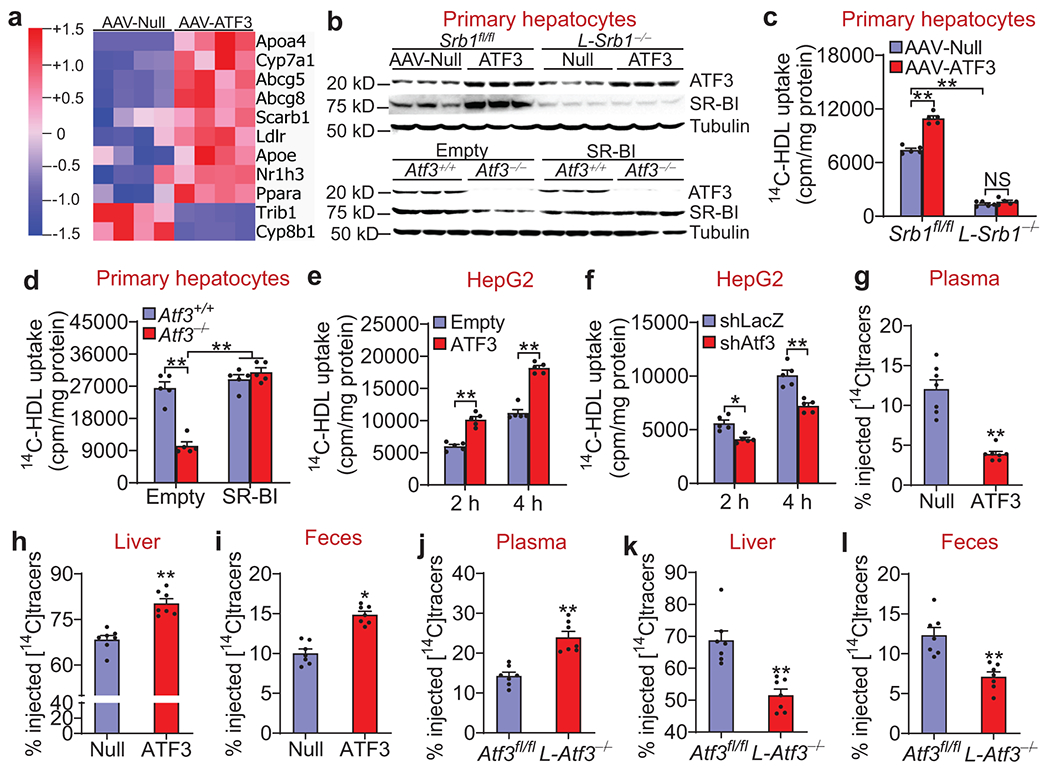
a. C57BL/6J mice were i.v. injected with AAV8-ALB-Null (AAV-Null) or AAV8-ALB-hATF3 (AAV-ATF3). After 2 months, total hepatic RNA was isolated for RNA sequencing (n=4). The heatmap shows that some lipid metabolism-related genes were up- or down-regulated by ATF3.
b-d. Scarb1fl/fl (Srb1fl/fl) or hepatocyte-specific Scarb1−/− (L-Srb1−/−) mice were i.v. injected with AAV8-ALB-Null or AAV8-ALB-hATF3 (b, top panel and c). In a separate study, Atf3+/+ or Atf3−/− mice were i.v. injected with 0.5x10⁹ pfu Ad-Empty or Ad-SR-BI (b, bottom panel and d). After 10 days, primary hepatocytes were isolated from these mice. Western blot assays were performed (n=3) (b). HDL uptake was carried out after hepatocytes were treated for 2 h with HDL labeled with [14C]cholesteryl Oleate (14C-HDL) (n=5) (c, d). In (c), **P<1E-6 for Srb1fl/fl+AAV-Null versus Srb1fl/fl+AAV-ATF3 or L-Srb1−/−+AAV-Null. In (d), **P=1E-6 for Atf3−/−+Ad-Empty versus Atf3+/++Ad-Empty, and **P<1E-6 for Atf3−/−+Ad-Empty versus Atf3+/++Ad-SR-BI or Atf3−/−+Ad-SR-BI.
e and f. HepG2 cells were infected for 36 h with Ad-Empty or Ad-ATF3 (e), or Ad-shLacZ or Ad-shAtf3 (f). HDL uptake was determined as described above (n=5). In (e), **P=0.000015 or <1E-6 for Ad-Empty versus Ad-ATF3 at 2 h or 4 h, respectively. In (f), *P=0.022 and **P=0.000054 for shellacs Ad-shLacZ versus Ad-shAtf3 at 2 h or 4h, respectively.
g-i. C57BL/6J mice were i.v. injected with AAV8-ALB-Null (Null) or AAV8-ALB-hATF3 (ATF3) (n=7). After 3 months, mice were i.v. injected with 14C-HDL. The radioactivity in the plasma (g), liver (h) and feces (i) were determined 24 h after injection with 14C-HDL. **P=0.0003, 0.00008 or 0.000017 versus Null for plasma (g), liver (h) or feces (i), respectively.
j-l. Atf3fl/fl mice and hepatocyte-specific Atf3−/− (L-Atf3−/−) mice were i.v. injected with 14C-HDL (n=7). After 24 h, the radioactivity in the plasma (j), liver (k) and feces (l) were determined. **P=0.0002, 0.0006 or 0.0010 versus Atf3fl/fl for plasma (j), liver (k) or feces (l), respectively.
All the data are expressed as mean±SEM. All the data points are biological replicates. A two-tailed Student’s t-test (g-l) or two-way ANOVA with Turkey’s post hoc test for multiple comparisons (c-f) was used for statistical analysis. NS, not significant. See also Extended Data Figs. 2–5 and Supplementary Data 1.
To investigate whether ATF3 also regulated HDL and BA metabolism in hyperlipidemic and hyperglycemic mice, we i.v. injected AAV8-ALB-hATF3 or AAV8-ALB-Null into db/db mice. Over-expression of ATF3 in the liver reduced plasma levels of total cholesterol, HDL-C, non-HDL-C, ALT and AST (Extended Data Fig. 3a–d), but increased plasma BA levels (Extended Data Fig. 3e). The reduction in plasma ALT and AST levels suggest that ATF3 may improve liver damage in db/db mice. In addition, ATF3 over-expression induced CYP7A1, SR-BI, LDLR and ApoE protein levels by >2 fold whereas CYP8B1 protein expression was repressed by 78% (Extended Data Fig. 3f and 3g). The changes in hepatic gene expression and plasma levels of HDL-C and BA in db/db mice are similar to those observed in chow-fed C56BL/6J mice (Extended Data Fig. 2).
In contrast to what was observed in mice over-expressing hepatic ATF3, L-Atf3−/− mice had an increase in plasma total cholesterol and HDL-C levels with plasma levels of non-HDL-C, ALT or AST being unchanged (Extended Data Fig. 4a–d). L-Atf3−/− mice also had reduced plasma BA levels (Extended Data Fig. 4e). Consistent with the change in plasma HDL-C and BA levels, hepatic protein levels of ATF3, CYP7A1 and SR-BI were reduced by 83%, 72% and 76%, respectively whereas hepatic CYP8B1 protein expression was increased by 420% in L-Atf3−/− mice (Extended Data Fig. 4f and 4g). There was no change in hepatic protein levels of LDLR or ApoE (Extended Data Fig. 4f) or mRNA levels of Srebp2, Hmgcr or Hmgcs between the two genotypes (Extended Data Fig. 4h). Together, the data of Extended Data Figs. 2–4 indicate that hepatic ATF3 plays an important role in regulating HDL and BA metabolism.
ATF3 is a key regulator of HDL uptake by hepatocytes in vitro and in vivo
The data of Extended Data Figs. 2–4 have shown that ATF3 is a key regulator of hepatic SR-BI expression. Consistent with a critical role of SR-BI in HDL uptake, AAV-mediated over-expression of human ATF3 increased HDL uptake by >147% in primary hepatocytes isolated from Scarb1fl/fl (Srb1fl/fl) mice, but not from hepatocyte-specific Scarb1−/− (L-Srb1−/−) mice (Fig. 2b, top panel and 2c; Extended Data Fig. 5a). In contrast, Atf3−/− hepatocytes had a 61% reduction in HDL uptake, which was normalized after SR-BI expression was recapitulated to the normal level (Fig. 2b, bottom panel and 2d; Extended Data Fig. 5b). Similar data were collected in HepG2 cells when ATF3 was over-expressed (Fig. 2e) or knocked down (Fig. 2f). In addition, AAV-mediated over-expression of ATF3 increased LDL uptake in primary hepatocytes isolated from Ldlr+/+ mice, but not from Ldlr−/− mice (Extended Data Fig. 5c and 5d, left and right panels), consistent with a role of ATF3 in inducing LDLR expression (Extended Data Figs. 2 and 3). There was no change in LDL uptake between Atf3+/+ hepatocytes and Atf3−/− hepatocytes (Extended Data Fig. 5e), which was in line with the finding that LDLR expression was unaltered in chow-fed mice Atf3−/− mice (Extended Data Fig. 4f). In HepG2 cells, over-expression of ATF3 also increased LDL uptake (Extended Data Fig. 5f and 5g), whereas knockdown of ATF3 in HepG2 cells reduced LDLR expression and LDL uptake (Extended Data Fig. 5h and 5i). Thus, ATF3 regulates hepatocyte uptake of both HDL and LDL in vitro.
To determine whether ATF3 regulates hepatocyte uptake of HDL in vivo, we i.v. injected AAV8-ALB-hATF3 or AAV8-ALB-Null into C57BL/6J mice. These mice were then i.v. injected with HDL labeled with [14C]cholesteryl oleate ([14C]HDL). Over-expression of human ATF3 in hepatocytes reduced 14C-tracers by 68% in the plasma (Fig. 2g) but increased 14C-tracers by 17.4% in the liver (Fig. 2h) and 48.6% in the feces (Fig. 2i). In contrast, L-Atf3−/− mice injected with [14C]HDL had a 67.8% increase in 14C-tracers in the plasma (Fig. 2j) and a 25% or 57.7% reduction in 14C-tracers in the liver (Fig. 2k) or feces (Fig. 2l), respectively. Together, the data of Fig. 2 show that ATF3 plays a key role in regulating hepatocyte uptake of HDL-C via a pathway involving SR-BI.
ATF3 regulates hepatic SR-BI expression and plasma HDL-C levels via p53
SR-BI is essential for hepatocyte uptake of HDL from plasma. The finding that ATF3 regulates hepatocyte uptake of HDL-C via SR-BI led us to investigate how ATF3 regulated SR-BI expression and plasma HDL-C levels. P53 is a tumor suppressor protein that was previously shown to interact with ATF3 in H1299 cells 37, a human non-small cell lung carcinoma cell line. Consistent with this finding, ATF3 co-precipitated with p53 when liver lysates were used (Fig. 3a). Importantly, over-expression of p53 in the liver increased hepatic SR-BI expression by >2 fold (Extended Data Fig. 6a). We then explored whether p53 played a role in ATF3-regulated lipid homeostasis by using p53fl/fl mice and hepatocyte-specific p53−/− (L-p53−/−) mice. AAV8-mediated over-expression of ATF3 in hepatocytes lowered plasma HDL-C levels in p53fl/fl mice, but not in L-p53−/− mice (Fig. 3b and Extended Data Fig. 6b). There was no change in plasma non-HDL-C levels (Extended Data Fig. 6b and 6c). ATF3 over-expression reduced plasma ALT but not AST levels in both genotypes (Extended Data Fig. 6d). In the liver, ATF3 over-expression increased hepatic SR-BI protein expression by 3 fold in p53fl/fl mice, which was blunted in L-p53−/− mice (Fig. 3c and 3d). Since the data of Fig. 1 show that ATF3 is a downstream target of HC, we also determined whether p53 mediated the effect of HC on SR-BI expression. As expected, HC raised plasma HDL-C levels and repressed hepatic SR-BI expression in p53fl/fl mice; however, these changes were abolished in L-p53−/− mice (Fig. 3e and 3f; Extended Data Fig. 6e). These was no change in plasma ALT or AST levels in these mice (Extended Data Fig. 6f). These data indicate that hepatocyte p53 is important for HC and ATF3 to regulate hepatic SR-BI expression and plasma HDL-C levels.
Figure 3. Hepatocyte ATF3 regulates SR-BI expression and plasma HDL-C levels via interaction with p53.

a. Co-IP was performed using liver lysates over-expressing ATF3 and an ATF3 antibody or IgG (n=3). Western blot assays were performed to determine protein levels.
b-d. p53fl/fl mice and hepatocyte-specific p53−/− (L-p53−/−) mice were i.v. injected with AAV8-ALB-Null (AAV-Null) or AAV8-ALB-hATF3 (AAV-ATF3) (n=7). After 30 days, plasma HDL-C levels were quantified (b). Hepatic proteins were analyzed by Western blot assays (c) and protein levels were quantified (d; n=3). In (b), **P=0.00044 for AAV-Null versus AAV-ATF3 for p53fl/fl. In (d), for p53 expression, **P=0.0044 for p53fl/fl+AAV-Null versus L-p53−/−+AAV-Null; for ATF3 expression, *P=0.013 or 0.036 for p53fl/fl+AAV-Null versus p53fl/fl+AAV-ATF3 or L-p53−/−+AAV-Null versus L-p53−/−+AAV-ATF3, respectively; for SR-BI expression, **P=0.00074 for p53fl/fl+AAV-Null versus p53fl/fl+AAV-ATF3.
e and f. p53fl/fl mice and L-p53−/− mice were i.p. injected with either vehicle or hydrocortisone (HC; 2mg/kg) once a day for 7 days (n=7). Plasma HDL-C (e) and hepatic mRNA levels (f) were determined. In (e), **P=0.0068 for vehicle versus HC treatments. In (f), for p53 expression, **P=0.000158 or <1E-6 for p53fl/fl+Veh versus p53fl/fl+HC or L-p53−/−+Veh; for Scarb1 expression, **P=0.000014 for p53fl/fl+Veh versus p53fl/fl+HC.
g and h. HepG2 cells were transfected with pGL3-SR-BI-Luc constructs together with plasmids over-expressing p53 (pCMV-p53) (g, h) or ATF3 (pCMV-ATF3) (h) (n=5 for (g) and n=6 for (h)). After 36 h, relative luciferase units (RLU) were determined. In (h), mutation of the p53 binding site abolished the induction of SR-BI promoter activity by p53 or ATF3. In (g), *P=0.044 and **P=3E-6, 0.000022, 0.00014, 0.0031 or 5E-7 for CMV-Empty versus CMV-p53 for −0.4, −2.9, −1.0 kb, −0.8 kb, −0.6 kb or −0.2 kb SR-BI-Luc, respectively. In (h), **P<1E-6 for CMV-Null versus CMV-p53 or CMV-ATF3 for WT SR-BI-Luc. i. EMSA was performed to determine the p53 binding site in the SR-BI promoter. Lane 1: free probe. Lane 2 shows p53 protein bound to SR-BI DNA oligonucleotides. Lanes 3-8: competition assays using SR-BI DNA oligonucleotides containing a wild-type (lanes 3-5) or mutant (lanes 6-8) p53 binding site. Lanes 9 and 10: supershift assay in the presence of IgG or a p53 antibody. This experiment was repeated once with similar results.
j and k. ChIP assays were performed using liver lysates over-expressing p53 (j) or ATF3 (k). A p53 antibody (j) or an ATF3 antibody (k) was used for immunoprecipitation (n=4). qRT-PCR was used to quantify the DNA enrichment on the SR-BI promoter. In (j), **P=7E-6 for IgG versus p53 Ab for the SR-BI promoter (−141 to −57 bp). In (k), **P=0.002 for IgG versus ATF3 Ab for the SR-BI promoter (−141 to −57 bp).
All the data are expressed as mean±SEM. All the data points are biological replicates. A two-tailed Student’s t-test (g, j, k) or two-way ANOVA with Turkey’s post hoc test for multiple comparisons (b, d, e, f, h) was used for statistical analysis. NS, not significant. See also Extended data Fig. 6.
To understand how p53 and ATF3 cooperated to regulate SR-BI expression, we performed transient transfection assays using a serial of truncated SR-BI promoter constructs. Over-expression of p53 (Fig. 3g) or ATF3 (Extended Data Fig. 6g) significantly induced the promoter activity of SR-BI. Such inductions were abolished when the p53 binding site was mutated (Fig. 3h). To confirm our transfection assay results, we also performed electrophoretic mobility shift assays (EMSAs) and chromatin immunoprecipitation (ChIP) assays. Our EMSA data showed that p53 protein bound to the DNA oligonucleotides containing wild-type SR-BI sequences, and this binding was competed away by excessive DNA oligonucleotides containing a wild-type but not a mutant p53 binding site (Fig. 3i). Moreover, the DNA/protein complex was super-shifted in the presence of a p53 antibody (Fig. 3i). In contrast, ATF3 protein alone failed to bind to the proximal SR-BI promoter in an EMSA study (Extended Data Fig. 6h). In the liver, p53 (Fig. 3j) or ATF3 (Fig. 3k) proteins were found to bind to the proximal promoter of SR-BI as determined by ChIP assays. These latter data suggest that ATF3 binds to the promoter of SR-BI by interaction with p53. Together, the data of Fig. 3 demonstrate that ATF3 regulates hepatic SR-BI expression and plasma HDL-C levels by interaction with p53.
ATF3 is indispensable for intestinal fat and cholesterol absorption and macrophage RCT
In addition to regulating SR-BI expression and plasma HDL uptake, our data also show that hepatic ATF3 modulates CYP7A1 and CYP8B1 expression and BA composition (Extended Data Figs. 2–4). Tauroursodeoxycholic acid (TUDC), which is increased by 2.6 fold by ATF3 over-expression (Extended Data Fig. 2), has been shown to inhibit cholesterol absorption in mice and humans 38–42. Previous work has demonstrated that loss of CYP8B1 inhibits intestinal fat and cholesterol absorption 9,43,44. Thus, we hypothesized that ATF3 might regulate intestinal fat and/or cholesterol absorption. To test our hypothesis, we over-expressed or knocked out Atf3 in mouse hepatocytes. AAV8-mediated over-expression of human ATF3 in hepatocytes significantly reduced intestinal cholesterol and fat absorption (Figs. 4a and 4b; Extended Data Fig. 7a). Since intestinal cholesterol absorption and hepatocyte HDL uptake are two important components of reverse cholesterol transport (RCT), we also measured macrophage RCT by i.p. injecting mice with macrophages loaded with acetylated LDL and [3H]cholesterol. Over-expression of human ATF3 in hepatocytes reduced plasma levels of 3H-tracers by 56%, but increased the levels of 3H-tracers in the liver and feces by 192% and 234%, respectively (Fig. 4c). In contrast, loss of Atf3 in hepatocytes significantly increased intestinal absorption of cholesterol (Fig. 4d) and fats (Fig. 4e and Extended Data Fig. 7b). In the RCT study, Atf3 ablation raised plasma 3H-tracer levels by 162% but reduced 3H-tracer levels in the liver or feces by >31% (Fig. 4f). Collectively, the data of Fig. 4 demonstrate that hepatocyte ATF3 is a key regulator of intestinal fat and cholesterol absorption as well as macrophage RCT.
Figure 4. Hepatocyte ATF3 is indispensable for regulating intestinal fat and cholesterol absorption as well as macrophage reverse cholesterol transport.

a-c. C57BL/6J mice were i.v. injected with AAV8-ALB-Null (Null) or AAV8-ALB-hATF3 (ATF3). Intestinal cholesterol (chol) absorption (a; n=8 for the Null group and n=7 for the ATF3 group), intestinal fat absorption (b; n=7) and macrophage reverse cholesterol transport (c; n=8 for the Null group and n=7 for the ATF3 group) were determined. In (a), **P=0.0036 versus Null. In (b), **P<1E-6 for AAV-Null versus AAV-ATF3. In (c), **P=0.004, 0.0029 or 0.000018 versus Null for plasma, liver or feces, respectively.
d-f. Intestinal cholesterol absorption (d), intestinal fat absorption (e) and macrophage reverse cholesterol transport (f) were determined in Atf3fl/fl mice and L-Atf3−/− mice (n=8). In (d), **P=0.0021 versus Atf3fl/fl. In (e), **P<1E-6 for Atf3fl/fl versus L-Atf3−/−. In (f), *P=0.011 and **P=0.0041 or 0.0045 versus Atf3fl/fl for feces, plasma or liver, respectively.
The data are expressed as mean±SEM (a, c, d, f) or mean±SD (b, e). All the data points are biological replicates. A two-tailed Student’s t-test (a, c, d, f) or one-way ANOVA with Turkey’s post hoc test for multiple comparisons (b, e) was used for statistical analysis. See also Extended data Fig. 7.
BA signaling has been shown to regulate hepatic VLDL secretion 45. We therefore determined the role of hepatic ATF3 in VLDL secretion. Over-expression of human ATF3 in hepatocytes reduced VLDL secretion (Extended Data Fig. 7c), whereas loss of hepatocyte ATF3 increased VLDL secretion (Extended Data Fig. 7d), indicating an important role of hepatocyte ATF3 in inhibiting VLDL secretion.
ATF3 inhibits intestinal fat and cholesterol absorption via an ATF3-HNF4α-CYP8B1 pathway
Cyp8b1−/− mice have reduced intestinal fat and cholesterol absorption 9,43,44. The finding that ATF3 markedly represses hepatic CYP8B1 expression (Extended Data Figs. 2–4) suggests that CYP8B1 may play a role in ATF3-mediated repression of intestinal fat or cholesterol absorption. To test this hypothesis, we i.v. injected C57BL/6J mice with AAV8-ALB-Null, AAV8-ALB-ATF3, and/or AAV8-ALB-CYP8B1. ATF3 over-expression reduced hepatic CYP8B1 expression, which was recapitulated to the normal levels after AAV-mediated expression of exogenous CYP8B1 (Fig. 5a, left and right panels). Normalization of hepatic CYP8B1 expression prevented ATF3 from induction of CYP7A1 expression (Fig. 5a) or reducing intestinal cholesterol (Fig. 5b) or fat (Fig. 5c) absorption, indicating that ATF3 reduces intestinal fat and cholesterol absorption via inhibition of CYP8B1, and that the induction of CYP7A1 by ATF3 is secondary to CYP8B1 inhibition. In addition, ATF3 over-expression reduced plasma ALT but not AST levels in the presence or absence of CYP8B1 co-over-expression (Extended Data Fig. 8a).
Figure 5. Hepatocyte ATF3 inhibits intestinal cholesterol and fat absorption by an ATF3-HNF4α-CYP8B1 pathway.

a-c. C57BL/6J mice were i.v. injected with AAV8-ALB-Null (Null), AAV8-ALB-hATF3 and/or AAV8-ALB-CYP8B1 (CYP8B1). After two months, hepatic proteins were immunoblotted (a, left panel) and protein levels were quantified (a, right panel) (n=3). Intestinal cholesterol absorption (b; n=7) or fat absorption (c; n=7 for the Null or Null+ATF3 groups, and n=8 for the Null+CYP8B1 or ATF3+CYP8B1 groups) was determined. In (a), for CYP7A1 expression, **P=0.0032 or 0.0012 for AAV-ATF3 versus AAV-Null or AAV-ATF3+CYP8B1, respectively; for CYP8B1 expression, **P=0.000067 or 0.00016 for AAV-ATF3 versus AAV-Null or AAV-ATF3+CYP8B1, respectively. In (b), **P=0.0003, 6E-6 or 0.0037 for AAV-ATF3+Null versus AAV-Null, AAV-Null+CYP8B1 or AAV-ATF3+CYP8B1, respectively. In (c), P<1E-6 for AAV-ATF3+Null versus AAV-Null, AAV-Null+CYP8B1, or AAV-ATF3+CYP8B1, respectively.
d and e. Hnf4αfl/fl mice or hepatocyte-specific Hnf4α−/− (L-Hnf4α−/−) mice were i.v. injected with AAV8-ALB-Null (Null) or AAV8-ALB-hATF3 (ATF3) (n=6). Western blot assays were performed (d) and protein levels were quantified (e; n=3). NS, not significant. For ATF3 expression, **P=0.00012 or 0.0019 for Hnf4αfl/fl+AAV-Null versus Hnf4αfl/fl+AAV-ATF3 or L-Hnf4α−/−+AAV-Null versus L-Hnf4α−/−+AAV-ATF3, respectively. Also, **P=0.004 or 0.00085 for Hnf4αfl/fl+AAV-Null versus Hnf4αfl/fl+AAV-ATF3 for CYP7A1 or CYP8B1 expression, respectively.
f. pGL3-Cyp8b1-Luc plasmids were co-transfected with pCMV-Empty or pCMV-ATF3 plasmids into HepG2 cells (n=6). After 36 h, relative luciferase units (RLU) were determined. NS, not significant. *P=0.038 or 0.027 and **P=0.00027 versus CMV-Empty for −0.4 kb, −0.19 kb or −0.5 kb Cyp8b1-Luc, respectively.
g. The pGL3-Cyp8b1-(−0.5 kb) plasmid containing the wild-type (WT) or mutant HNF4α binding site was co-transfected with pCMV-Empty or pCMV-ATF3 into HepG2 cells (n=8). After 36 h, RLU was determined. **P<1E-6 versus CMV-Empty for WT Cyp8b1-Luc.
h. The pGL3-Cyp8b1-(−0.5kb) plasmid was co-transfected with pCMV-Empty, pCMV-ATF3 and/or pCMV-HNF4α DN (expressing dominant negative HNF4α) into HepG2 cells (n= 8). After 36 h, RLU was determined. DN, dominant negative. **P=0.0022 versus CMV-Empty for the control group.
i. Co-IP was performed using liver lysates over-expressing ATF3 and an ATF3 antibody (n=3). Western blot assays were performed using antibodies against ATF3 or HNF4α.
j. ChIP assay was performed using liver lysates over-expressing ATF3 and an ATF3 antibody (n=4). qRT-PCR was used to quantify the DNA enrichment on the Cyp8b1 promoter. *P=0.029 for Cyp8b1-Luc (−108 to +15 bp).
k. C57BL/6J mice were i.v. injected with AAV8-ALB-Null (Null), AAV8-ALB-hATF3 and/or AAV8-ALB-CYP8B1. After two months, mice were i.v. injected with Ad-shLacZ or Ad-shLxrα (n=5). Hepatic mRNA levels were determined after 7 days. For Lxrα expression, **P<1E-6 or **P=0.000047 for AAV-Null+shLacZ versus AAV-ATF3+shLacZ or AAV-Null+shLxrα, respectively. For Cyp7a1 expression, *P=0.015 or **P=3E-16 for AAV-Null+shLacZ versus AAV-Null+shLxrα or AAV-ATF3+shLacZ, respectively. For Cyp8b1 expression, **P=0.000023 for AAV-Null+shLacZ versus AAV-ATF3+shLacZ, or **P<1E-6 for AAV-Null+shLxrα versus AAV-ATF3+shLxrα.
l. Fxr+/+ mice and Fxr−/− mice were i.v. injected with AAV8-ALB-Null or AAV8-ALB-hATF3 (n=6). After 2 months, hepatic mRNA levels were quantified. For Cyp7a1 expression, **P=0.00025 or 0.000042 for AAV-Null versus AAV-ATF3 in Fxr+/+ or Fxr−/− mice, respectively. For Cyp8b1 expression, *P=0.03 or **P<1E-6 for AAV-Null versus AAV-ATF3 in Fxr+/+ or Fxr−/− mice, respectively.
All the data are expressed as mean±SEM (a, b, e-h, j-l) or mean±SD (c). All the data points are biological replicates. One-way (a) or two-way (b, c, e-h, j-l) ANOVA with Turkey’s post hoc test for multiple comparisons was used for statistical analysis. NS, not significant. See also Extended Data Fig. 8.
Next, we investigated how ATF3 inhibited CYP8B1 expression. Hepatocyte nuclear factor 4α (HNF4α) is enriched in the liver and plays an important role in regulating CYP7A1 and CYP8B1 expression 46. HNF4α binds to a specific element in the proximal promoter of Cyp8b1 to regulate its expression 46. Therefore, we tested whether HNF4α was involved in ATF3-mediated regulation of CYP8B1. As expected, AAV-mediated over-expression of human ATF3 in hepatocytes inhibited CYP8B1 but increased CYP7A1 protein expression in Hnf4αfl/fl mice; interestingly, these changes were abolished in hepatocyte-specific Hnf4a−/− (L-Hnf4α−/−) mice (Fig. 5d and 5e), indicating that hepatocyte HNF4α is important for ATF3 to repress CYP8B1 or induce CYP7A1 expression. In contrast, ATF3 over-expression reduced plasma ALT and HDL-C levels in both Hnf4αfl/fl mice and L-Hnf4α−/− mice with plasma AST levels being unchanged between groups (Extended Data Fig. 8b and 8c).
To determine how ATF3 and HNF4α coordinated to inhibit Cyp8b1 expression, we generated a serial of truncated Cyp8b1 promoter constructs and performed transient transfection assays. Our data showed that the promoter region between −0.1 kb and −0.063 kb was important for ATF3 to inhibit Cyp8b1 expression (Fig. 5f and Extended Data Fig. 8d). A previous study showed that HNF4α bound to a response element located in the same region 46. Mutation of the HNF4α binding site abolished the inhibitory effect of ATF3 on the Cyp8b1 promoter activity (Fig. 5g). Importantly, a dominant negative form of HNF4α (HNF4α DN) 47 also abolished the inhibitory effect of ATF3 on the Cyp8b1 promoter activity (Fig. 5h). Consistent with these findings, ATF3 protein physically interacted with HNF4α in a co-immunoprecipitation assay (Fig. 5i). ChIP assays showed that ATF3 protein bound to the proximal promoter (−0.1 to −0.063 kb) of the Cyp8b1 promoter in the liver (Fig. 5j). These data indicate that ATF3 inhibits Cyp8b1 expression by direct interaction with HNF4α.
We also investigated how ATF3 induced CYP7A1 expression. The finding that ATF3 inhibits Cyp7a1 promoter activity (Extended Data Fig. 2l) suggests that ATF3 induces CYP7A1 indirectly. The BA receptor farnesoid X receptor (FXR) plays an essential role in inhibition of CYP7A1 expression by up-regulating fibroblast growth factor 15 (FGF15) in the intestine and small heterodimer dimer (SHP) in the liver 48,49. However, ATF3 over-expression induced intestinal Fgf15 expression and did not affect hepatic Shp expression (Extended Data Fig. 8e), suggesting that FXR signaling may not be involved in ATF3-mediated induction of CYP7A1 expression. Liver X receptor α (LXRα) is shown to induce CYP7A1 expression 50,51. Interestingly, ATF3 induced hepatic Lxrα mRNA levels by >2 fold, which was abolished when CYP8B1 was over-expressed in the liver (Extended Data Fig. 8f), suggesting that the induction of LXRα by ATF3 is secondary to CYP8B1 inhibition. ATF3 did not affect hepatic Lxrβ or inducible degrader of the LDLR (Idol) expression (Extended Data Fig. 8f). In mice, LXR activation does not induce hepatic Idol expression 52. Since the induction of both CYP7A1 and LXRα by ATF3 is secondary to CYP8B1 inhibition (Fig. 5a and Extended Data Fig. 8f), next we determined whether LXRα was involved in ATF3-mediated induction of CYP7A1 expression. Over-expression of Lxrα shRNA in the liver did not affect Cyp8b1 expression, but prevented ATF3 from induction of both Lxrα and Cyp7a1 expression (Fig. 5k). These data suggest that ATF3 induces hepatic CYP7A1 expression via a mechanism involving induction of LXRα.
Finally, we determined whether FXR signaling was involved in ATF3-mediated inhibition of intestinal cholesterol and/or fat absorption by using Fxr+/+ mice and Fxr−/− mice. Our data showed that AAV-mediated over-expression of ATF3 suppressed intestinal cholesterol (Extended Data Fig. 8g) or fat (Extended Data Fig. 8h) absorption in both genotypes. In addition, ATF3 induced Cyp7a1 but repressed Cyp8b1 expression in both Fxr+/+ mice and Fxr−/− mice (Fig. 5l). These data indicate that ATF3 inhibits intestinal lipid absorption or hepatic CYP8B1 expression and induces hepatic CYP7A1 expression independent of FXR.
Taken together, the data of Fig. 5 and Extended Data Fig. 8 show that ATF3 inhibits intestinal fat and cholesterol absorption via an ATF3-HNF4α-CYP8B1 pathway, and that ATF3 represses hepatic CYP8B1 expression via interaction with HNF4α and increases hepatic CYP7A1 expression via a pathway involving induction of LXRα.
ATF3 attenuates the development of atherosclerosis independent of induction of LDLR or ApoE
The findings that over-expression of hepatocyte ATF3 increases plasma HDL uptake and macrophage RCT but reduces intestinal fat and cholesterol absorption (see Figs. 2–5) suggest that ATF3 may prevent the development of atherosclerosis. Interestingly, ATF3 over-expression also highly induces hepatic LDLR and ApoE expression and LDL uptake (Extended Data Figs. 2, 3 and 5). To determine whether ATF3 over-expression prevented the development of atherosclerosis and whether the induction of LDLR or ApoE played a role in this process, we over-expressed human ATF3 in the hepatocytes of Apoe−/− mice or Ldlr−/− mice that were also fed a Western diet. AAV8-mediated over-expression of human ATF3 in the hepatocytes of Apoe−/− mice increased hepatic ATF3, SR-BI, CYP7A1 and LDLR protein levels by 2.5-3.5 fold and reduced hepatic CYP8B1 protein levels by 82% (Fig. 6a and 6b) without affecting food intake or body weight (Extended Data Fig. 9a). Over-expression of human ATF3 in hepatocytes also reduced plasma levels of total cholesterol (TC), LDL-C (Extended Data Fig. 9b), HDL-C (Fig. 6c), non-HDL-C (Fig. 6d), triglycerides (TG) (Fig. 6e), ApoA-I and ApoB (Extended Data Fig. 9c). The reduction in plasma ApoA-I levels is consistent with a previous report showing that transgenic expression of hepatic SR-BI reduces plasma ApoA-I levels 53. Analysis of plasma lipoprotein profiles by fast protein liquid chromatography (FPLC) showed that ATF3 reduced plasma levels of VLDL-C, LDL-C and HDL-C (Extended Data Fig. 9d) as well as VLDL-TG (Extended Data Fig. 9e). ATF3 over-expression also reduced plasma ALT and AST levels (Extended Data Fig. 9f), suggesting that ATF3 over-expression improves liver damage in Apoe−/− mice. Most strikingly, over-expression of human ATF3 reduced the plaque size of en face aortas by 74% (Fig. 6f and 6g) and the plaque size of aortic roots by 56% (Fig. 6h and 6i). ATF3 also reduced macrophage infiltration by 57% in the lesions of aortic roots (Extended Data Fig. 9g and 9h).
Figure 6. Over-expression of human ATF3 in hepatocytes attenuates the development of atherosclerosis independent of ApoE or LDLR.

a-i. Three-months-old Apoe−/− mice were i.v. injected with either AAV8-ALB-Null or AAV8-ALB-hATF3. After 3 months, mice were euthanized. Hepatic protein levels were determined by Western blot assays (a) and then quantified (b; n=4). Plasma levels of HDL-C (c; n=7), non-HDL-C (d; n=7) or triglycerides (TG) (e; n=9 for the Null group, and n=13 for the ATF3 group) were measured. Representative images of en face aortas are presented (f) and the lesion size of en face aortas was determined (g; n=12). Representative images of aortic roots are shown (h) and the lesion size of aortic roots was quantified (i; n=13). In (b), *P=0.02 and **P=0.001, 0.002. 0.0037 or 0.0061 versus Null for CYP7A1, ATF3, SR-BI, CYP8B1 or LDLR expression, respectively. In (c), **P=0.0008 versus Null. In (d), **P=0.0037 versus Null. In (e), **P=0.0099 versus Null. In (g), **P=3E-6 versus Null. In (i), **P=9E-6 versus Null.
j-r. Ldlr−/− mice were i.v. injected with AAV8-ALB-Null or AAV8-ALB-hATF3, and then fed a Western diet for 3 months (n=8). Hepatic protein levels were determined by Western blot assays (j) and then quantified (k; n=4). Plasma levels of HDL-C (l), non-HDL-C (m) or TG (n) were measured. Representative images of en face aortas are presented (o) and the lesion size of en face aortas was analyzed (p). Representative images of aortic roots are shown (q) and the lesion size of aortic roots was quantified (r). In (k), *P=0.032 and **P=0.00075, 0.0036, 0.0013 or 0.0043 versus Null for CYP8B1, ATF3, SR-BI, CYP7A1 or ApoE expression, respectively. In (l), **P=0.0017 versus Null. In (m), **P=0.000042 versus Null. In (n), *P=0.014 versus Null. In (p), **P=0.0002 versus Null. In (r), *P=0.01 versus Null.
s-z. Nine-weeks-old Apoe−/− mice and Apoe−/−Ldlr−/− mice were i.v. injected with AAV8-ALB-Null or AAV8-ALB-hATF3, and then fed a Western diet for 3 months. Hepatic proteins were analyzed by Western blot assays (s) and protein levels were quantified (t; n=3). Plasma levels of HDL-C (u, left panel), non-HDL-C (u, right panel) or TG (v) were measured (for u and v, n=8 for Apoe−/−+Null or Apoe−/−+ATF3, n=11 for Apoe−/−Ldlr−/−+Null, and n=12 for Apoe−/−Ldlr−/−+ATF3). Representative images of en face aortas are presented (w) and the lesion size of en face aortas was analyzed (x; n=8 for Apoe−/−+Null or Apoe−/−+ATF3, n=11 for Apoe−/−Ldlr−/−+Null, and n=12 for Apoe−/−Ldlr−/−+ATF3). Representative images of aortic roots are shown (y) and the lesion size of aortic roots was quantified (z; n=8 for Apoe−/−+Null or Apoe−/−+ATF3, n=11 for Apoe−/−Ldlr−/−+Null, and n=12 for Apoe−/−Ldlr−/−+ATF3). In (t), for ATF3 expression, *P=0.012 and **P=0.00069 for Null versus ATF3 for Apoe−/−Ldlr−/− mice and Apoe−/− mice, respectively; for SR-BI expression, *P=0.019 and **P=0.0069 for Null versus ATF3 for Apoe−/−Ldlr−/− mice and Apoe−/− mice, respectively; for LDLR expression, **P=0.00051 for Null versus ATF3 for Apoe−/− mice or 0.00043 for Apoe−/− +Null versus Apoe−/−Ldlr−/−+Null; for CYP7A1 expression, **P=0.0036 or 0.0034 for Null versus ATF3 for Apoe−/− mice or Apoe−/−Ldlr−/− mice, respectively; for CYP8B1 expression, **P=0.0014 or 0.00046 for Null versus ATF3 for Apoe−/− mice or Apoe−/−Ldlr−/− mice, respectively. In (u), for HDL-C, **P=0.0037 or 0.0003 for Null versus ATF3 for Apoe−/− or Apoe−/−Ldlr−/− mice, respectively; for non-HDL-C, *P=0.035 for Null versus ATF3 for Apoe−/− mice or 0.017 for Apoe−/−+Null versus Apoe−/−Ldlr−/− +Null, and **P=0.000024 for Null versus ATF3 for Apoe−/−Ldlr−/− mice. In (v), **P=0.0083, 0.0024 or <1E-6 for Null versus ATF3 for Apoe−/− mice, Apoe−/−+Null versus Apoe−/−Ldlr−/−+Null mice, or Null versus ATF3 for Apoe−/−Ldlr−/− mice, respectively. In (x), *P=0.013 for Null versus ATF3 for Apoe−/− mice, and **P=0.0015 or <1E-6 for Apoe−/−+Null versus Apoe−/−Ldlr−/−+Null mice, or Null versus ATF3 for Apoe−/−Ldlr−/− mice, respectively. In (z), *P=0.048 and **P=0.00021 for Null versus ATF3 for Apoe−/− mice and Apoe−/−Ldlr−/− mice, respectively.
All the data are expressed as mean±SEM. All the data points are biological replicates. A two-tailed Student’s t-test (b-e, g, i, k-n, p, r) or two-way ANOVA with Turkey’s post hoc test for multiple comparison (t-v, x, z) was used for statistical analysis. In (h, q, y), scale bars represent 200 μm. See also Extended Data Fig. 9.
When human ATF3 was over-expressed in the liver of Ldlr−/− mice, the data acquired were similar to those collected from Apoe−/− mice. ATF3 over-expression induced hepatic ATF3, SR-BI, CYP7A1 and ApoE protein levels by 2.9-7.4 fold but repressed CYP8B1 protein expression by 57% (Fig. 6j and 6k) with food intake or body weight being unchanged (Extended Data Fig. 9i). ATF3 also reduced plasma levels of HDL-C, non-HDL-C, TG, total cholesterol, LDL-C, ApoA-I and ApoB (Fig. 6l–n and Extended Data Fig. 9j–m), and lowered plasma ALT and AST levels (Extended Data Fig. 9n). In addition, ATF3 over-expression decreased the lesion sizes of en face aortas (Fig. 6o and 6p) or aortic roots (Fig. 6q and 6r) by 53% and 50%, respectively.
Finally, we investigated whether the simultaneous induction of both ApoE and LDLR was important for ATF3 to inhibit the development of atherosclerosis by using mice lacking both Apoe and Ldlr (Apoe−/−Ldlr−/− mice). Apoe−/−Ldlr−/− mice were generated by i.v. injecting Apoe−/− mice with AAV8-hAAT-D377Y/mPCSK9, an AAV that has been shown to inhibit hepatic LDLR expression by >95% 54. AAV8-mediated over-expression of ATF3 did not affect food intake or body weight gain (Extended Data Fig. 9o), and regulated hepatic gene expression (Fig. 6s and 6t), plasma levels of total cholesterol, LDL-C, HDL-C, non-HDL, TG, ApoAI, ApoB or lipoprotein profiles (Figs. 6u and 6v; Extended Data Fig. 9p–s), and plasma ALT and AST levels (Extended Data Fig. 9t) in a manner similar to those observed in Apoe−/− or Ldlr−/− mice. Importantly, ATF3 reduced the atherosclerotic lesions in the en face aortas and aortic roots by 67.5% and 44%, respectively (Fig. 6w–z), suggesting that the induction of ApoE or LDLR does not play a role in ATF3-mediated inhibition of atherogenesis.
Taken together, the studies using mice lacking ApoE and/or LDLR show that gain of hepatocyte ATF3 function markedly attenuates the development of atherosclerosis via a mechanism independent of induction of ApoE or LDLR.
Loss of hepatocyte ATF3 aggravates the development of atherosclerosis in Apoe−/− mice
The data of Figs. 2–5 show that loss of hepatocyte ATF3 reduces plasma HDL uptake and macrophage RCT but increases intestinal fat and cholesterol absorption. In addition, hepatic ATF3 protein levels were markedly reduced in Western diet-fed wild-type, Apoe−/− or Ldlr−/− mice (Extended Data Fig. 10a). These data suggest that loss of hepatic ATF3 may play a role in the pathogenesis of atherosclerosis. To test this hypothesis, we generated Apoe−/− mice lacking hepatocyte Atf3 (L-Atf3−/−Apoe−/− mice) as well as the control littermates (Atf3fl/flApoe−/− mice), which were subsequently fed a Western diet for 3 months. In L-Atf3−/−Apoe−/− mice, hepatic ATF3, SR-BI, and CYP7A1 protein levels were reduced by 81%, 66% and 78%, respectively, whereas hepatic CYP8B1 protein levels were increased by 310% (Fig. 7a and 7b). Consistent with the gene expression data, plasma levels of total cholesterol (Extended Data Fig.10b), HDL-C (Fig. 7c), non-HDL-C (Fig. 7d) and TG (Fig. 7e) were increased by 145%, 190%, 155%, and 139%, respectively in L-Atf3−/−Apoe−/− mice. Analysis of plasma lipoprotein profile by FPLC showed that hepatic Atf3 ablation led to increased plasma VLDL-C, LDL-C and HDL-C (Extended Data Fig.10c) as well as VLDL-TG (Extended Data 10d). Hepatic ATF3 ablation also increased plasma ALT and AST levels (Extended Data Fig. 10e), suggesting that loss of hepatocyte ATF3 aggravates liver damage in Apoe−/− mice. Importantly, loss of hepatocyte ATF3 increased the plaque sizes of en face aortas (Fig. 7f and 7g) and aortic roots (Fig. 7h and 7i) by 200% and 157%, respectively. Thus, loss of hepatocyte ATF3 aggravates the development of atherosclerosis.
Figure 7. Ablation of hepatocyte ATF3 aggravates the development of atherosclerosis.

a-i. Six-weeks-old Atf3fl/flApoe−/− mice and L-Atf3−/−Apoe−/− mice were fed a Western diet for 3 months (n=8). Hepatic proteins were analyzed by Western blot assays (a) and protein levels were quantified (b; n=4). Plasma levels of HDL-C (c), non-HDL-C (d) or TG (e) were measured. Representative images of en face aortas are shown (f) and the lesion size of en face aortas was determined (g). Representative images of aortic roots are presented (h) and the lesion size of aortic roots was quantified (i). In (b), *P=0.044 and **P=0.00086, 0.000041 or 0.0024 versus Atf3fl/flApoe−/− for CYP7A1, ATF3, SR-BI or CYP8B1 expression, respectively. In (c), *P=0.013 versus Atf3fl/flApoe−/−. In (d), **P=0.0005 versus Atf3fl/flApoe−/−. In (e), *P=0.038 versus Atf3fl/flApoe−/−. In (g), **P=0.0011 versus Atf3fl/flApoe−/−. In (i), *P=0.0207 versus Atf3fl/flApoe−/−. j. A model for hepatocyte ATF3 to regulate the development of atherosclerosis. Hepatocyte ATF3 induces SR-BI expression via interaction with p53 and represses CYP8B1 expression via interaction with HNF4α. In addition, ATF3 also induces hepatic CYP7A1 expression via LXRα, and LDLR expression. As a result, over-expression of hepatocyte ATF3 increases cholesterol uptake from circulation and reduces intestinal cholesterol/fat absorption. These changes result in increased macrophage reverse cholesterol transport and protection against atherosclerosis. In contrast, loss of hepatocyte ATF3 has opposite effects. Interestingly, stress-related hormones, such as cortisol, inhibit hepatocyte ATF3 expression.
All the data are expressed as mean±SEM. All the data points are biological replicates. A two-tailed Student’s t-test (b-e, g, i) was used for statistical analysis. In (h), scale bars represent 200 μm. See also Extended Data Fig. 10.
Discussion
Chronic stress has been known to increase the prevalence of atherosclerosis, but the underlying mechanism remains to be characterized. Interestingly, we find that hydrocortisone significantly represses ATF3 expression in hepatocytes by activation of the cAMP-PKA pathway. By using the gain- and loss-of-function approaches, we provide compelling evidence demonstrating that hepatocyte ATF3 is a key regulator of plasma HDL-C uptake, intestinal fat and cholesterol absorption, macrophage RCT, and atherosclerosis (Fig. 7j). Mechanistically, ATF3 regulates plasma HDL uptake via an ATF3-p53-SR-BI pathway while modulating intestinal fat and cholesterol absorption via an ATF3-HNF4α-CYP8B1 pathway (Fig. 7j).
Psychosocial stress may account for approximately 40% of atherosclerotic cardiovascular disease associated with unknown risk factors 17. By activating the sympathetic nervous system, the hypothalamic-pituitary-adrenal (HPA) axis, and the renin-angiotensin system, stress causes the release of various stress hormones such as corticosteroids, catecholamines, glucagon, growth hormone, and renin. The HPA axis is a tightly regulated system that responds to acute or chronic stress 25,55. As the end product of the HPA axis, cortisol may be one of the main driving factors to promote the incidence of CHD in humans 26–29 as inhibition of cortisol synthesis prevents atherosclerosis in mice 30. How cortisol promotes atherosclerosis remains unknown. In humans, corticosterone increases plasma HDL-C levels 33–36 whereas patients with adrenal insufficiency (a condition with impaired cortisol production) is associated with reduced plasma HDL-C levels 31,32, implying that cortisol could regulate HDL metabolism. Consistent with these findings in humans, we show that hydrocortisone increases plasma HDL-C levels and represses hepatic SR-BI expression by 72% in mice. Importantly, we show that hydrocortisone also represses SR-BI expression in human primary hepatocytes via a mechanism involving PKA activation. Since SR-BI deficiency is associated with increased CHD in humans 7 and aggravates the development of atherosclerosis in mice 5,56, cortisol may increase the incidence of CHD via, at least in part, repression of hepatic SR-BI expression. Interestingly, our data show that cortisol also markedly represses ATF3 expression in human or mouse hepatocytes, and that cortisol represses SR-BI expression and elevates plasma HDL-C levels via ATF3 in mice. In line with these observations, decreased ATF3 expression in the liver is strongly correlated with increased plasma HDL-C levels in humans. Thus, it is likely that cortisol reduces hepatic SR-BI expression and raises plasma HDL-C levels via repressing ATF3 expression in humans.
Given that SR-BI is the critical regulator of plasma HDL uptake, macrophage reverse cholesterol transport, and atherosclerosis 4–6,57–59, identification of positive regulators of SR-BI is of high significance. By using gain- and loss-of-function approaches, we demonstrate that hepatocyte ATF3 plays a key role in regulating hepatic SR-BI expression, HDL uptake, macrophage RCT and atherosclerosis. At the molecular level, ATF3 up-regulates hepatic SR-BI expression via interaction with p53. It will be interesting to investigate whether loss of function mutations in p53 are associated with a change in plasma HDL-C levels and CHD in humans.
In addition to promoting HDL uptake, we also demonstrate that ATF3 regulates BA metabolism. Bile acids play an important role in intestinal lipid absorption and metabolic regulation 48,60. Cholic acid is known to have the greatest capacity to promote cholesterol absorption whereas muricholic acids are the strongest inhibitors of cholesterol absorption in the intestine 61. Intestinal cholesterol absorption is one of the major components of RCT because ~ 50% of cholesterol secreted to the bile is reabsorbed in the intestine. Indeed, inhibition of intestinal cholesterol absorption promotes RCT 62–64. We show that ATF3 inhibits intestinal fat and cholesterol absorption via repressing hepatic CYP8B1 expression, which is consistent with previous findings that Cyp8b1−/− mice have reduced intestinal fat and cholesterol absorption 9,43,44. Based on the data from the atherosclerosis models, it is likely that the major beneficial effect of ATF3 on atherosclerosis is the lowering of atherogenic lipoproteins by mechanisms involving changes in bile acid metabolism, intestinal cholesterol and fat absorption, and hepatic VLDL secretion.
The induction of CYP7A1 by ATF3 results from the marked inhibition of CYP8B1, because 1) ATF3 inhibits CYP7A1 promoter activity, 2) Cyp8b1−/− mice have increased CYP7A1 expression 8, and 3) normalization of hepatic CYP8B1 expression prevents ATF3 from inducing CYP7A1 expression. The BA receptor FXR plays a critical role in feedback inhibition of both CYP7A1 and CYP8B1 expression and BA synthesis mainly by inducing SHP and FGF15/19 expression 48,49. Our data show that FXR signaling is not involved in ATF3-mediated regulation of CYP7A1 or CYP8B1 expression. Interestingly, we find that ATF3 induces CYP7A1 expression by a mechanism involving the induction of LXRα whereas the inhibition of CYP8B1 by ATF3 is via its interaction with HNF4α. Given that CYP8B1 ablation has beneficial effects on lipid homeostasis in mice 9,43,44, it would be intriguing to explore whether loss of function mutations in CYP8B1 is associated with improved metabolic homeostasis and ameliorated CHD in humans.
Another interesting finding from our studies is that ATF3 up-regulates hepatic expression of LDLR and ApoE, two of the important proteins critical for the pathogenesis of atherosclerosis. By using mice deficient in Apoe and/or Ldlr, we show that neither LDLR nor ApoE is important for ATF3 to inhibit the development of atherosclerosis. These data further corroborate our conclusion that ATF3 attenuates the development of atherosclerosis by increasing hepatic HDL-C uptake, reducing intestinal fat and cholesterol absorption, and promoting macrophage RCT. Lim et al. show that ATF3 binds to the LDLR promoter and represses LDLR promoter activity 65, but they do not show whether ATF3 regulates LDLR mRNA or protein levels. Our data show that ATF3 induces LDLR expression and LDL uptake in both human and mouse hepatocytes. Thus, ATF3 may induce LDLR expression via an indirect mechanism.
In summary, we have uncovered an intriguing pathway that links hepatocyte ATF3 to atherosclerosis. Hepatocyte ATF3 regulates macrophage RCT and atherosclerosis by modulating hepatic HDL uptake and intestinal cholesterol and fat absorption. These interesting findings suggest that ATF3 may be a promising target for treatment of atherosclerosis associated with metabolic disorders.
Methods
Human Tissues and Human Primary Hepatocytes
Human primary hepatocytes were provided by the Liver Tissue Cell Distribution System at University of Pittsburgh. Human liver tissues and paired plasma were collected at the Union Hospital of Tongji Medical College in Huazhong University of Science and Technology, China. The normal liver tissues were collected from subjects with hepatocellular carcinoma. Individuals with family history of hypercholesterolemia were excluded. The characteristics of participants are presented in Supplementary Table 1. All the studies were approved by the Institutional Review Board (IRB) at Northeast Ohio Medical University (for using human primary hepatocytes) or the Union Hospital of Tongji Medical College in Huazhong University of Science and Technology (for collecting human tissues). Informed consent was obtained from human participants and the collection of human tissues was approved by the IRB at the Union Hospital of Tongji Medical College in Huazhong University of Science and Technology.
Mice and Diets
Mice were housed at 20-22 °C in a temperature-controlled room on a 12-h light/12-h dark cycle with ad libitum access to food and water. 10-week-old male mice were used unless otherwise specified. All the mice were on a C57BL/6 background. When appropriate, littermate controls were used. C57BL/6J mice (stock # 000664), p53fl/fl mice (stock # 008462), Fxr−/− mice (stock # 004144), db/db mice (cat # 000697), ACTB:FLPe mice (stock # 019100), Hnf4αfl/fl mice (stock # 004665), Apoe−/− mice (stock # 002052) and Ldlr−/− mice (stock # 002207) were purchased from the Jackson Laboratory. Apoe−/−Ldlr−/− mice were generated by i.v. injection of Apoe−/− mice with AAV8-hAAT-D377Y/mPCSK9 54. Floxed Scarb1 (Srb1fl/fl) mice have been described previously 58. Atf3tm2a(EUCOMM)Wtsi mice (knockout first with conditional potential) were purchased from Mutant Mouse Resource & Research Centers (MMRRC; stock # MMRRC_037805-UCD). Atf3tm2a(EUCOMM)Wtsi mice were crossed with ACTB:FLPe mice to remove the Frt-flanked LacZ-Neo cassette, resulting in floxed Atf3 mice. Floxed Atf3 mice were then crossed with Apoe−/− mice to generate Atf3fl/flApoe−/− mice. Atf3fl/fl mice, p53fl/fl mice, Hnf4afl/fl mice, Srb1fl/fl mice or Atf3fl/flApoe−/− mice were intravenously (i.v.) injected with 2x10¹¹ genome copies (gc) of AAV8-TBG-Null or AAV8-TBG-Cre (Vector BioLabs) to generate the control floxed mice and hepatocyte-specific knockout mice, respectively, including L-Atf3−/− mice, L-p53 mice, L-Hnf4α mice, L-Srb1−/− mice, and L-Atf3−/−Apoe−/− mice. These mice were fed either a chow diet or a Western diet containing 42% fat and 0.2% cholesterol (Envigo; Cat # TD.88137). Unless otherwise stated, all mice were fasted for 5-6 h prior to euthanasia. All the studies were approved by the Institutional Animal Care and Use Committee at Northeast Ohio Medical University and were in accordance with NIH guidelines for the care and use of laboratory animals.
Chemicals
The following chemicals were purchased from Sigma: angiotensin II (cat # A9525), dexamethasone (cat # D4902), dibutyryl cyclic-AMP sodium salt (cat # D0627), forskolin (cat # F6886), glucagon (cat # G2044), hydrocortisone (cat # H0888), InSolution H-89 dihydrochloride (cat # 371962), PKA Inhibitor 14-22 Amide (cat # 476485), and tyloxapol (cat # T0307). 14C-cholesterol (cat # NEC018050UC), 3H-cholesterol (cat # NET139001MC), 3H-cholesteryl oleate (cat # NET746L001MC) and 3H-triolein (cat # NET431001MC) were purchased from PerkinElmer.
Adenoviruses and Adeno-associated Viruses
Adenoviruses expressing human ATF3 with C-terminal Flag and His tags (Ad-hATF3) were purchased from Vigene (cat # VH804537). Ad-p53 was purchased from Vector Biolabs (cat # 1168) 66. Ad-SR-BI expressing mouse SR-BI has been described previously 67. Adenoviruses expressing shRNA against mouse/human ATF3 (Ad-shATF3) or Lxrα (Ad-shLxrα) were generated using the BLOCK-iT Adenoviral RNAi Expression System following the manufacturer’s instructions (Invitrogen, CA). The targeting sequences for Atf3 or Lxrα were 5’-GACACCCTTTGTCAAGGAAGA-3’ and 5’-GTGTTTGCCCTTCGCCTGCAG-3’, respectively. All the adenoviruses were grown in 293A cells and purified by cesium chloride (CsCl) gradient centrifugation in 1.25 g/ml and 1.35 g/ml CsCl (in 10 mM Tris-HCl, pH 8.1), respectively, followed by dialysis against the dialysis buffer (1 mM MgCl2, 10 mM Tris-HCl (pH 8.1)). Mice were intravenously injected with 1x10⁹ pfu adenoviruses. Unless otherwise stated, the mice were euthanized 7 days post injection. Human ATF3 or CYP8B1 cDNA sequences were cloned into an AAV vector under the control of a mouse albumin promoter to generate AAV-ALB-hATF3 or AAV-ALB-hCYP8B1, respectively, 68. pAAV-hAAT-D377Y/mPCSK9 expressing a gain-of-function of mutant murine PCSK9 54 was purchased from Addgene (cat # 58376). AAV8-ALB-hATF3, AAV8-ALB-hCYP8B1, AAV8-hAAT-D337Y/mPCSK9 or AAV8-ALB-Null (control) was packaged in serotype 8 and titrated by Vector BioLabs. Each mouse was i.v. injected with 1x10¹¹ GC AAV8-ALB-hCYP8B1 or 3 x 10¹¹ GC other AAVs and then fed a chow or Western diet for differing periods as indicated in the figure legends.
mRNA, qPCR and RNA Sequencing
RNA was extracted using Trizol Reagent (Thermo Fisher) and mRNA levels were quantified by quantitative real-time PCR (qRT-PCR) using PowerUP SYBR Green Master Mix (ThermoFisher; cat # A25778) on a 7500 Real Time PCR machine (Applied Biosystems). mRNA levels were normalized to 36B4 or GAPDH. The primer sequences for qPCR are presented in Supplementary Table 2.
To perform RNA sequencing, total RNA was isolated from livers of mice infected with AAV8-ALB-Null (n=4) or AAV-ALB-hATF3 (n=4) using an miRVana miRNA Isolation kit (ThermoFisher, cat # AM1560). cDNA libraries were constructed using the Illumina TruSeq Stranded Total RNA Library Prep kit (cat #20020596) following the manufacturer’s instructions. RNA sequencing was run on NextSeq 500 (Illumina). Sequencing data were processed in the BaseSpace Sequencing Hub. Briefly, sequenced reads were trimmed for adaptor sequences, and mapped to the mouse mm10 whole genome using RNA-Seq Alignment V2.0.2. Reads per kilobase transcript per million mapped reads (RPKM) and transcripts per million (TPM) were collected using Illumina RNA-Seq Differential Expression Version 1.0.1. Genes that were significantly changed by >1.4 fold with an FDR-adjusted P value <0.05 were presented in Source Data 1 of Supplementary Information. Heatmap was compiled using Qlucore Omics Explore 3.5 (Qlucore). The RNA-Seq data have been deposited in the GEO repository (accession # GSE148301).
Protein Extraction, Immunoblotting and Immunoprecipitation
Tissues were homogenized in a buffer containing 50 mM HEPES (pH 7.5), 300 mM NaCl, 1 mM MgCl2, 1 mM CaCl2, 10 mM sodium pyrophosphate, 10 mM sodium EDTA, 1% NP-40, 10 mg/ml aprotinin, 0.2 mM EGTA, 20% glycerol and proteinase inhibitors. Cells were lysed in RIPA buffer (EMD Millipore). Lysates were incubated at 4 °C for 1 h and supernatant was collected after centrifugation at 15,000g for 30 minutes. To collect membrane proteins, the supernatant was centrifuged at 100,000 g at 4 °C for 30 min. Protein lysates were used for Western blotting, or incubated with a primary antibody or IgG at 4 °C overnight for immunoprecipitation using Protein A Agarose (EMD Millipore; cat # 16-157). Proteins were separated by SDS-PAGE, transferred to a PVDF membrane (EMD Millipore), and incubated with a primary antibody prior to incubation with a secondary antibody. Antibodies against p53 (cat # sc-6243) or MTP (cat # sc-135994) were purchased from Santa Cruz Biotechnology. Antibodies against ApoE (cat # NB110-60531), ATF3 (NBP1-85816), calnexin (cat # NB100-1965), LDLR (cat # NBP1-06709) or SR-BI (cat # NB400-101) were purchased from Novus. Antibodies against ATF3 (cat # ab207434) or tubulin (cat # ab4074) were purchased from Abcam. Antibodies against CYP7A1 (cat # TA351400) or CYP8B1 (cat # TA313734) were purchased from Origene. Anti-ApoB antibody or anti-FLAG antibody was purchased from Meridian Life Science (cat # K45253G) or Sigma (cat # F1804), respectively. For detection of CYP7A1 proteins, we also used a CYP7A1 antibody provided by Dr. David Russell from University of Texas Southwestern Medical Center. Tubulin antibody was used at 1:5,000 dilution, and other primary antibodies were used at 1:1,000 dilution. Western blot images were captured by Amersham Imager 680. Quantification of immunoblots was performed using ImageJ 1.51j8. Unedited immunoblotting gel images can be found in Source Data.
Plasmid Construction, Cell Culture, and Transfection
The DNA fragments containing SR-BI, Cyp7a1, or Cyp8b1 promoter sequences were cloned into to the pGL3-basic vector (Promega; cat # E1751). Mutagenesis was performed using a QuickChange Site-Directed Mutagenesis kit (Agilent; cat # 200523) and the mutations were confirmed by sequencing. The mutant sequences in SR-BI or Cyp8b1 promoters (shown in lowercase) are: 5’-GGCGCCCAAAGGAAGCttttCCCACGCCT CACCATCAGAGCACCGC-3’ and 5’-ACCACG TCCGAGCCTCTcAGCAAAcTCCAAttGCAGGAACCTTTGCATTGCC-3’, respectively. Mouse primary hepatocytes were isolated as described previously 69. Human or mouse primary hepatocytes were cultured in DMEM and then treated with various hormones/chemicals or vehicle (DMSO). HepG2 cells were purchased from ATCC (cat # HB-8065) and were free of mycoplasma. Transfection assays were performed using Lipofectamine 3000 following the manufacturer’s instructions (Thermo Fisher) 70. Luciferase activity was determined and normalized to β-galactosidase activity.
Immunohistochemical Staining
Heart was perfused, fixed in 10% formalin, embedded in optical cutting temperature compound (OCT) and sectioned. Sections of aortic roots were incubated with primary and then secondary antibodies following the instructions of the Vectastain Elite ABC-HRP kit (Cat # PK-6104. Vector Laboratories) 71. Anti-MOMA2 antibody was purchased from Bio-Rad (Cat # MCA519G) and was used at 1:50 dilution.
Hepatic VLDL Secretion and Intestinal Fat or Cholesterol Absorption
VLDL secretion was performed after mice were fasted for 6 h, followed by i.v. injection of 100-200 μl of Tyloxapol (500 mg/kg) to inhibit lipolysis. Blood was collected at indicated time points and plasma TG levels were determined.
To determine intestinal fat absorption, mice were fasted for 4-6 h and then i.v. injected with 100-200 μl Tyloxapol (500 mg/kg). Two complementary methods were used as described 72–74. In the first method, mice were gavaged with 200 μl olive oil containing 7 μCi 3H-triolein (PerkinElmer), and plasma radioactivity at different time points was determined as described 72,73. In the second method, mice were gavaged with olive oil (15 μl/g body weight), and plasma TG levels at different time points were determined 74. Both methods produced similar results.
We used a dual-isotope plasma ratio method to determine intestinal cholesterol absorption as described 75,76. Briefly, mice were i.v. injected with 2.5 μCi 3H-cholesterol dissolved in 160 μl Intralipid (Sigma, cat #I141), and then gavaged with 1 μCi 14C-cholesterol dissolved in 0.2 ml of medium chain triglyceride (MCT) oil. After 72 h, plasma was collected for determination of 3H and 14C activity. Cholesterol absorption was calculated using the formula: % cholesterol absorption = (% of gavage dose)/(% of intravenous dose)*100.
Plasma Biochemistry, FPLC and Biliary Bile Acid Composition
Plasma TG (cat # TR22421), total cholesterol (cat # TR13421), ALT (TR71121) and AST (TR70121) were measured using Infinity reagents (Thermo Scientific). Plasma total bile acids were measured using a Total Bile Acid Test kit (Diazyme; cat #DZ042A-K). Plasma HDL-C levels were measured using an HDL and LDL/VLDL quantification kit (cat # K613, Biovision Inc). Plasma LDL-C levels were measured using a kit from Diazyme (DZ128A-KY1). Plasma ApoA-I (cat # EKF58103) and ApoB (cat # EKE61526) levels were measured using ELISA kits from Biomatic (Ontario, Canada). Bile acid composition in the bile was measured by HPLC according to the method of Rossi et al 77,78. Plasma lipoproteins were separated by Biologic DuoFlow QuadTec 10 System (Bio-Rad) and TG or cholesterol levels in individual fractions were quantified. Hepatic lipids were extracted in chloroform/methanol (2:1, v/v), and 0.043% magnesium chloride was added. Lipids in the chloroform layer was used for radioactivity measurement.
Electrophoretic Mobility Shift Assay (EMSA)
SR-BI oligonucleotides containing wild-type or mutant p53 binding sites were synthesized and labeled by biotin on the 3′ end following the manufacturer’s instruction (ThermoFisher Scientific; cat # 89818). The wild-type and mutant SR-BI oligonucleotide sequences are: 5’-GGCGCCCAAA GGAAGCCACGCCCACGCCTCACCATCAGAGCACCGC-3’ and 5’-GGCGCCCAAAGGAA GCttttCCCACGCCTCACCATCAGAGCACCGC-3’, respectively. EMSA was performed using a kit according to the manufacturer’s instructions (ThermoFisher Scientific; cat # 20148). 293A cell lysate overexpressing p53 was used for incubation with probes for one hour on ice. Competition studies were performed by adding unlabeled wild-type or mutant oligonucleotides. For the supershift assay, 293A cell lysates were incubated with the probe first, followed by incubation with a p53 antibody. Same amount of IgG was used as the negative control. We have repeated EMSA once.
Chromatin Immunoprecipitation (ChIP) Assay
Livers of mice infected with Ad-Empty, Ad-ATF3 or Ad-p53 were homogenized in cold 1xPBS containing the protease inhibitor cocktail (Roche, NJ), 2 μg/ml PMSF, 1 mM EDTA and 1 mM EGTA. Chromatin immunoprecipitation was carried out using a ChIP assay kit (cat # 17-295. Millipore, MA) according to the manufacturer’s protocol with minor modifications 71. Briefly, the liver homogenate was filtered to remove debris and then crosslinked with 1% formaldehyde. After sonication and preclearance with Protein A beads, sheared chromatin was then immunoprecipitated using an IgG or an antibody against p53 or ATF3. After elution, the precipitated DNA/antibody complex was digested with proteinase K. DNA was then extracted and used for qPCR analysis with primers flanking the p53 binding site in the SR-BI promoter or the HNF4a binding site in the Cyp8b1 promoter. The supernatant before immunoprecipitation of each sample was used as its own input control.
Macrophage Reverse Cholesterol Transport
Reverse cholesterol transport (RCT) was performed as described previously 4,76,79,80. In brief, peritoneal macrophages were isolated and incubated in DMEM containing 10% FBS, 5 μCi/ml [3H]cholesterol and 25 μg/ml Ac-LDL for 48 h, followed by wash in PBS and equilibration for 4 h in DMEM supplemented with 0.2% BSA and penicillin/streptomycin. Before injection, cells were pelleted and re-suspended in serum-free DMEM. 0.5 ml of macrophages (~ 5x10⁶ cells) containing ~ 6.5-10x106 counts per minute (cpm) were injected intraperitoneally into wild-type mice. After 48 h, lipids in the liver and feces were extracted after homogenization. Plasma, hepatic and fecal 3H-tracers were assayed by scintillation counting and values are expressed as a percentage of total injected radioactivity.
Lipoprotein Uptake
Purified HDL (cat #J64903) and LDL (cat #J65029) as well as lipoprotein deficient serum (LPDS) (cat #J65516) were purchased from Alfa Aesar. HDL and LDL labeling and uptake were performed as described 81 with some modifications. Briefly, 20 μCi [14C]cholesteryl oleate (Perkin Elmer) was dried down in a glass tube, followed by addition of 2 ml of LPDS and 2 mg HDL or LDL. The mixture was incubated on a roller at 4 °C for 30 min. After adjustment of the mixture density to 1.063 g/ml or 1.21 g/ml with solid potassium bromide, the labeled lipoproteins were recovered by ultracentrifugation for 10 h at 100,000g, dialyzed against NaCl (0.15 mM)/Na2EDTA (1 mM) (pH 7.4), and sterile filtered. The radioactivity of the labeled lipoproteins was determined by a liquid scintillation counter (LSC). For the in vitro HDL or LDL uptake study, isolated primary hepatocytes or HepG2 cells, which were plated on a 24-well plate and cultured in serum-free DMEM plus 0.5% BSA, were incubated with radiolabeled HDL or LDL for 2 h or 4 h. After 3 times wash with PBS, the radioactivity in the cells was measured by an LSC and normalized to total amount of cell proteins. For the in vivo HDL uptake study, each mouse was i.v. injected with 56,000 cpm of radiolabeled HDL. After 24 h, lipids in the liver and feces were extracted. The radioactivity in the liver or feces was determined and values are expressed as a percentage of total injected radioactivity.
Atherosclerosis
Anesthetized mice were perfused with PBS via the left ventricle. The aorta, including the ascending arch, thoracic, and abdominal segments, and aortic root were isolated and gently cleaned of the adventitia. The aortic roots were washed with PBS, embedded in optical cutting temperature compound, and frozen on dry ice. Serial 10-μm-thick cryosections were collected on superfrost plus microscope slides. Sectioned aortic roots or en face aortas were stained with oil red O and the atherosclerotic plaque size determined using the Image-Pro 9.1 software (Media Cybernetics).
Statistical Analysis
We used GraphPad Prism 8.4.2 (GraphPad, CA) for statistical analysis. Normality and equal variances tests were performed. If data passed both tests, we used unpaired Student t test followed by Welch’s corrections. If the sample did not pass normality or equal variance test, statistical analyses were performed using unpaired Mann-Whitney U test. A two-tailed Pearson correlation analysis was performed to analyze the correlation between hepatic gene expression and plasma HDL-C levels. For more than two groups, one-way or two-way analysis of variance (ANOVA) with a post hoc Turkey’s or Dunnett’s test for multiple comparisons was performed. For the RNA-Seq study, a false discovery rate (FDR)-adjusted P-value (q-value) was calculated after correction for multiple testing. Measurements were taken from distinct samples. Sample size was based on statistical analysis of variance and prior experience with similar studies. All values are expressed as mean±SEM or mean±SD (only for studies on intestinal fat absorption or VLDL secretion). P values were calculated with confidence intervals of 95% and differences were considered statistically significant at P<0.05. For the RNA sequencing study, differences were considered significant when the FDR-adjusted P value was less than 0.05. Except for the atherosclerosis studies, all other studies were repeated once with similar results.
Extended Data
Extended Data Fig. 1. Hepatic ATF3 is repressed by stress signaling.

a. Mouse or human primary hepatocytes were treated with vehicle (Veh), 500 nM angiotensin II (A-II), 500 nM dexamethasone (DEX), 250 μM forskolin (FSK), 100 nM glucagon (GCG) or 250 nM hydrocortisone (HC) (n=4). After 24 h, protein levels were determined. **P<1E-6 for Veh versus A-II, DEX, FSK, GCG or HC, respectively for mouse or human primary hepatocytes.
b. HepG2 cells were treated with vehicle, angiotensin II (A-II), dexamethasone (DEX), forskolin (FSK), glucagon (GCG) or hydrocortisone (HC) as described in (a) (n=4). mRNA levels were determined after 6 h (top panel) and protein levels were determined after 24 h (bottom panel). **P=0.000019, 3E-6, 1E-6, 0.0031 or 2E-6 for Veh versus A-II, DEX, FSK, GSK or HC, respectively.
c-f. Mouse primary hepatocytes (c; n=4), human primary hepatocytes (d; n=3 for Veh group and n=4 for cAMP group) or HepG2 cells (e and f; n=4) were treated with vehicle (Veh) or 500 μM db-cAMP (cAMP). mRNA levels were analyzed after 6 h (c-e) and protein levels in HepG2 cells were analyzed after 24 h (f). In (c), **P=0.0034 versus Veh. In (d), **P=0.000051 versus Veh. In (e), *P=0.01 versus Veh.
g and h. Mouse (g) or human (h) primary hepatocytes were pretreated with 10 μM H89 or 1 μM PKI 14-22 (PKI) for 2 h, followed by treatment with hydrocortisone (HC) for 6 h. mRNA levels were determined (n=4). In (g), **P<1E-6 for HC versus Veh, HC+H89 or HC+PKI, respectively. In (h), *P=0.04 for HC versus Veh, and **P=0.0061 or 0.0016 for HC versus HC+H89 or HC+PKI, respectively.
i. C57BL/6J mice were i.p. injected with either vehicle or hydrocortisone (HC; 2mg/kg) once a day for 7 days (n=8). Plasma cholesterol lipoprotein profile was analyzed by FPLC.
j-l. Atf3fl/fl mice and hepatocyte-specific Atf3−/− (L-Atf3−/−) mice were i.p. injected with either vehicle or hydrocortisone (HC; 2mg/kg) once a day for 7 days. Hepatic mRNA levels were determined (j; n=8 for the L-Atf3−/−+HC group, and n=7 for 3 other groups). Plasma cholesterol lipoprotein profile was analyzed (k). Plasma ALT (left panel) and ASL (right panel) (l) levels were determined (n=6 for the L-Atf3−/−+Vehicle group, and n=7 for 3 other groups). In (j), for Atf3 expression, **P=0.002 or 0.000072 for Atf3fl/fl+HC versus Atf3fl/fl+Veh or L-Atf3−/−+HC, respectively. For Scarb1 expression, **P=2E-6 or <1E-6 for Atf3fl/fl+HC versus Atf3fl/fl+Veh or L-Atf3−/−+HC, respectively. For Cyp7a1 expression, **P=1E-6 or <1E-6 for Atf3fl/fl+HC versus Atf3fl/fl+Veh or L-Atf3−/−+HC, respectively. For Cyp8b1 expression, **P=0.0014 or 2E-6 for Atf3fl/fl+HC versus Atf3fl/fl+Veh or L-Atf3−/−+HC, respectively. In (l), for ALT, P=0.94 or 0.89 for vehicle versus HC for Atf3fl/fl or L-Atf3−/−mice, respectively. For AST, P=0.98 or 0.99 for vehicle versus HC for Atf3fl/fl or L-Atf3−/−mice, respectively.
m. C57BL/6J mice were i.p. injected with either vehicle or hydrocortisone (HC; 2mg/kg) once a day for 7 days (n=8). The correlation between hepatic Atf3 mRNA and plasma HDL-C levels was determined.
All the data are expressed as mean±SEM. All the data points are biological replicates. A two-tailed Student’s t-test (c-e), one-way (a, b, g, h) or two-way (j, l) ANOVA with Turkey’s post hoc test for multiple comparisons, or a two-tailed Pearson correlation analysis (m) was used for statistical analysis. NS, not significant.
Extended Data Fig. 2. Over-expression of hepatic ATF3 reduces plasma HDL-C levels and bile acid hydrophobicity indices in C57BL/6J mice.

C57BL/6J mice were i.v. injected with AAV8-ALB-Null or AAV8-ALB-hATF3 (n=8). After 2 months, mice were euthanized.
a-d. Plasma levels of triglyceride (TG), total cholesterol (TC) (a), HDL-C, non-HDL-C (b), ALT and AST (c) were quantified. Plasma cholesterol lipoprotein profile was analyzed by FPLC (d). Chol, cholesterol. In (a), **P=0.00024 versus AAV-Null for TC. In (b), **P=0.00009 versus AAV-Null for HDL. In (c), **P=0.0024 versus AAV-Null for ALT, and P=0.079 for AAV-Null versus AAV-ATF3 for AST.
e. RNA sequencing was performed using liver samples (n=4 per group). The volcano plot shows many hepatic genes were differentially regulated by ATF3.
f-i. Hepatic mRNA levels were quantified by qRT-PCR (f; n=8). Hepatic proteins were analyzed by Western blot assays (g, h) and protein levels were quantified (i; n=6). In (f), **P=0.000013, 0.00014, 0.00053, 0.00015 or 0.0021 versus AAV-Null for Cyp7a1, Cyp8b1, Scarb1, Ldlr and Apoe expression, respectively. In (i), *P=0.022 versus AAV-Null for LDLR, and **P=0.00026, 0.0012, 0.0046, 0.004 or 0.0032 versus AAV-Null for CYP7A1, CYP8B1, ATF3 and ApoE expression, respectively.
j and k. Plasma total bile acid (BA) levels (j; n=8) and biliary BA composition (k; n=8 for the Null group, and n=7 for the ATF3 group) were determined. TUDC, tauroursodeoxycholic acid. TCA, taurocholic acid. TCDCA, taurochenodeoxycholic acid. In (j), *P=0.025 versus Null. In (k), *P=0.012 and **P=0.0027 or 0.0006 versus AAV-Null for TCDCA, TUDC or TCA, respectively.
l. HepG2 cells were transfected with the pGL3-Cyp7a1 or pGL3-Cyp8b1 luciferase promoters together with pCMV-ATF3 (n=8) or pCMV-Empty (n=7). After 36 h, relative luciferase units (RLU) were determined. **P=0.0063 or 0.00018 versus CMV-Empty for pGL3-Cyp7a1 or pGL3-Cyp8b1, respectively.
All the data are expressed as mean±SEM. All the data points are biological replicates. A two-tailed Student’s t-test (a, c, f, i-l) or two-way ANOVA with Turkey’s post hoc test for multiple comparisons (b) was used for statistical analysis.
Extended Data Fig. 3. Over-expression of hepatic ATF3 reduces plasma HDL-C and LDL-C levels and increases plasma bile acid levels in db/db mice.

db/db mice were i.v. injected with AAV8-ALB-Null or AAV8-ALB-hATF3 (n=8). After 2 months, mice were euthanized.
a-d. Plasma total cholesterol (Chol) (a), HDL-C, non-HDL-C (b), ALT and AST (c) levels were determined. Plasma cholesterol lipoprotein profile was analyzed by FPLC (d). In (a), *P=0.01 versus Null. In (b), **P=0.0012 or 0.000021 versus AAV-Null for HDL or non-HDL, respectively. In (c), *P=0.02 or 0.027 versus AAV-Null for ALT or AST, respectively.
e. Plasma bile acid (BA) levels. *P=0.042 versus Null.
f and g. Hepatic proteins were analyzed by Western blot assays (f) and protein levels were quantified (g). **P=3E-6, 8E-6, 0.00074, 7E-6, 0.0039 or 0.0065 versus AAV-Null for CYP7A1, CYP8B1, ATF3, SR-BI, LDLR or ApoE expression, respectively.
All the data are expressed as mean±SEM. All the data points are biological replicates. A two-tailed Student’s t-test (a, c, e, g) or two-way ANOVA with Turkey’s post hoc test for multiple comparisons (b) was used for statistical analysis.
Extended Data Fig. 4. Loss of hepatocyte ATF3 increases plasma HDL-C levels and reduces plasma bile acid levels.

Atf3fl/fl mice and hepatocyte-specific Atf3−/− (L-Atf3−/−) mice were fed a chow diet (n=6).
a-d. Plasma total cholesterol (Chol) (a), HDL, non-HDL-C (b), ALT and AST (c) levels were determined. Plasma cholesterol lipoprotein profile was analyzed by FPLC (d). In (a), **P=0.0036 versus Atf3fl/fl. In (b), **P=0.00075 for Atf3fl/fl versus L-Atf3−/− for HDL. In (c), P=0.49 or 0.28 for Atf3fl/fl versus L-Atf3−/− for ALT or AST, respectively.
e. Plasma bile acid (BA) levels. *P=0.019 versus Atf3fl/fl.
f and g. Hepatic proteins were analyzed by Western blot assays (f) and protein levels were quantified (g). **P=2E-6, 0.000099, 0.000035 or 0.000376 versus Atf3fl/fl for ATF3, CYP7A1, CYP8B1 or SR-BI expression, respectively.
h. Hepatic mRNA levels were determined by qRT-PCR. P=0.12, 0.25 or 0.1 for Atf3fl/fl versus L-Atf3−/− for Srebp2, Hmgcr, or Hmgcs expression, respectively.
All the data are expressed as mean±SEM. All the data points are biological replicates. A two-tailed Student’s t-test (a, c, e, g, h) or two-way ANOVA with Turkey’s post hoc test for multiple comparisons (b) was used for statistical analysis.
Extended Data Fig. 5. ATF3 regulates HDL-C and LDL-C uptake by hepatocytes.

a and b. Scarb1fl/fl (Srb1fl/fl) or hepatocyte-specific Scarb1−/− (L-Srb1−/−) mice were i.v. injected with AAV8-ALB-Null or AAV8-ALB-hATF3 (a). In a separate study, Atf3+/+ or Atf3−/− mice were i.v. injected with 0.5x10⁹ pfu Ad-Empty or Ad-SR-BI (b). After 10 days, primary hepatocytes were isolated from these mice. HDL uptake was carried out after hepatocytes were treated for 4 h with HDL labeled with [14C]cholesteryl Oleate (14C-HDL) (n=5) (a, b). In (a), *P=4E-6 or <1E-6 for Srb1fl/fl+AAV-Null versus Srb1fl/fl+AAV-ATF3 or L-Srb1−/−+AAV-Null, respectively. In (b), **P<1E-6 for Atf3−/−+Ad-Empty versus Atf3+/++Ad-Empty, Atf3+/++Ad-SR-BI or Atf3−/−+Ad-SR-BI.
c and d. Ldlr+/+ mice and Ldlr−/− mice were i.v. injected with AAV8-ALB-Null or AAV8-ALB-hATF3. After 10 days, primary hepatocytes were isolated. LDL uptake was carried out after hepatocytes were treated for 2 h (c, left panel) or 4 h (c, right panel) with LDL labeled with [14C]cholesteryl Oleate (14C-LDL) (n=5). Western blot assays were performed (d, left panel) and LDLR protein levels were quantified (d, right panel). In (c, left panel), **P=0.00002 or <1E-6 for Ldlr+/++AAV-Null versus Ldlr+/++AAV-ATF3 or Ldlr−/−+AAV-Null, respectively. In (c, right panel), *P=0.000011 or <1E-6 for Ldlr+/++AAV-Null versus Ldlr+/++AAV-ATF3 or Ldlr−/−+AAV-Null, respectively. In (d), *P=0.0038 versus Null.
e. Mouse primary hepatocytes were isolated from Atf3fl/fl or L-Atf3−/− mice. LDL uptake was carried out after hepatocytes were treated for 2 or 4 h with LDL labeled with [14C]cholesteryl Oleate (14C-LDL) (n=5). P=0.36 or 0.58 for Atf3+/+versus Atf3−/− at 2 h or 4 h, respectively.
f and g. HepG2 cells were infected with Ad-Empty or Ad-ATF3 for 24 h. Western blot assays (f) and LDL uptake (g) were performed as described above (n=5). In (f), *P=0.04 versus Empty. In (g), **P=0.0016 or 0.000013 for Ad-Empty versus Ad-ATF3 at 2 h or 4 h, respectively. h and i. HepG2 cells were infected with Ad-shLacZ or Ad-shATF3 for 24 h. Protein levels were determined by Western blot assays (h, left and right panels). LDL uptake was performed as described above (n=5) (i). In (h), **P=0.00003 or 0.0015 versus shLacZ for ATF3 or LDLR expression, respectively. In (i), *P=0.011 and **P=0.00003 for shLacZ versus shAtf3 at 2 h or 4 h, respectively.
All the data are expressed as mean±SEM. All the data points are biological replicates. A two-tailed Student’s t-test (d, f, h) or two-way ANOVA with Turkey’s post hoc test for multiple comparisons (a-c, e, g, i) was used for statistical analysis. NS, not significant.
Extended Data Fig. 6. Regulation of SR-BI expression by ATF3 or p53.

a. C57BL/6J mice were i.v. injected with Ad-Empty or Ad-hP53 (n=4). After 7 days, hepatic proteins were analyzed by Western blot assays (top panel) and protein levels were quantified (bottom panel). **P=0.0015 versus Empty.
b-d. p53fl/fl mice and hepatocyte-specific p53−/− (L-p53−/−) mice were i.v. injected with AAV8-ALB-Null or AAV8-ALB-hATF3 (n=7 per group). After 30 days, plasma cholesterol lipoprotein profile was analyzed (b). Plasma non-HDL-C (c), ALT and AST (d) levels were quantified. In (c), P=0.232 or 0.687 for AAV-Null versus AAV-ATF3 for p53fl/fl or L-p53−/− mice, respectively. In (d), for ALT, *P=0.048 and **P=0.00025 for AAV-Null versus AAV-ATF3 for p53fl/fl or L-p53−/− mice, respectively; for AST, P=0.547 or 0.97 for AAV-Null versus AAV-ATF3 for p53fl/fl or L-p53−/− mice, respectively.
e and f. p53fl/fl mice and L-p53−/− mice were i.p. injected with either vehicle or hydrocortisone (HC; 2mg/kg) once a day for 7 days (n=7 per group). Plasma cholesterol lipoprotein profile (e) and plasma ALT and AST levels (f) were determined. For ALT, P=0.825 or 0.998 for Vehicle versus HC for p53fl/fl or L-p53−/− mice, respectively. For AST, P=0.936 or 0.941 for Vehicle versus HC for p53fl/fl or L-p53−/− mice, respectively.
g. HepG2 cells were transfected with pGL3-SR-BI-Luc constructs together pCMV-ATF3 or pCMV-Empty (n=8). After 36 h, relative luciferase units (RLU) were determined. **P=2E-6, 0.000017, 1.5E-7, 6.9E-8, 4E-7 or 1E-7 for CMV-Empty versus CMV-ATF3 for −0.29, −1.0, −0.8, −0.6, −0.4 or −0.2 kb SR-BI-Luc, respectively.
h. EMSA was performed to determine the binding site for ATF3 in the proximal SR-BI promoter. Lane 1: free probe. Lane 2: binding assay for testing if ATF3 protein bound to the SR-BI DNA oligonucleotides. Lanes 3-10: competition assays using SR-BI DNA oligonucleotides containing a wild-type or mutant p53 binding site. Lanes 11 and 12: supershift assays in the presence of IgG or an ATF3 antibody. This experiment was repeated once with similar results.
All the data are expressed as mean±SEM. All the data points are biological replicates. A two-tailed Student’s t-test (a, g) or two-way ANOVA with Turkey’s post hoc test for multiple comparisons (c, d, f) was used for statistical analysis.
Extended Data Fig. 7. Hepatic ATF3 regulates fat absorption and VLDL secretion.

a. C57BL/6J mice were i.v. injected with AAV8-ALB-Null (n=8) or AAV8-ALB-hATF3 (n=7 per group). Fat absorption was performed by gavaging mice with [3H]triolein. Plasma radioactivity at indicated time points was measured. **P=0.0019 for AAV-Null versus AAV-ATF3.
b. Fat absorption was performed in Atf3fl/fl mice and L-Atf3−/− mice as described in (a) (n=8). **P=0.0011 for Atf3fl/fl versus L-Atf3−/− mice.
c. C57BL/6J mice were i.v. injected with AAV8-ALB-Null or AAV8-ALB-hATF3 (n=7). VLDL secretion was performed. **P=0.0062 for AAV-Null versus AAV-ATF3.
d. VLDL secretion was performed in Atf3fl/fl mice and L-Atf3−/− mice (n=8). **P=0.000056 for Atf3fl/fl versus L-Atf3−/− mice.
All the data are expressed as mean±SD. All the data points are biological replicates. Two-way ANOVA with Turkey’s post hoc test for multiple comparisons was used for statistical analysis (a-d).
Extended Data Fig. 8. ATF3 induces hepatic LXRα expression and regulates cholesterol or fat absorption independent of FXR signaling.

a. C57BL/6J mice were i.v. injected with AAV8-ALB-Null, AAV8-ALB-ATF3, and/or AAV8-ALB-CYP8B1 (n=8). After two months, plasma ALT and AST levels were determined. For ALT, *P=0.042 and **P=0.001 for AAV-Null versus AAV-ATF3 for CYP8B1 and Null groups, respectively. For AST, P=0.35 or 0.39 AAV-Null versus AAV-ATF3 for Null or CYP8B1 groups, respectively.
b and c. Hnf4αfl/fl mice and L-Hnf4αfl/fl mice were i.v. injected with AAV8-ALB-Null or AAV8-ALB-hATF3 (n=6). After two months, plasma ALT and AST levels (b) and plasma cholesterol lipoprotein profile (c) were determined. In (b), for ALT, *P=0.011 and **P=0.0097 for AAV-Null versus AAV-ATF3 for L-Hnf4α−/− and Hnf4αfl/fl mice, respectively. For AST, P=0.93 or 0.16 for AAV-Null versus AAV-ATF3 for Hnf4αfl/fl or L-Hnf4α−/− mice, respectively.
d. HepG2 cells were transfected with pGL3-Cyp8b1-Luc constructs together pCMV-ATF3 or pCMV-Empty (n=6 per group). After 36 h, relative luciferase units (RLU) were determined. **P<1E-6 for CMV-Empty versus CMV-ATF3 for −1.1, −0.9, −0.85, −0.75 or −0.66 kb Cyp8b1-Luc, respectively.
e. C57BL/6J mice were i.v. injected with AAV8-ALB-Null or AAV8-ALB-hATF3 (n=6 per group). After 2 months, hepatic or intestinal mRNA levels were determined. **P=0.0096 or 0.0019 for AAV-Null versus AAV-ATF3 for Cyp7a1 or Fgf15, respectively.
f. C57BL/6J mice were i.v. injected with AAV8-ALB-Null, AAV8-ALB-hATF3 and/or AAV8-ALB-CYP8B1 (n=7 for the Null or ATF3 groups, n=6 for the CYP8B1 group, and n=8 for the ATF3+CYP8B1 group). After two months, hepatic mRNA levels were determined. For Lxrα, **P=1E-6 or 0.00011 for AAV-ATF3 versus AAV-Null or AAV-ATF3+AAV-CYP8B1, respectively.
g and h. Fxr+/+ mice and Fxr−/− mice were i.v. injected with AAV8-ALB-Null or AAV8-ALB-hATF3 (n=6). After 2 months, intestinal cholesterol (g) or fat (h) absorption was determined. In (g), *P=0.033 for Fxr+/++AAV-Null versus Fxr−/−+AAV-Null, and **P=0.00007 or <1E-6 for AAV-Null versus AAV-ATF3 for Fxr+/+ or Fxr−/− mice, respectively. In (h), **P<1E-6 for AAV-Null versus AAV-ATF3 for Fxr+/+ or Fxr−/− mice, respectively.
The data are expressed as mean±SEM (a, b, d-g) or mean±SD (h). All the data points are biological replicates. A two-tailed Student’s t-test (e) and one-way (f) or two-way (a, b, d, g, h) ANOVA with Turkey’s post hoc test for multiple comparisons were used for statistical analysis. NS, not significant.
Extended Data Fig. 9. Over-expression of hepatocyte ATF3 lowers plasma lipid levels in Apoe−/−, Ldlr−/− or Apoe−/−Ldlr−/− mice.
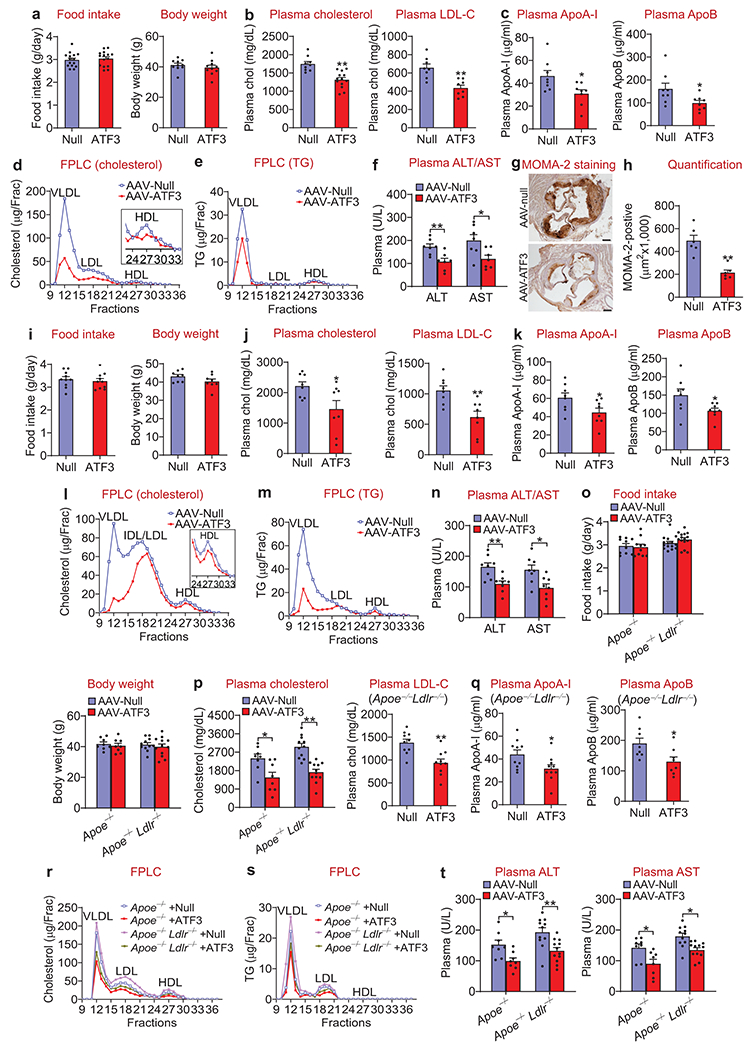
a-h. Three-months-old Apoe−/− mice were i.v. injected with AAV8-ALB-Null or AAV8-ALB-hATF3, and then fed a Western diet for 3 months. Food intake (n=15) and body weight (n=10) were measured (a). Plasma total cholesterol (n=9 for the Null group, n=13 for the ATF3 group), LDL-C (n=8) (b), ApoA-I, ApoB (c; n=8), cholesterol lipoprotein profile (d), triglyceride (TG) lipoprotein profile (e), and plasma ALT or AST levels (f; n=7) were determined. Aortic roots were stained using an MOMA-2 antibody (g) and MOMA-2-positive areas were quantified (h; n=6). In (d), the inset shows HDL fraction. In (a), P=0.62 or 0.41versus Null for food intake or body weight, respectively. In (b), **P=0.0002 or 0.0008 versus Null for plasma cholesterol or LDL-C, respectively. In (c), *P=0.023 or 0.048 versus Null for plasma ApoA-I or ApoB, respectively. In (f), *P=0.023 versus Null for AST, and **P=0.0057 versus Null for ALT. In (h), **P=0.0011 versus Null.
i-n. Ldlr−/− mice were i.v. injected with AAV8-ALB-Null or AAV8-ALB-hATF3, and then fed a Western diet for 3 months (n=8). Food intake and body weight were measured. Plasma total cholesterol, LDL-C (j), ApoA-I, ApoB (k), cholesterol lipoprotein profile (l), triglyceride lipoprotein profile (m), and ALT or AST levels (n) were determined. In (i), P=0.59 or 0.13 versus Null for food intake or body weight, respectively. In (j), *P=0.035 versus Null for cholesterol, and **P=0.0035 versus Null for LDL-C. In (k), *P=0.04 or 0.046 versus Null for plasma ApoA-I or ApoB, respectively. In (n), *P=0.011 versus Null for AST, and **P=0.0045 versus Null for ALT.
o-t. Nine-weeks-old Apoe−/− mice or Apoe−/−Ldlr−/− mice were i.v. injected with AAV8-ALB-Null or AAV8-ALB-hATF3, and then fed a Western diet for 3 months. Food intake (n=10 for Apoe−/−+AAV-Null or ATF3/Apoe−/−+AAV-ATF3, n=15 for Apoe−/−Ldlr−/−+AAV-Null or Apoe−/−Ldlr−/−+AAV-ATF3) and body weight (n=8 for Apoe−/−+AAV-Null or Apoe−/−+AAV-ATF3, n=11 for Apoe−/−Ldlr−/−+AAV-Null, and n=12 for Apoe−/−Ldlr−/−+AAV-ATF3) were measured (o). Plasma total cholesterol (p, left panel; n=8 for Apoe−/−+AAV-Null or Apoe−/−+AAV-ATF3, n=11 for Apoe−/−Ldlr−/−+AAV-Null, and n=12 for Apoe−/−Ldlr−/−+AAV-ATF3), LDL-C (p, right panel; n=10), ApoA-I (q, left panel; n=10), ApoB (q, right panel; n=8), cholesterol lipoprotein profile (r), triglyceride lipoprotein profile (s), and ALT or AST levels (t; n=8 for Apoe−/−+AAV-Null or Apoe−/−+AAV-ATF3, n=11 for Apoe−/−Ldlr−/−+AAV-Null, and n=12 for Apoe−/−Ldlr−/−+AAV-ATF3) were determined. In (o), P=0.288 or 0.93 for AAV-Null versus AAV-ATF3 for food intake or body weight, respectively. In (p), for plasma cholesterol, *P=0.013 or **P=0.000066 for AAV-Null versus AAV-ATF3 for Apoe−/− or Apoe−/−Ldlr−/− mice, respectively; for plasma LDL-C, **P=0.0011 versus Null. In (q), *P=0.031 or 0.022 versus Null for plasma ApoA-I or ApoB, respectively. In (t), for ALT, *P=0.025 and **P=0.0021 for AAV-Null versus AAV-ATF3 for Apoe−/− and Apoe−/−Ldlr−/− mice, respectively. For AST, *P=0.019 or 0.015 for AAV-Null versus AAV-ATF3 for Apoe−/− or Apoe−/−Ldlr−/− mice, respectively.
All the data are expressed as mean±SEM. All the data points are biological replicates. A two-tailed Student’s t-test (a-c, f, h-k, n, p (LDL-C), q) or two-way ANOVA with Turkey’s post hoc test for multiple comparisons (o, p (total cholesterol), t) was used for statistical analysis.
Extended Data Fig. 10. Loss of hepatic ATF3 increases plasma lipid levels.

a. C57BL/6J (WT) mice, Ldlr−/− mice or Apoe−/− mice (on a C57BL/6J background) were fed a standard chow diet (CD) or Western diet (WD) for 3 months (n=8). Hepatic proteins were analyzed by Western blot assays (left panel) and protein levels were quantified (right panel). **P=0.0048, 0.000089 or 0.000062 for WT+CD versus WT+WD, Ldlr−/−+WD or Apoe−/−+WD, respectively.
b-e. Six-weeks-old Atf3fl/flApoe−/− mice and L-Atf3−/−Apoe−/− mice were fed a Western diet for 3 months (n=8). Plasma cholesterol levels were analyzed (b). Plasma cholesterol (c) or TG (d) lipoprotein profiles were determined. Plasma ALT or AST levels were quantified (e). In (b), **P=0.0016 versus Atf3fl/flApoe−/−. In (e), *P=0.032 and **P=0.0001 for Atf3fl/flApoe−/− versus L-Atf3−/−Apoe−/− for AST and ALT, respectively. All the data are expressed as mean±SEM. All the data points are biological replicates. A two-tailed Student’s t-test (b, e) or one-way ANOVA with Turkey’s post hoc test for multiple comparisons (a) was used for statistical analysis.
Supplementary Material
Acknowledgements
We thank Dr. Ling Yang’s group for providing human data. The non-clinical work was supported in part by the National Institutes of Health grants R01DK102619 (Y.Z.), R01HL103227 (Y.Z. and L.Y.Y.), R01HL142086 (Y.Z.), R01DK118941 (Y.Z.) and R01DK118805 (Y.Z.).
Footnotes
Reporting Summary. Further information on research design is available in the Nature Research Reporting Summary linked to this article.
Data Availability
The data that support the findings of this study are available from the corresponding author upon request. Source data for Figs. 1–7 and Extended Data 1–10 are provided online linked to this article. The RNA-Seq data have been deposited in the GEO repository (accession # GSE148301). The genes regulated by ATF3 are presented in Supplementary Data 1.
Competing Interests
The authors declare no competing financial/non-financial interests.
Code Availability
Not applicable.
References
- 1.Linton MF, Tao H, Linton EF & Yancey PG SR-BI: A Multifunctional Receptor in Cholesterol Homeostasis and Atherosclerosis. Trends Endocrinol Metab 28, 461–472, doi: 10.1016/j.tem.2017.02.001 (2017). [DOI] [PMC free article] [PubMed] [Google Scholar]
- 2.Cuchel M & Rader DJ Macrophage reverse cholesterol transport: key to the regression of atherosclerosis? Circulation 113, 2548–2555, doi:113/21/2548 [pii] 10.1161/CIRCULATIONAHA.104.475715 (2006). [DOI] [PubMed] [Google Scholar]
- 3.Rosenson RS et al. Cholesterol efflux and atheroprotection: advancing the concept of reverse cholesterol transport. Circulation 125, 1905–1919, doi: 10.1161/CIRCULATIONAHA.111.066589 (2012). [DOI] [PMC free article] [PubMed] [Google Scholar]
- 4.Zhang Y et al. Hepatic expression of scavenger receptor class B type I (SR-BI) is a positive regulator of macrophage reverse cholesterol transport in vivo. J Clin Invest 115, 2870–2874 (2005). [DOI] [PMC free article] [PubMed] [Google Scholar]
- 5.Braun A et al. Loss of SR-BI expression leads to the early onset of occlusive atherosclerotic coronary artery disease, spontaneous myocardial infarctions, severe cardiac dysfunction, and premature death in apolipoprotein E-deficient mice. Circ Res 90, 270–276 (2002). [DOI] [PubMed] [Google Scholar]
- 6.Kozarsky KF, Donahee MH, Glick JM, Krieger M & Rader DJ Gene transfer and hepatic overexpression of the HDL receptor SR-BI reduces atherosclerosis in the cholesterol-fed LDL receptor-deficient mouse. Arterioscler Thromb Vasc Biol 20, 721–727 (2000). [DOI] [PubMed] [Google Scholar]
- 7.Zanoni P et al. Rare variant in scavenger receptor BI raises HDL cholesterol and increases risk of coronary heart disease. Science 351, 1166–1171, doi: 10.1126/science.aad3517 (2016). [DOI] [PMC free article] [PubMed] [Google Scholar]
- 8.Li-Hawkins J et al. Cholic acid mediates negative feedback regulation of bile acid synthesis in mice. J Clin Invest 110, 1191–1200, doi: 10.1172/JCI16309 (2002). [DOI] [PMC free article] [PubMed] [Google Scholar]
- 9.Slatis K et al. Abolished synthesis of cholic acid reduces atherosclerotic development in apolipoprotein E knockout mice. J Lipid Res 51, 3289–3298, doi: 10.1194/jlr.M009308 (2010). [DOI] [PMC free article] [PubMed] [Google Scholar]
- 10.Miyake JH et al. Transgenic expression of cholesterol-7-alpha-hydroxylase prevents atherosclerosis in C57BL/6J mice. Arterioscler Thromb Vasc Biol 22, 121–126 (2002). [DOI] [PubMed] [Google Scholar]
- 11.Thompson MR, Xu D & Williams BR ATF3 transcription factor and its emerging roles in immunity and cancer. J Mol Med (Berl) 87, 1053–1060, doi: 10.1007/s00109-009-0520-x (2009). [DOI] [PMC free article] [PubMed] [Google Scholar]
- 12.Hai T, Wolford CC & Chang YS ATF3, a hub of the cellular adaptive-response network, in the pathogenesis of diseases: is modulation of inflammation a unifying component? Gene Expr 15, 1–11 (2010). [DOI] [PMC free article] [PubMed] [Google Scholar]
- 13.Gilchrist M et al. Systems biology approaches identify ATF3 as a negative regulator of Toll-like receptor 4. Nature 441, 173–178, doi: 10.1038/nature04768 (2006). [DOI] [PubMed] [Google Scholar]
- 14.Whitmore MM et al. Negative regulation of TLR-signaling pathways by activating transcription factor-3. J Immunol 179, 3622–3630 (2007). [DOI] [PubMed] [Google Scholar]
- 15.De Nardo D et al. High-density lipoprotein mediates anti-inflammatory reprogramming of macrophages via the transcriptional regulator ATF3. Nat Immunol 15, 152–160, doi: 10.1038/ni.2784 (2014). [DOI] [PMC free article] [PubMed] [Google Scholar]
- 16.Yao BC et al. Chronic stress: a critical risk factor for atherosclerosis. J Int Med Res 47, 1429–1440, doi: 10.1177/0300060519826820 (2019). [DOI] [PMC free article] [PubMed] [Google Scholar]
- 17.Black PH & Garbutt LD Stress, inflammation and cardiovascular disease. J Psychosom Res 52, 1–23, doi: 10.1016/s0022-3999(01)00302-6 (2002). [DOI] [PubMed] [Google Scholar]
- 18.Vieweg WV et al. Treatment of depression in patients with coronary heart disease. Am J Med 119, 567–573, doi: 10.1016/j.amjmed.2006.02.037 (2006). [DOI] [PubMed] [Google Scholar]
- 19.Rosengren A et al. Association of psychosocial risk factors with risk of acute myocardial infarction in 11119 cases and 13648 controls from 52 countries (the INTERHEART study): case-control study. Lancet 364, 953–962, doi: 10.1016/S0140-6736(04)17019-0 (2004). [DOI] [PubMed] [Google Scholar]
- 20.Brindley DN, McCann BS, Niaura R, Stoney CM & Suarez EC Stress and lipoprotein metabolism: modulators and mechanisms. Metabolism 42, 3–15 (1993). [DOI] [PubMed] [Google Scholar]
- 21.Catalina-Romero C et al. The relationship between job stress and dyslipidemia. Scand J Public Health 41, 142–149, doi: 10.1177/1403494812470400 (2013). [DOI] [PubMed] [Google Scholar]
- 22.Djindjic N, Jovanovic J, Djindjic B, Jovanovic M & Jovanovic JJ Associations between the occupational stress index and hypertension, type 2 diabetes mellitus, and lipid disorders in middle-aged men and women. Ann Occup Hyg 56, 1051–1062, doi: 10.1093/annhyg/mes059 (2012). [DOI] [PubMed] [Google Scholar]
- 23.Assadi SN What are the effects of psychological stress and physical work on blood lipid profiles? Medicine (Baltimore) 96, e6816, doi: 10.1097/MD.0000000000006816 (2017). [DOI] [PMC free article] [PubMed] [Google Scholar]
- 24.Heidt T et al. Chronic variable stress activates hematopoietic stem cells. Nat Med 20, 754–758, doi: 10.1038/nm.3589 (2014). [DOI] [PMC free article] [PubMed] [Google Scholar]
- 25.Russell G & Lightman S The human stress response. Nat Rev Endocrinol 15, 525–534, doi: 10.1038/s41574-019-0228-0 (2019). [DOI] [PubMed] [Google Scholar]
- 26.Troxler RG, Sprague EA, Albanese RA, Fuchs R & Thompson AJ The association of elevated plasma cortisol and early atherosclerosis as demonstrated by coronary angiography. Atherosclerosis 26, 151–162, doi: 10.1016/0021-9150(77)90098-3 (1977). [DOI] [PubMed] [Google Scholar]
- 27.Dekker MJ et al. Salivary cortisol is related to atherosclerosis of carotid arteries. J Clin Endocrinol Metab 93, 3741–3747, doi: 10.1210/jc.2008-0496 (2008). [DOI] [PubMed] [Google Scholar]
- 28.Alevizaki M, Cimponeriu A, Lekakis J, Papamichael C & Chrousos GP High anticipatory stress plasma cortisol levels and sensitivity to glucocorticoids predict severity of coronary artery disease in subjects undergoing coronary angiography. Metabolism 56, 222–226, doi: 10.1016/j.metabol.2006.09.017 (2007). [DOI] [PubMed] [Google Scholar]
- 29.Neary NM et al. Hypercortisolism is associated with increased coronary arterial atherosclerosis: analysis of noninvasive coronary angiography using multidetector computerized tomography. J Clin Endocrinol Metab 98, 2045–2052, doi: 10.1210/jc.2012-3754 (2013). [DOI] [PMC free article] [PubMed] [Google Scholar]
- 30.Hermanowski-Vosatka A et al. 11beta-HSD1 inhibition ameliorates metabolic syndrome and prevents progression of atherosclerosis in mice. J Exp Med 202, 517–527, doi: 10.1084/jem.20050119 (2005). [DOI] [PMC free article] [PubMed] [Google Scholar]
- 31.Cholongitas E et al. Relative Adrenal Insufficiency is Associated with the Clinical Outcome in Patients with Stable Decompensated Cirrhosis. Ann Hepatol 16, 584–590, doi: 10.5604/01.3001.0010.0298 (2017). [DOI] [PubMed] [Google Scholar]
- 32.Spadaro L et al. Apolipoprotein AI and HDL are reduced in stable cirrhotic patients with adrenal insufficiency: a possible role in glucocorticoid deficiency. Scand J Gastroenterol 50, 347–354, doi: 10.3109/00365521.2014.985707 (2015). [DOI] [PubMed] [Google Scholar]
- 33.Hayashi R et al. Glucocorticoid replacement affects serum adiponectin levels and HDL-C in patients with secondary adrenal insufficiency. J Clin Endocrinol Metab, doi: 10.1210/jc.2019-00420 (2019). [DOI] [PubMed] [Google Scholar]
- 34.Werumeus Buning J et al. Downregulation of cholesteryl ester transfer protein by glucocorticoids: a randomised study on HDL. Eur J Clin Invest 47, 494–503, doi: 10.1111/eci.12770 (2017). [DOI] [PubMed] [Google Scholar]
- 35.Nilsson AG et al. Long-term safety of once-daily, dual-release hydrocortisone in patients with adrenal insufficiency: a phase 3b, open-label, extension study. Eur J Endocrinol 176, 715–725, doi: 10.1530/EJE-17-0067 (2017). [DOI] [PMC free article] [PubMed] [Google Scholar]
- 36.Guarnotta V, Ciresi A, Pillitteri G & Giordano C Improved insulin sensitivity and secretion in prediabetic patients with adrenal insufficiency on dual-release hydrocortisone treatment: a 36-month retrospective analysis. Clin Endocrinol (Oxf) 88, 665–672, doi: 10.1111/cen.13554 (2018). [DOI] [PubMed] [Google Scholar]
- 37.Yan C, Lu D, Hai T & Boyd DD Activating transcription factor 3, a stress sensor, activates p53 by blocking its ubiquitination. EMBO J 24, 2425–2435, doi: 10.1038/sj.emboj.7600712 (2005). [DOI] [PMC free article] [PubMed] [Google Scholar]
- 38.Reynier MO et al. Comparative effects of cholic, chenodeoxycholic, and ursodeoxycholic acids on micellar solubilization and intestinal absorption of cholesterol. J Lipid Res 22, 467–473 (1981). [PubMed] [Google Scholar]
- 39.Tint GS, Salen G & Shefer S Effect of ursodeoxycholic acid and chenodeoxycholic acid on cholesterol and bile acid metabolism. Gastroenterology 91, 1007–1018, doi: 10.1016/0016-5085(86)90708-0 (1986). [DOI] [PubMed] [Google Scholar]
- 40.Lanzini A & Northfield TC Effect of ursodeoxycholic acid on biliary lipid coupling and on cholesterol absorption during fasting and eating in subjects with cholesterol gallstones. Gastroenterology 95, 408–416, doi: 10.1016/0016-5085(88)90498-2 (1988). [DOI] [PubMed] [Google Scholar]
- 41.Hardison WG & Grundy SM Effect of ursodeoxycholate and its taurine conjugate on bile acid synthesis and cholesterol absorption. Gastroenterology 87, 130–135 (1984). [PubMed] [Google Scholar]
- 42.Salvioli G, Lugli R & Pradelli JM Cholesterol absorption and sterol balance in normal subjects receiving dietary fiber or ursodeoxycholic acid. Dig Dis Sci 30, 301–307, doi: 10.1007/BF01403837 (1985). [DOI] [PubMed] [Google Scholar]
- 43.Chevre R et al. Therapeutic modulation of the bile acid pool by Cyp8b1 knockdown protects against nonalcoholic fatty liver disease in mice. FASEB J 32, 3792–3802, doi: 10.1096/fj.201701084RR (2018). [DOI] [PubMed] [Google Scholar]
- 44.Bertaggia E et al. Cyp8b1 ablation prevents Western diet-induced weight gain and hepatic steatosis because of impaired fat absorption. Am J Physiol Endocrinol Metab 313, E121–E133, doi: 10.1152/ajpendo.00409.2016 (2017). [DOI] [PMC free article] [PubMed] [Google Scholar]
- 45.Watanabe M et al. Bile acids lower triglyceride levels via a pathway involving FXR, SHP, and SREBP-1c. J Clin Invest 113, 1408–1418 (2004). [DOI] [PMC free article] [PubMed] [Google Scholar]
- 46.Inoue Y et al. Regulation of bile acid biosynthesis by hepatocyte nuclear factor 4alpha. J Lipid Res 47, 215–227, doi:M500430-JLR200 [pii] 10.1194/jlr.M500430-JLR200 (2006). [DOI] [PMC free article] [PubMed] [Google Scholar]
- 47.Jahan A & Chiang JY Cytokine regulation of human sterol 12alpha-hydroxylase (CYP8B1) gene. Am J Physiol Gastrointest Liver Physiol 288, G685–695, doi:00207.2004 [pii] 10.1152/ajpgi.00207.2004 (2005). [DOI] [PubMed] [Google Scholar]
- 48.Kliewer SA & Mangelsdorf DJ Bile Acids as Hormones: The FXR-FGF15/19 Pathway. Dig Dis 33, 327–331, doi: 10.1159/000371670 (2015). [DOI] [PMC free article] [PubMed] [Google Scholar]
- 49.Davis RA, Miyake JH, Hui TY & Spann NJ Regulation of cholesterol-7alpha-hydroxylase: BAREly missing a SHP. J Lipid Res 43, 533–543 (2002). [PubMed] [Google Scholar]
- 50.Wang J et al. Studies on LXR- and FXR-mediated effects on cholesterol homeostasis in normal and cholic acid-depleted mice. J Lipid Res 47, 421–430, doi: 10.1194/jlr.M500441-JLR200 (2006). [DOI] [PubMed] [Google Scholar]
- 51.Peet DJ et al. Cholesterol and bile acid metabolism are impaired in mice lacking the nuclear oxysterol receptor LXR alpha. Cell 93, 693–704 (1998). [DOI] [PubMed] [Google Scholar]
- 52.Hong C et al. The LXR-Idol axis differentially regulates plasma LDL levels in primates and mice. Cell Metab 20, 910–918, doi: 10.1016/j.cmet.2014.10.001 (2014). [DOI] [PMC free article] [PubMed] [Google Scholar]
- 53.Wang N, Arai T, Ji Y, Rinninger F & Tall AR Liver-specific overexpression of scavenger receptor BI decreases levels of very low density lipoprotein ApoB, low density lipoprotein ApoB, and high density lipoprotein in transgenic mice. J Biol Chem 273, 32920–32926, doi: 10.1074/jbc.273.49.32920 (1998). [DOI] [PubMed] [Google Scholar]
- 54.Bjorklund MM et al. Induction of atherosclerosis in mice and hamsters without germline genetic engineering. Circ Res 114, 1684–1689, doi: 10.1161/CIRCRESAHA.114.302937 (2014). [DOI] [PubMed] [Google Scholar]
- 55.Joseph JJ & Golden SH Cortisol dysregulation: the bidirectional link between stress, depression, and type 2 diabetes mellitus. Ann N Y Acad Sci 1391, 20–34, doi: 10.1111/nyas.13217 (2017). [DOI] [PMC free article] [PubMed] [Google Scholar]
- 56.Huszar D et al. Increased LDL cholesterol and atherosclerosis in LDL receptor-deficient mice with attenuated expression of scavenger receptor B1. Arterioscler Thromb Vasc Biol 20, 1068–1073, doi: 10.1161/01.atv.20.4.1068 (2000). [DOI] [PubMed] [Google Scholar]
- 57.Arai T, Wang N, Bezouevski M, Welch C & Tall AR Decreased atherosclerosis in heterozygous low density lipoprotein receptor-deficient mice expressing the scavenger receptor BI transgene. J Biol Chem 274, 2366–2371 (1999). [DOI] [PubMed] [Google Scholar]
- 58.Huby T et al. Knockdown expression and hepatic deficiency reveal an atheroprotective role for SR-BI in liver and peripheral tissues. J Clin Invest 116, 2767–2776, doi: 10.1172/JCI26893 (2006). [DOI] [PMC free article] [PubMed] [Google Scholar]
- 59.Ji Y et al. Hepatic scavenger receptor BI promotes rapid clearance of high density lipoprotein free cholesterol and its transport into bile. J Biol Chem 274, 33398–33402 (1999). [DOI] [PubMed] [Google Scholar]
- 60.Houten SM, Watanabe M & Auwerx J Endocrine functions of bile acids. Embo J 25, 1419–1425 (2006). [DOI] [PMC free article] [PubMed] [Google Scholar]
- 61.Wang DQ, Tazuma S, Cohen DE & Carey MC Feeding natural hydrophilic bile acids inhibits intestinal cholesterol absorption: studies in the gallstone-susceptible mouse. Am J Physiol Gastrointest Liver Physiol 285, G494–502, doi: 10.1152/ajpgi.00156.200300156.2003 [pii] (2003). [DOI] [PubMed] [Google Scholar]
- 62.Wang J et al. Relative roles of ABCG5/ABCG8 in liver and intestine. Journal of lipid research 56, 319–330, doi: 10.1194/jlr.M054544 (2015). [DOI] [PMC free article] [PubMed] [Google Scholar]
- 63.Huang Y et al. Lactobacillus acidophilus ATCC 4356 prevents atherosclerosis via inhibition of intestinal cholesterol absorption in apolipoprotein E-knockout mice. Applied and environmental microbiology 80, 7496–7504, doi: 10.1128/AEM.02926-14 (2014). [DOI] [PMC free article] [PubMed] [Google Scholar]
- 64.Davidson MH et al. Inhibition of intestinal cholesterol absorption with ezetimibe increases components of reverse cholesterol transport in humans. Atherosclerosis 230, 322–329, doi: 10.1016/j.atherosclerosis.2013.08.006 (2013). [DOI] [PubMed] [Google Scholar]
- 65.Lim JH, Lee HJ, Pak YK, Kim WH & Song J Organelle stress-induced activating transcription factor-3 downregulates low-density lipoprotein receptor expression in Sk-Hep1 human liver cells. Biol Chem 392, 377–385, doi: 10.1515/BC.2011.030 (2011). [DOI] [PubMed] [Google Scholar]
- 66.Xu Y et al. A metabolic stress-inducible miR-34a-HNF4alpha pathway regulates lipid and lipoprotein metabolism. Nat Commun 6, 7466, doi: 10.1038/ncomms8466 (2015). [DOI] [PMC free article] [PubMed] [Google Scholar]
- 67.Kozarsky KF et al. Overexpression of the HDL receptor SR-BI alters plasma HDL and bile cholesterol levels. Nature 387, 414–417, doi: 10.1038/387414a0 (1997). [DOI] [PubMed] [Google Scholar]
- 68.Xu Y et al. Lipocalin-2 Protects Against Diet-Induced Nonalcoholic Fatty Liver Disease by Targeting Hepatocytes. Hepatol Commun 3, 763–775, doi: 10.1002/hep4.1341 (2019). [DOI] [PMC free article] [PubMed] [Google Scholar]
- 69.Zhang Y, Castellani LW, Sinal CJ, Gonzalez FJ & Edwards PA Peroxisome proliferator-activated receptor-gamma coactivator 1alpha (PGC-1alpha) regulates triglyceride metabolism by activation of the nuclear receptor FXR. Genes Dev 18, 157–169 (2004). [DOI] [PMC free article] [PubMed] [Google Scholar]
- 70.Ge X et al. Aldo-keto reductase 1B7 is a target gene of FXR and regulates lipid and glucose homeostasis. J Lipid Res 52, 1561–1568, doi: 10.1194/jlr.M015859 (2011). [DOI] [PMC free article] [PubMed] [Google Scholar]
- 71.Li Y et al. Hepatic Forkhead Box Protein A3 Regulates ApoA-I (Apolipoprotein A-I) Expression, Cholesterol Efflux, and Atherogenesis. Arterioscler Thromb Vasc Biol 39, 1574–1587, doi: 10.1161/ATVBAHA.119.312610 (2019). [DOI] [PMC free article] [PubMed] [Google Scholar]
- 72.Voshol PJ et al. Postprandial chylomicron formation and fat absorption in multidrug resistance gene 2 P-glycoprotein-deficient mice. Gastroenterology 118, 173–182, doi: 10.1016/s0016-5085(00)70426-4 (2000). [DOI] [PubMed] [Google Scholar]
- 73.Goudriaan JR et al. CD36 deficiency in mice impairs lipoprotein lipase-mediated triglyceride clearance. J Lipid Res 46, 2175–2181, doi: 10.1194/jlr.M500112-JLR200 (2005). [DOI] [PubMed] [Google Scholar]
- 74.Khalifeh-Soltani A et al. Mfge8 promotes obesity by mediating the uptake of dietary fats and serum fatty acids. Nat Med 20, 175–183, doi: 10.1038/nm.3450 (2014). [DOI] [PMC free article] [PubMed] [Google Scholar]
- 75.Turley SD, Herndon MW & Dietschy JM Reevaluation and application of the dual-isotope plasma ratio method for the measurement of intestinal cholesterol absorption in the hamster. J Lipid Res 35, 328–339 (1994). [PubMed] [Google Scholar]
- 76.Xu Y et al. Macrophage miR-34a Is a Key Regulator of Cholesterol Efflux and Atherosclerosis. Mol Ther, doi: 10.1016/j.ymthe.2019.09.008 (2019). [DOI] [PMC free article] [PubMed] [Google Scholar]
- 77.Rossi SS, Converse JL & Hofmann AF High pressure liquid chromatographic analysis of conjugated bile acids in human bile: simultaneous resolution of sulfated and unsulfated lithocholyl amidates and the common conjugated bile acids. J Lipid Res 28, 589–595 (1987). [PubMed] [Google Scholar]
- 78.Wang DQ, Lammert F, Paigen B & Carey MC Phenotypic characterization of lith genes that determine susceptibility to cholesterol cholelithiasis in inbred mice. Pathophysiology Of biliary lipid secretion. J Lipid Res 40, 2066–2079 (1999). [PubMed] [Google Scholar]
- 79.Naik SU et al. Pharmacological activation of liver X receptors promotes reverse cholesterol transport in vivo. Circulation 113, 90–97 (2006). [DOI] [PubMed] [Google Scholar]
- 80.Xu Y et al. FXR Activation Increases Reverse Cholesterol Transport by Modulating Bile Acid Composition and Cholesterol Absorption. Hepatology 64, 1072–1085, doi: 10.1002/hep.28712 (2016). [DOI] [PMC free article] [PubMed] [Google Scholar]
- 81.Roberts DC et al. An alternative procedure for incorporating radiolabelled cholesteryl ester into human plasma lipoproteins in vitro. Biochem J 226, 319–322, doi: 10.1042/bj2260319 (1985). [DOI] [PMC free article] [PubMed] [Google Scholar]
Associated Data
This section collects any data citations, data availability statements, or supplementary materials included in this article.