Abstract
Keratoconus (KC) is a progressive ectatic corneal disorder. There are multiple topographic devices and their varied indices used for diagnosis, detecting progression, and deciding management. It is important to understand the repeatablility, intra- test variabililty, and comparability amongst various topographic devices. The Scheimpflug camera-based devices, such as the Pentacam (Oculus, Wetzlar, Germany), Galilei (Ziemer, Biel, Switzerland), and Sirius (Costruzione Strumenti Oftalmici, Florence, Italy) are known to assist in the detection of early keratoconus and subclinical keratoconus. This article reviews the various Scheimpflug camera-based devices in depth, addressing their different indices, diagnostic accuracy, repeatability, and agreement and identifying the strongest parameter of each device. It will guide the practicing clinician by giving practical tips for decision making in the diagnosis and management of keratoconus.
Keywords: Galilei, keratoconus, Pentacam, Sirius, topography
Keratoconus (KC) is a progressive ectatic corneal disorder affecting mainly the adolescent age group.[1] A thorough slit-lamp examination supplemented with retinoscopy, detailed documentation of refractive error, and corneal topography helps in the diagnosis of KC. In early cases of keratoconus, the classical slit-lamp signs may not be visible in early stages and hence corneal topography is the most reliable diagnostic tool.[2,3]
In 1980s, the placido disk-based corneal topography devices were introduced that helped in diagnosing the condition, even before the clinical signs were appreciated on the slit lamp. It further paved way for the technological advancement in the diagnostic devices for KC.[4] These devices are based on the principle of projection and a series of illuminated mires are projected onto the cornea to capture the scans.[5] It calculates corneal curvature depending upon the distortion and size of the mires.
Despite these technological advancements, there were still large lacunae in these devices with respect to the measurement of the posterior corneal curvature and providing an accurate thickness map.[6] Rotational Scheimpflug imaging and optical coherence tomography have the ability to image the cornea in three dimensions and have led to an improved pachymetric mapping, better visualization of posterior cornea and introduction of elevation based topography[6] All of these have led to more accurate and early detection of KC. Various Scheimpflug camera-based devices that are available today are, Pentacam (Oculus, Wetzlar, Germany), Galilei (Ziemer, Biel, Switzerland) and Sirius (Costruzione Strumenti Oftalmici, Florence, Italy).[7]
In this article we have reviewed the various Scheimpflug camera-based devices and have identified their strongest diagnostic parameter. We have also Compared their indices, diagnostic accuracy, repeatability, and agreement to guide the practicing clinician in decision making in the diagnosis and management of keratoconus.
Topographics Indices
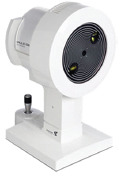
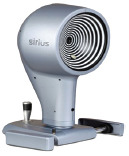
Specifications of three Scheimpflug topographers and their comparison is shown in the table below [Table 1].
Table 1.
Specifications of three scheimpflug topographers and their comparison
| Topographer | Pentacam | Galilei | Sirius |
|---|---|---|---|
 |
 |
 |
|
| Principle | Single scheimpflug | Dual scheimpflug with placido | Single scheimpflug with placido |
| Acquisition speed | 25 scan images in 2 sec | 25-50 scan images in 2 sec | 25 scan images in 2 sec |
| Points mapped | 25,000 points | 122,000 points | 21632 anterior and 16000 posterior points |
Topographic Indices of Pentacam
1) Belin-Ambrósio enhanced ectasia display total deviation value (BAD_D) is a multivariate Index that integrates anterior elevation, posterior elevation & the pachymetric data. It gives a complete overview of the corneal shape and is therefore a quick and effective screening tool for refractive patients.
The Belin/Ambrósio Enhanced Ectasia Display I presents anterior and posterior elevation data relative to standard best fit sphere (BFS) calculated at a fixed optical zone of 8.0 mm and also anterior and posterior elevation data relative to the 'enhanced reference surface” calculated by determining the BFS from central 8.0 mm zone after excluding all the data from a 3.5-4 mm optical zone centered on the thinnest part of the cornea [Fig. 1]. The exclusion zone is determined by the magnitude of astigmatism and is not selected by the operator [Fig. 2a]. Finally, it calculates the difference in elevation values between the standard BFS and the enhanced BFS which differentiates between normal and ectatic corneas [Fig. 2b].[8]
Figure 1.
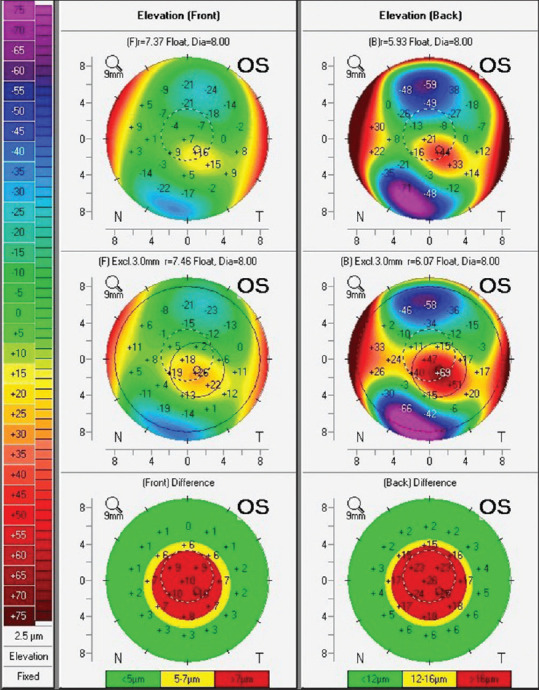
Represents Anterior & posterior elevation data relative to standard BFS calculated at fixed optical zone 8.0 mm. Anterior & Posterior elevation data relative to the 'enhanced reference surface” calculated by determining the BFS from central 8.0 mm zone after excluding all the data from a 3.5-4 mm optical zone centered on thinnest pachymetry of cornea
Figure 2.
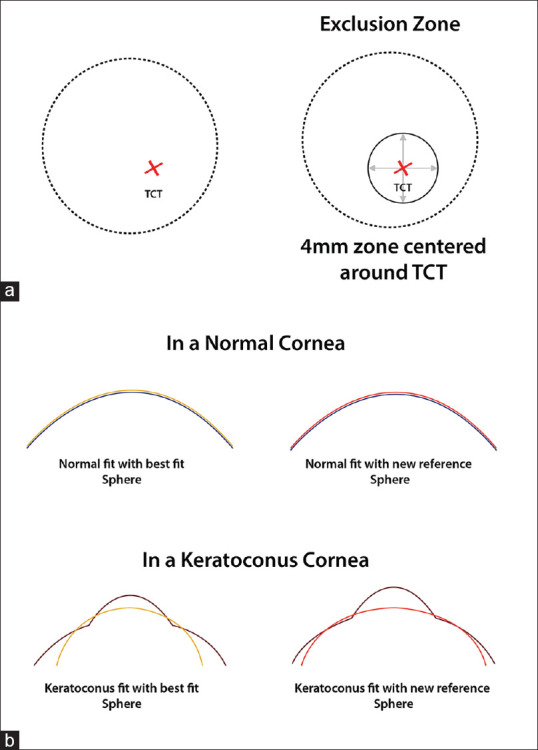
(a) Diagrammatic representation of the exclusion zone calculated in the Belin/Ambrósio Enhanced Ectasia Display which is determined by the magnitude of astigmatism and not selected by the operator. Anterior & Posterior elevation data relative to the 'enhanced reference surface” calculated by determining the BFS from central 8.0 mm zone after excluding all the data from a 3.5-4 mm optical zone centered on thinnest pachymetry of cornea. (b) Diagrammatic representation showing the difference in elevation values between the standard Best Fit Sphere and the enhanced Best Fit Sphere in normal and ectatic corneas, thereby enhancing the subtle elevation changes of early ectasia which can be missed by using the standard best fit sphere
The second component comprehensively evaluates pachymetric values along 22 concentric rings with 0.4 mm incremental increase in diameter centered on the thinnest point. Corneal Thickness Spatial Profile (CTSP) graphical [Fig. 3a, blue box] represents the progressive thickening of the cornea from the thinnest point to periphery along these concentric rings and percentage of increase in thickness from the thinnest point to the periphery depicted by Percentage Thickness Index (PTI) [Fig. 3a, red box]. In CTSP and PTI display central line is the average progression derived from normal population and 95% confidence interval is denoted by upper and lower black lines. The measured corneal data are denoted in red. Ectatic corneas show a more rapid and abnormal progression of corneal thickness from thinnest pachymetry to the periphery. This aids in differentiating a normal thin cornea from cornea with early ectatic disease.[8]
Figure 3.
(a) (blue box) Corneal Thickness Spatial Profile (CTSP)-progressive thickening of the cornea from thinnest point to periphery. (Red box) Percentage Thickness Index (PTI)-percentage of progression of thickness from the thinnest point of the cornea to periphery. (Purple box) Five differential parameters-change in anterior elevation from standard to enhanced reference surface (Df), change in posterior elevation (Db), corneal thickness at thinnest point (Dt), thinnest point displacement (Da), pachymetric progression (Dp). (green box) Pachymetric progression index (PPI)-change in corneal thickness over all 360 degrees of cornea. (b) (Red box) denoting the Indices of Irregularity of Cornea ISV, IVA, KI, CKI, IHA, IHD & Rmin (details in the text)
Belin/ambrósio enhanced ectasia display II reports five differential parameters individually that denote the standard deviation from the mean of normative database [Fig. 3a, purple box]. They are changes in anterior elevation from standard to enhanced reference surface, changes in posterior elevation, corneal thickness at the thinnest point, thinnest point displacement, and pachymetric progression {Df (front), Db (back), Dp (pachymetry progression), Dt (thinnest value), and Da (thinnest displacement)}. Final “D” is calculated by considering all 5 parameters and performing a linear regression analysis against a standard database of normal and KC corneas. These values are color-coded based on their standard deviation from the mean in the following way: white when the values <1.6 SD, yellow when ≥1.6 SD and red in cases where values ≥2.6 SD. Sometimes, an individual parameter(s) may fall outside the norm and the final overall comprehensive reading can be normal.[8]
BAD III added four additional parameters (K max, anterior and posterior elevation at the thinnest point and Ambrósio relational thickness maximum (ART max) to original regression analysis Additional individual parameters (steep and flat simulated keratometry (K1 and K2) and Q value) not utilized in regression analysis, were also added.[9]
2) Pachymetric progression index (PPI)[10,11,12] calculates the change in corneal thickness over all 360 degrees of the cornea. The progression value at each meridian from the thinnest point is defined as Progression Index and the average of all meridians is illustrated by PPI-Avg. PPI-Max is the meridian with maximal pachymetric increase. PPI-Min is the meridian with minimal pachymetric increase. (Mean and standard deviation of PPI-Avg, PPI-Min and PPI-Max in a normal population are 0.13 ± 0.33, 0.58 ± 0.30, and 0.85 ± 0.18, respectively.[13] A rapid rate of pachymetric progression distinguishes ectatic cornea from normal. [Fig. 3a, Green box]
3) Ambrósio relational thickness is the ratio between the thinnest point and PPI. It includes ART max, ART min and ART avg. The Cut-off value for the diagnosis of KC is 412 μm for ART-Max.[14] It is a validated diagnostic index that distinguishes keratoconic eyes from normal eyes.[12,13] However there is no consistent value for determining formefruste or Pre keratconus.[15,16]
Indices for irregularity of cornea are also seen in tabulated format on the refractive map of Pentacam [Fig. 3b, red box]. These indices include:
4) Index of surface variance (ISV) is measured as the standard deviation of individual sagittal radii from mean curvature. It is an indicator of corneal surface irregularity. ISV is a highly sensitive index in differentiating KC from normal eyes. ISV >37 is abnormal (yellow) and ISV >41 is pathological (red).[14] It has also been found to be sensitive to monitor progression of the condition.[14]
5) Index of vertical asymmetry (IVA, expressed in mm) is the mean difference between superior and inferior corneal curvature, the level of curvature symmetry with respect to the horizontal meridian as the axis of reflection. IVA >0.28 is abnormal, and >0.32 is pathological.[14] It is highly sensitive in differentiating keratoconus from normal eyes and highly specific for pre-keratoconic corneas. It has been considered second to BAD-D in terms of accuracy in predicting KC.[13]
6) Keratoconus index (KI) is the ratio between mean radius values in the upper half and lower half of cornea. KI >1.07 is abnormal and/or pathological.[11] KI is an efficient diagnostic test to discriminate normal eyes from clinical KC, thus a reliable parameter for screening but has limited application in pre-KC diagnosis.[13,17]
7) Central keratoconus index (CKI) is the ratio between mean radius of curvature in a peripheral placido ring and mean radius of curvature of central ring. It increases with the severity of central keratoconus. A CKI >1.03 is considered abnormal and/or pathological.[14] CKI is a valuable tool for diagnosis of frank KC but not for pre-KC.[13]
8) Index of height asymmetry (IHA, expressed in μm) is the mean difference between corneal elevation in superior hemisphere and inferior hemisphere in the horizontal meridian. An IHA >19 is abnormal, and IHA >21 is pathological.[5] IHA is based on corneal elevation and is thus, a parameter with excellent diagnostic accuracy and sensitivity for detection of KC. Its use in diagnosing early KC has been found to be limited.[13]
9) Index of height decentration (IHD, expressed in μm) measures vertical decentration of elevation data calculated using Fourier analysis. on a ring with a radius of 3 mm. IHD >0.014 is abnormal, and IHD >0.016 is pathological.[5] It has the potential to discriminates pre-keratoconus cases.[13,18]
10) Rmin is the smallest radius of sagittal/axial corneal curvature. It denotes the maximum steepness of the cone. Rmin <6.71 mm is abnormal and/or pathological.[14]
Topographic indices of Sirius topographer
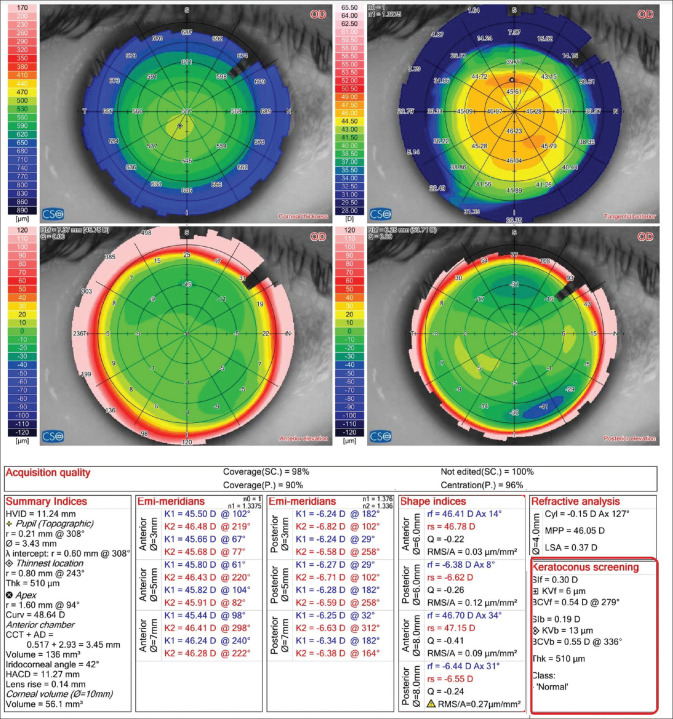
1) Root mean square (RMS) is defined as the deviation in regularity/aberrations (characterized rf, rs, asphericity and Ax) of the corneal surface being examined from the best fit asphero-toric surface. RMS/A is defined as root mean square per area. Low values of RMS in the area signify that surface of the cornea is regular. Higher values denote irregular corneal surface. RMSf/A (μm/mm2) calculated on the front or anterior surface of the cornea. Cut off values for keratoconus suspect is 0.088 and for keratoconus is 0.13. RMSb/A (μm/mm2)-calculated on the back surface of the cornea. Cut off values for keratoconus suspect is 0.212 and for keratoconus is 0.269 [Fig. 4].
Figure 4.
Shape Indices seen on a Sirius Corneal Topographic Map (RMS, RMS/A, RMSf/A, RMSb/A). RMS is the deviation in regularity/aberrations (characterized rf, rs, asphericity and Ax) of the corneal surface being examined from the best fit asphero-toric surface. RMS/A is defined as root mean square per area, RMSf/A (μm/mm2) is calculated on the front or anterior surface of the cornea, RMSb/A (μm/mm2) is calculated on the back surface
2) Symmetry index of curvature The Symmetry Index of the curvature is defined as the difference of the mean anterior tangential curvature (expressed in diopters) of two circular zones centered on the vertical axis in the inferior and superior hemispheres. The two circular zones are centered in (x = 0 mm, y = ±1.5 mm) and their radius is 1.5 mm. SIf is an index which measures the vertical asymmetry: positive values indicate an inferior hemisphere steeper than the superior one, vice versa negative values indicate a superior hemisphere steeper than the inferior one [Fig. 5].
Figure 5.

Diagrammatic Representation of Symmetry index of curvature which measures the vertical asymmetry of the mean anterior tangential curvature. Tangential curvature at a given point is measured by the device as shown in the figure. Such a curvature is derived for circles centered 1.5 mm on either side of Y axis and a difference between the two is the symmetry index
SIb is also expressed in diopters and the index jump has opposite sign respect to the case air-stroma, the sign of the difference is changed to keep the compatibility with SIf. [Fig. 4].
3) Keratoconus Vertex front and back (KVf and KVb), Anterior & Posterior keratoconus vertex: Highest point of ectasia on the Anterior and Posterior Elevation Maps of anterior and posterior corneal surface respectively [Fig. 6].
Figure 6.
Keratoconus Screening Indices in Sirius topographic Map. Symmetry index front & back (SIf, SIb) measures vertical asymmetry, positive values indicate an inferior hemisphere steeper than the superior, negative values indicate superior hemisphere steeper than the inferior. Keratoconus Vertex front& back (KVf and KVb)-highest point of ectasia on the anterior and posterior elevation maps. Baiocchi-Calossi-Versaci front & back (BCVf) and (BCVb) -presence of ectasia through analysis of coma and trefoil components of Zernike's decomposition of elevations in zones where keratoconus statistically arises
4) Baiocchi-Calossi-Versaci front and back index (BCVf) and (BCVb) evaluates the presence of an ectasia through analysis of the coma and trefoil components of Zernike's decomposition of elevations in the zones where keratoconus statistically arises. Based on the presumption that ectasia statistically develops in a preferential direction (infero-temporal) and it mainly manifests in coma, trefoil, spherical aberration. The index BCV or vectorial BCV is the vectorial sum of BCVf and BCVb. [Fig. 6]
Topographic indices of Galilei topographer
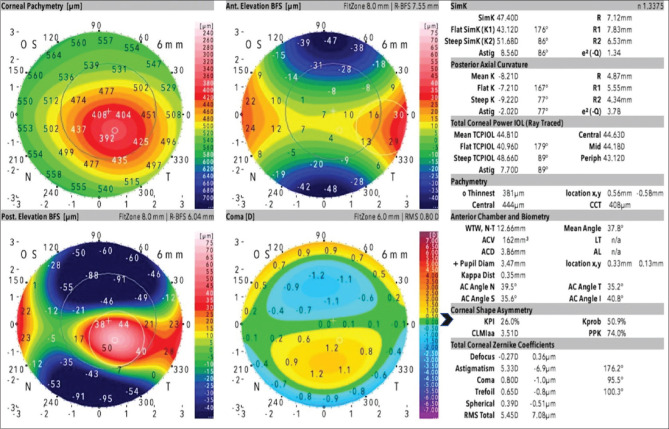
1) Asphericity asymmetry index (AAI), or Kranemann-Arce index is the magnitude of difference between the maximum negative best-fit toric aspheric (BFTA) reference surface value and the maximum positive BFTA elevation value. It indicates asymmetry in asphericity of the cornea. Higher values signify increased rate of change curvature. Posterior AAI calculated on posterior cornea, should be less than 20–25 micrometer (μm).[19] [Fig. 7] Smadja et al. have found higher sensitivity and specificity in the detection of KC using AAI values from the posterior cornea (100 and 99.5% respectively).[20]
Figure 7.
Galilei topographic map. Asphericity asymmetry index (AAI)-difference between maximum negative best-fit toric aspheric (BFTA) reference& maximum positive BFTA elevation. Keratoconus prediction index (KPI)-probability of keratoconus by analyzing anterior corneal topographic data. Cone location &magnitude index (CLMI)-steepest area of curvature & magnitude represents difference between steepest area from remainder of the curvature map. Keratoconus Probability (Kprob)-sensitivity & specificity of reported KPI. Percentage probability of keratoconus (PPK)-optimal threshold for detecting keratoconus
2) The center/surround index (CSI) is a quantitative index that measures the difference in corneal power of two arbitrarily divided areas of cornea. CSI represents the difference between the average corneal power of a central corneal area (3.0-mm diameter) and average corneal power of annulus area (3.0–6.0 mm diameter) surrounding the central corneal area. CSI value is low in normal corneas or corneas with regular astigmatism and high in keratoconus. Thus, CSI is a sensitive index for identification of central steepening. CSI has an excellent diagnostic accuracy in distinguishing keratoconic from normal eyes but has failed in diagnosing pre-keratoconus.[19] Cut off for detecting keratoconus is 0.7 and cut-off value for detecting pre-keratoconus is 0.9.[21]
3) Differential sector index (DSI) describes the degree of asymmetry present on the corneal surface. The corneal surface is divided into eight sectors each of 45° and mean axial keratometric power is calculated for each sector. The maximum difference between any two sectors is defined as DSI. It increases with increase in surface irregularity and is a sensitive index for identifying peripheral steepening DSI is a highly accurate index in the identification of clinical KC but not reliable for early ectasia.[19] Cut off for detecting keratoconus is 3.26 and cut-off value for detecting prekeratoconus is 1.73.[21]
4) Opposite sector index (OSI) is equivalent to the greatest difference in the mean axial keratometric power of any two opposite sectors of 45 degrees. OSI is a valuable screening index for KC but not for pre-keratoconus.[19] Cut-off for detecting keratoconus is 2.04 and cut-off value for detecting pre-keratoconus is 1.85.[21]
5) Surface regularity index (SRI) is the summation of power variation along 256 semimeridians on 10 central rings over corneal surface. It analyses the local irregularities of cornea. If SRI = 0 it implies that the corneal surface is smooth. It increases with increase in corneal surface irregularity and a value <1.55 is normal. SRI is highly sensitive and accurate for diagnosis of clinical keratoconus & pre-keratoconus and is comparable to the BAD_D. values measured by the Pentacam.[19]
6) Irregular astigmatism index (IAI) describes variation in axial power between central rings along any meridian. Area-corrected keratometric power variations along every meridian is calculated for the entire measured corneal surface, the average of which is defined as IAI. It has excellent accuracy for diagnosis of KC.[19]
7) Surface asymmetry index (SAI) is the difference between the keratometric power of opposite points on 128 meridians. SAI is the best parameter to distinguish clinical KC among all Galilei indices.[19,22]
8) Keratoconus prediction index (KPI)[23] describes the percentage probability of keratoconus by analyzing the topographic data of anterior corneal surface. Parameters included in KPI are simulated keratometry, CSI, DSI, OSI, IAI, SAI and percent area-analyzed. KPI from 0 to 10% implies normal or suspicious corneas; KPI of 20 to 30% indicates keratoconic or suspicious corneas & KPI >30% indicates pellucid marginal degeneration (PMD).[19] It has also been used to differentiate and diagnose various other causes of corneal irregularity such as contact lens warpage, Radial Keratotomy, Penetrating keratoplasty, etc [Fig. 7].[22]
9) Cone location and magnitude index (CLMI) characterizes the steepest area of curvature. The magnitude represents difference between the steepest area from the remainder of the curvature map. CLMI is calculated based on M1 and M2. M1 is calculated as the difference between all points outside the circle and all points inside steepest 2 mm diameter circle within central 8 mm diameter anterior curvature map. M2 is the difference between all points outside the circle and all points inside the second circle centered 180 degrees away in angular position.[14] The cut-off value for detecting clinical keratoconus is 1.82] [Fig. 7].[24]
10) Keratoconus Probability (Kprob) relates to or characterizes sensitivity & specificity of the reported KPI. It is calculated from the statistical analysis on a series of normal & keratoconic corneas. Kprob has an inverse relationship with visual function.[19] Cut-off value for K prob is 25.55 for clinical keratoconus and 11.60 for pre-keratoconus] [Fig. 7].[21]
11) Percentage probability of keratoconus (PPK) is calculated from a validated equation incorporating CLMI using axial data. It is defined as optimal threshold for detecting keratoconus. Cutoff value for clinical KC is 45.0% & for pre-keratoconus is 20.0%. It is however inefficient in diagnosing pre-keratoconus] [Fig. 7].[19]
Comparison of topographic indices
In our previous published work, we found that IHD, KI, ISV, IHA, ARTmax and BAD-D on Pentacam, PPK on Galilei and BCVf and SIf on Sirius show 100% sensitivity in distinguishing the keratoconus cases from the controls.[21] IHA (80%) on Pentacam, SRI and AAI on Galilei (100% each) and SIb, BCVf, and 8 mm RMS/A back (100% each) on Sirius were highly specific in diagnosing keratoconus. ISV and IHA (100%) on Pentacam, CSI (97.3%) on Galilei, and SIf (29.7%) on Sirius were highly sensitive in distinguishing subclinical keratoconus from controls; whereas IHA and curvature radius (100%) on Pentacam, OSI on Galilei (95.3%) and SIb (100%) on Sirius were the most specific indices in diagnosing the subclinical cases.[21]
The comparison of the best parameters of all three machines shows that the Belin/Ambrosio enhanced ectasia total derivation (BAD-D) and the inferior-superior value (ISV) on the Pentacam are statistically similar to the 4.5 mm root mean square per unit area (RMS/A) back of Sirius and the Keratoconus Prediction Index (KPI) and Keratoconus probability (Kprob) on Galilei. BAD-D was similar to the surface regularity index (SRI) of Galilei in differentiating subclinical keratoconus cases from normal cases.[21]
Repeatability of scheimpflug topography devices
Repeatablility is the agreement in measurements taken by a single instrument under the same conditions. The thinnest corneal thickness (TCT) and steepest keratometry value are of prime importance in the diagnosis of primary ectasia.[25] Hence good repeatability of the keratometric readings is imperative for the optimal management of keratoconus and identifying progression.[26,27] Accuracy in the sizing of an ICL depends on appropriate measurement of Anterior chamber depth in addition to other factors. Poor repeatability and significant variations in the measurements would lead to compromised outcomes.[28,29,30]
The Pentacam, Galilei, and Sirius show accuracy on repeated measurement of mean keratometry (Km), thinnest corneal thickness (TCT), anterior chamber depth (ACD), and mean posterior keratometry pKm.[31] Repeatability of the above-mentioned parameters is better on the Pentacam and Sirius than on Galilei. Bias in the agreement of pKm and ACD measurements is observed with all the three devices.[31] A wide 95% limits of agreement (LoA) amongst the three devices reported in the study by Shetty et al., concludes that the three devices should not be used interchangeably for the detection of progression in keratoconus.[31]
Meyer et al. in their study assessing the repeatability and agreement of Orbscan II, Pentacam HR and Galilei tomography systems in corneas with keratoconus concluded that the Keratometric and pachymetric measurements obtained by Galilei, Pentacam, and Orbscan II were varied and independent of each other. The Orbscan II showed the least repeatability as compared to Pentacam HR and Galilei. However, the overall repeatability was high for all instruments. Hence, the use of the Orbscan II, Pentacam HR and Galilei interchangeably may be lead to inaccuracy in measurement is not advised.[32]
Role of Epithelium in assessing true topographic outcomes
The epithelium affects the refractive power of the cornea, and consequently contributes to the total refractive power of the eye.[33] This effect is produced by the difference in refractive indices of the tear film and air and the difference between the refractive index of the epithelium and the stroma (1.40 vs 1.377).[34] Vogt et al. described in 1921 the masking effect of the corneal epithelium in patients with irregular stromal surfaces.[35] This compensatory mechanism was observed in all conditions which are associated with an irregularity of the stromal surface like irregular astigmatism, radial keratotomy, corneal scars and keratoconus.[36] Thus, the curvature measured at the air-epithelium (A-E) interface may not be the same as the curvature at the epithelium-bowman's layer (E-B) interface of a keratoconic cornea and hence clinical evaluation of the curvature of the E-B interface is also critical.
The E-B interface and its distinct differences from the anterior corneal surface curvature pattern are clinically very relevant to assess true flattening post cross-linking.[36] Based on a recent three-dimensional study of epithelium and stromal thickness profile in keratoconus eyes, the E-B interface should be steeper than the A-E surface since the epithelium thickness is no longer uniform, which would otherwise imply that the A-E surface and E-B interface would have the same curvature distribution.[37,38]
In the case of ectasia or keratoconus progression, it is unknown as to which clinical feature, i.e., thinning of the epithelium or stroma, occurs earlier though clinical evidence appears to suggest that structural stromal changes lead to epithelial thinning.[39] Biomechanical models of corneal crosslinking have shown a relationship between post-crosslink flattening and stromal stiffness and that flattening at the E-B rather than the A-E interface would allow a clearer understanding of this relationship.
Thus understanding and imaging the epithelium and quantifying epithelial changes to determine actual changes at the E-B interface derived from a non-contact OCT could help us in understanding keratoconus better and can also help in determining actual flattening at the stroma post cross-linking.
Cases
Case 1
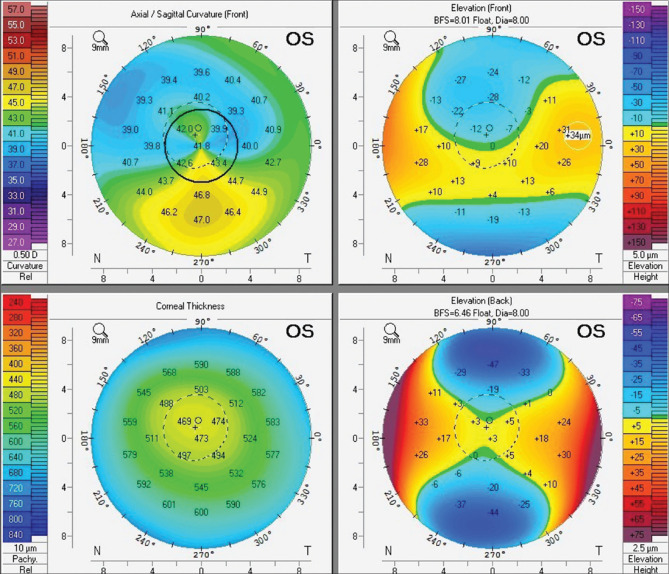
This patient underwent laser refractive surgery elsewhere and was referred with a diagnosis of Corneal ectasia post-LASIK. On cursory examination, we see inferior steepening as seen in ectatic corneal conditions. Points to be noted are as follows. [Fig. 8]
Figure 8.
Case Example 1: Refractive Four Map of Pentacam showing steepening in the inferior part of cornea with high I_S asymmetry and superior flattening on axial curvature map. The posterior elevation map showing non-significant elevation
On Axial curvature map, we see steepening inferiorly with high I-S asymmetry and Superior flattening. However, there is no corresponding thinning in the inferior quadrant on pachymetry map which is associated with ectasia.
The posterior elevation map however does not show significant elevation which would be indicative of ectasia. The superior elevation changes in the elevation front map is in sync with the axial curvature map.
The pachymetry map in this post LASIK patient also appears slightly decentered, indicative of some decentration in ablation.
This patient was diagnosed with decentered ablation rather than ectasia. This example typically highlights the basics of diagnosing keratoconus or post-LASIK ectasia; the areas of steepening have to coincide with areas of thinning and areas of anterior and posterior elevation abnormalities. In the absence of these, we should re-evaluate thoroughly in order to understand the actual diagnosis.
Case 2
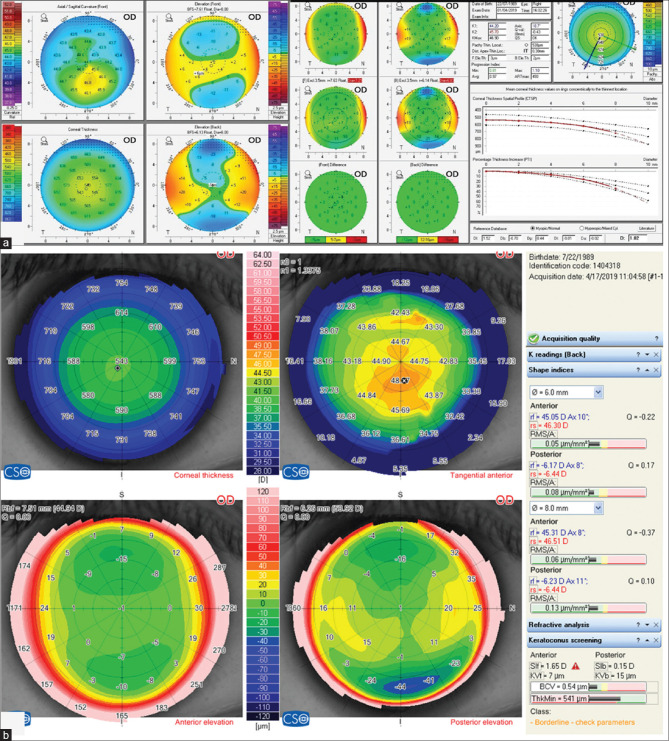
The patient diagnosed as a case of keratoconus in 2018, came back for follow-up in 2020.
The pentacam comparative maps [Fig. 9a] showed significant progression over 2 years.
Figure 9.

(a) Case Example 2: Pentacam Comparative Map showing progression over 2 years. (b) Case Example 2: Scheimpflug image showing missed edge detection (as denoted by the blue arrows) at air epithelium interface
However in the scheimpflug image shown [Fig. 9b], it can be seen that the tracker for the anterior corneal surface has clearly missed detection in the paracentral area and the edge is also shifted leading to a missed edge detection. The topographer is thus providing us a falsely higher reading in terms of anterior curvature in this eye in this cross-section. Hence when following up complex irregular corneas for progression or subtle keratometry or pachymetry changes, it is important to also verify if the scheimpflug device is actually detecting the corneal surfaces appropriately. If we do not inculcate the habit of interpreting topo/tomography maps of complex corneas along with a quick screen of their scheimpflug images for edge detection, we are likely to miss crucial information.
Case 3
If we look at the following two topographies of the same eye imaged on two topographers (Pentacam and Sirius) [Fig. 10a and b], we can see that Pentacam has diagnosed the cornea as normal, whereas Sirius has suggested the same as borderline or suspicious. Generally, presence of a superior-inferior asymmetry of >1.1D is considered suspicious. The BAD-D index, which is the most popular among the indices for keratoconus screening in Pentacam does not include vertical asymmetry in axial curvature among the 9 parameters it includes for the final BAD-D derivation. A reason why this is not considered is because, this asymmetry could arise partly due to a slightly eccentric (superior or inferior) fixation at the time of the scan. Sirius considers this asymmetry in diagnosing keratoconus (Sif index), and hence diagnoses the same as suspicious.
Figure 10.
(a) Case Example 3: Refractive Four Maps of Pentacam and Belin/Ambrosio Enhanced Ectasia Display where cornea has been diagnosed as normal. (b) Case Example 3: Refractive Four Map in Sirius showing cornea as suspicious
The above final example is not to highlight differences or try and reach to a conclusion of which is right. But it is basically important to understand that there could be differences between existing devices. The actual nature of this cornea can only be studied on long-term follow-up and by utilizing BIG-DATA, which can incorporate more parameters than just topography and tomography. Until then and even after that, it is always important to use our own clinical discretion beyond what any device displays.
Conclusion
There are multiple topographic devices and their indices are used for diagnosis, detecting progression and deciding management. Thus, understanding the various indices of each topographer, their repeatability, and comparing these indices across topographers can in a long way help us in early detection in keratoconus. Epithelium can also play an important role which is invariably not considered while imaging through topographers.
Financial support and sponsorship
Nil.
Conflicts of interest
There are no conflicts of interest.
References
- 1.Ayatollahi H, Darabi Mahboub MR, Mohammadian N, Parizadeh MR, Kianoosh T, Khabbaz Khoob M, et al. Ratios of free to total prostate-specific antigen and total prostate specific antigen to protein concentrations in saliva and serum of healthy men. Urol J. 2007;4:238–41. [PubMed] [Google Scholar]
- 2.Randleman JB, Trattler WB, Stulting RD. Validation of the ectasia risk score system for preoperative laser in situ keratomileusis screening. Am J Ophthalmol. 2008;145:813–8. doi: 10.1016/j.ajo.2007.12.033. [DOI] [PMC free article] [PubMed] [Google Scholar]
- 3.Binder PS. Analysis of ectasia after laser in situ keratomileusis: Risk factors. J Cataract Refract Surg. 2007;33:1530–8. doi: 10.1016/j.jcrs.2007.04.043. [DOI] [PubMed] [Google Scholar]
- 4.Ambrósio R, Klyce SD, Wilson SE. Corneal topographic and pachymetric screening of keratorefractive patients. J Refract Surg. 2003;19:24–9. doi: 10.3928/1081-597X-20030101-05. [DOI] [PubMed] [Google Scholar]
- 5.Twa M. Irregular astigmatism: Diagnosis and treatment. Optom Vis Sci. 2009;86:1209. [Google Scholar]
- 6.Ambrosio R, Jr, Belin MW. Imaging of the cornea: Topography vs tomography. J Refract Surg. 2010;26:847–9. doi: 10.3928/1081597X-20101006-01. [DOI] [PubMed] [Google Scholar]
- 7.Rabinowitz YS. Keratoconus. Surv Ophthalmol. 1998;42:297–319. doi: 10.1016/s0039-6257(97)00119-7. [DOI] [PubMed] [Google Scholar]
- 8.OCULUS Pentacam Interpretation Manual. Wetzlar, Germany: Oculus; 2005. [Google Scholar]
- 9.Villavicencio OF, Gilani F, Henriquez MA, Izquierdo L, Jr, Ambrósio RR, Jr, Belin MW. Independent population validation of the Belin/Ambrósio enhanced ectasia display: Implications for keratoconus studies and screening. Int J Kerat Ect Cor Dis. 2014;3:1–8. [Google Scholar]
- 10.Ambrósio R, Jr, Caiado AL, Guerra FP, Louzada R, Sinha RA, Luz A, et al. Novel pachymetric parameters based on corneal tomography for diagnosing keratoconus. J Refract Surg. 2011;27:753–8. doi: 10.3928/1081597X-20110721-01. [DOI] [PubMed] [Google Scholar]
- 11.Ambrósio R, Faria-Correia F, Ramos I, Valbon BF, Lopes B, Jardim D, et al. Enhanced screening for ectasia susceptibility among refractive candidates: The role of corneal tomography and biomechanics. Curr Ophthalmol Rep. 2013;1:28–38. [Google Scholar]
- 12.Wahba SS, Roshdy MM, Elkitkat RS, Naguib KM. Rotating Scheimpflug imaging indices in different grades of keratoconus? J Ophthalmol. 2016;2016:6392472. doi: 10.1155/2016/6392472. doi: 10.1155/2016/6392472. [DOI] [PMC free article] [PubMed] [Google Scholar]
- 13.Motlagh MN, Moshirfar M, Murri MS, Skanchy DF, Momeni-Moghaddam H, Ronquillo YC, et al. Pentacam® corneal tomography for screening of refractive surgery candidates: A review of the literature, Part I. Med Hypothesis Discov Innov Ophthalmol. 2019;8:177–203. [PMC free article] [PubMed] [Google Scholar]
- 14.Kanellopoulos AJ, Asimellis G. Revisiting keratoconus diagnosis and progression classification based on evaluation of corneal asymmetry indices, derived from Scheimpflug imaging in keratoconic and suspect cases. Clin Ophthalmol. 2013;7:1539–48. doi: 10.2147/OPTH.S44741. [DOI] [PMC free article] [PubMed] [Google Scholar]
- 15.Bae GH, Kim JR, Kim CH, Lim DH, Chung ES, Chung TY. Corneal topographic and tomographic analysis of fellow eyes in unilateral keratoconus patients using Pentacam. Am J Ophthalmol. 2014;157:103–9e1. doi: 10.1016/j.ajo.2013.08.014. [DOI] [PubMed] [Google Scholar]
- 16.Ruiseñor Vázquez PR, Galletti JD, Minguez N, Delrivo M, Fuentes Bonthoux F, Pförtner T, et al. Pentacam Scheimpflug tomography findings in topographically normal patients and subclinical keratoconus cases. Am J Ophthalmol. 2014;158:32–40e2. doi: 10.1016/j.ajo.2014.03.018. [DOI] [PubMed] [Google Scholar]
- 17.Chan TC, Wang YM, Yu M, Jhanji V. Comparison of corneal dynamic parameters and tomographic measurements using Scheimpflug imaging in keratoconus. Br J Ophthalmol. 2018;102:42–7. doi: 10.1136/bjophthalmol-2017-310355. [DOI] [PubMed] [Google Scholar]
- 18.Huseynli S, Abdulaliyeva F. Evaluation of Scheimpflug tomography parameters in subclinical keratoconus, clinical keratoconus and normal caucasian eyes. Turk J Ophthalmol. 2018;48:99–108. doi: 10.4274/tjo.89587. [DOI] [PMC free article] [PubMed] [Google Scholar]
- 19.Moshirfar M, Motlagh MN, Murri MS, Momeni-Moghaddam H, Ronquillo YC, Hoopes PC. Galilei corneal tomography for screening of refractive surgery candidates: A review of the literature, Part II. Med Hypothesis Discov Innov Ophthalmol. 2019;8:204–18. [PMC free article] [PubMed] [Google Scholar]
- 20.Smadja D, Touboul D, Cohen A, Doveh E, Santhiago MR, Mello GR, et al. Detection of subclinical keratoconus using an automated decision tree classification. Am J Ophthalmol. 2013;156:237–46e1. doi: 10.1016/j.ajo.2013.03.034. [DOI] [PubMed] [Google Scholar]
- 21.Shetty R, Rao H, Khamar P, Sainani K, Vunnava K, Jayadev C, et al. Keratoconus screening indices and their diagnostic ability to distinguish normal from ectatic corneas. Am J Ophthalmol. 2017;181:140–8. doi: 10.1016/j.ajo.2017.06.031. [DOI] [PubMed] [Google Scholar]
- 22.Maeda N, Klyce SD, Smolek MK, Thompson HW. Automated keratoconus screening with corneal topography analysis. Invest Ophthalmol Vis Sci. 1994;35:2749–57. [PubMed] [Google Scholar]
- 23.Maeda N, Klyce SD, Smolek MK. Neural network classification of corneal topography. Preliminary demonstration. Invest Ophthalmol Vis Sci. 1995;36:1327–35. Erratum in: Invest Ophthalmol Vis Sci 1995;36:1947-8. [PubMed] [Google Scholar]
- 24.Kocamis SI, Cakmak HB, Cagil N, Toklu Y. Investigation of the efficacy of the cone location and magnitude index in the diagnosis of keratoconus. Semin Ophthalmol. 2016;31:203–9. doi: 10.3109/08820538.2014.914234. [DOI] [PubMed] [Google Scholar]
- 25.Li Y, Meisler DM, Tang M, Lu AT, Thakrar V, Reiser BJ, et al. Keratoconus diagnosis with optical coherence tomography pachymetry mapping. Ophthalmology. 2008;115:2159–66. doi: 10.1016/j.ophtha.2008.08.004. [DOI] [PMC free article] [PubMed] [Google Scholar]
- 26.Kymionis GD, Kontadakis GA, Kounis GA, Portaliou DM, Karavitaki AE, Magarakis M, et al. Simultaneous topography-guided PRK followed by corneal collagen cross-linking for keratoconus. J Refract Surg. 2009;25:S807–11. doi: 10.3928/1081597X-20090813-09. [DOI] [PubMed] [Google Scholar]
- 27.Choi JA, Kim MS. Progression of keratoconus by longitudinal assessment with corneal topography. Invest Ophthalmol Vis Sci. 2012;53:927–35. doi: 10.1167/iovs.11-8118. [DOI] [PubMed] [Google Scholar]
- 28.Shafik Shaheen M, El-Kateb M, El-Samadouny MA, Zaghloul H. Evaluation of a toric implantable collamer lens after corneal collagen crosslinking in treatment of early-stage keratoconus: 3-year follow-up. Cornea. 2014;33:475–80. doi: 10.1097/ICO.0000000000000094. [DOI] [PubMed] [Google Scholar]
- 29.Holladay JT, Prager TC, Chandler TY, Musgrove KH, Lewis JW, Ruiz RS. A three-part system for refining intraocular lens power calculations. J Cataract Refract Surg. 1988;14:17–24. doi: 10.1016/s0886-3350(88)80059-2. [DOI] [PubMed] [Google Scholar]
- 30.Kummelil MK, Hemamalini MS, Bhagali R, Sargod K, Nagappa S, Shetty R, et al. Toric implantable collamer lens for keratoconus. Indian J Ophthalmol. 2013;61:456–60. doi: 10.4103/0301-4738.116064. [DOI] [PMC free article] [PubMed] [Google Scholar]
- 31.Shetty R, Arora V, Jayadev C, Nuijts RM, Kumar M, Puttaiah NK, et al. Repeatability and agreement of three Scheimpflug-based imaging systems for measuring anterior segment parameters in keratoconus. Invest Ophthalmol Vis Sci. 2014;55:5263–8. doi: 10.1167/iovs.14-15055. [DOI] [PubMed] [Google Scholar]
- 32.Meyer JJ, Gokul A, Vellara HR, Prime Z, McGhee CN, Repeatability and agreement of Orbscan II. Pentacam HR. and Galilei tomography systems in corneas with keratoconus. Am J Ophthalmol. 2017;175:122–8. doi: 10.1016/j.ajo.2016.12.003. [DOI] [PubMed] [Google Scholar]
- 33.Hugger P, Kohnen T, La Rosa FA, Holladay JT, Koch DD. Comparison of changes in manifest refraction and corneal power after photorefractive keratectomy. Am J Ophthalmol. 2000;129:68–75. doi: 10.1016/s0002-9394(99)00268-8. [DOI] [PubMed] [Google Scholar]
- 34.Patel S, Marshall J, Fitzke FW., 3rd Refractive index of the human corneal epithelium and stroma. J Refract Surg. 1995;11:100–5. doi: 10.3928/1081-597X-19950301-09. [DOI] [PubMed] [Google Scholar]
- 35.Vogt A. Textbook and Atlas of Atlas of Slit Lamp Microscopy of the Living Eye. Bonn, Germany: Wayenborgh Editions; 1981. [Google Scholar]
- 36.Reinstein DZ, Gobbe M, Archer TJ, Youssefi G, Sutton HF. Stromal surface topography-guided custom ablation as a repair tool for corneal irregular astigmatism. J Refract Surg. 2015;31:54–9. doi: 10.3928/1081597X-20141218-06. [DOI] [PubMed] [Google Scholar]
- 37.Patel S, Reinstein DZ, Silverman RH, Coleman DJ. The shape of Bowman's layer in the human cornea. J Refract Surg. 1998;14:636–40. doi: 10.3928/1081-597X-19981101-11. [DOI] [PubMed] [Google Scholar]
- 38.Touboul D, Trichet E, Binder PS, Praud D, Seguy C, Colin J. Comparison of front-surface corneal topography and Bowman membrane specular topography in keratoconus. J Cataract Refract Surg. 2012;38:1043–9. doi: 10.1016/j.jcrs.2012.01.026. [DOI] [PubMed] [Google Scholar]
- 39.Reinstein DZ, Gobbe M, Archer TJ, Silverman RH, Coleman DJ. Epithelial, stromal, and total corneal thickness in keratoconus: Three-dimensional display with artemis very-high frequency digital ultrasound. J Refract Surg. 2010;26:259–71. doi: 10.3928/1081597X-20100218-01. [DOI] [PMC free article] [PubMed] [Google Scholar]


