Abstract
Global concerns have been observed due to the outbreak and lockdown causal-based COVID-19, and hence, a global pandemic was announced by the World Health Organization (WHO) in January 2020. The Movement Control Order (MCO) in Malaysia acts to moderate the spread of COVID-19 through the enacted measures. Furthermore, massive industrial, agricultural activities and human encroachment were significantly reduced following the MCO guidelines. In this study, first, a reconnaissance survey was carried out on the effects of MCO on the health conditions of two urban rivers (i.e., Rivers of Klang and Penang) in Malaysia. Secondly, the effect of MCO lockdown on the water quality index (WQI) of a lake (Putrajaya Lake) in Malaysia is considered in this study. Finally, four machine learning algorithms have been investigated to predict WQI and the class in Putrajaya Lake. The main observations based on the analysis showed that noticeable enhancements of varying degrees in the WQI had occurred in the two investigated rivers. With regard to Putrajaya Lake, there is a significant increase in the WQI Class I, from 24% in February 2020 to 94% during the MCO month of March 2020. For WQI prediction, Multi-layer Perceptron (MLP) outperformed other models in predicting the changes in the index with a high level of accuracy. For sensitivity analysis results, it is shown that NH3-N and COD play vital rule and contributing significantly to predicting the class of WQI, followed by BOD, while the remaining three parameters (i.e. pH, DO, and TSS) exhibit a low level of importance.
Keywords: Water quality index, Surface water quality, Movement control operation, COVID-19 pandemic
Introduction
Water is the key natural factor for human survival and social growth as well as for ecological (i.e., natural, biological, and environmental) health (Rezaie-Balf et al. 2020). Whether drinking or personal hygiene, water is the fundamental element for manufacturing, agricultural, and biotransformation purposes. Water pollution has become a serious problem worldwide in the last few decades, especially in developing countries (Avellán and Gremillion 2019; Xu et al. 2019; Abba et al. 2020).
The status of river water quality in Malaysia has been a persistent concern for several local authorities, government bodies, and the public. Malaysian rivers are generally regarded to be polluted, some of them being Juru River in Penang, Skudai River in Johor, and Klang River in Selangor and Kuala Lumpur (VishnuRadhan et al. 2015; Othman et al. 2020).
The water quality of several rivers systems is checked regularly by the Malaysian authorities. These checks provide crucial information on the condition of the waterways and help plan an adequate floodplain management action for the river basin (Caddis et al. 2012). Therefore, this study utilizes the collected information to create an understanding of the functioning of waterways and the interaction of contaminants with nutrients over time in the river systems.
Additionally, water quality research is a crucial priority issue because it directly affects the lives of people and needs more commitment from decision-makers. Variables regularly inspected include temperature, pH, conductivity, dissolved oxygen (DO), nutrient concentration, chemical oxygen demand (COD), total suspended solids (TSS), ammoniacal nitrogen (NH3–N), and biological oxygen demand (BOD). Water quality index (WQI) is a measure of the physical, chemical, and biological characteristics of water (Najah et al. 2011b). It helps gauge water quality. The index is typically used to provide information on water suitability for different uses like drinking, aquatic life, or recreation. In Malaysia, WQI measurement comprises six chemical parameters that are dissolved oxygen (DO), pH, chemical oxygen demand (COD), suspended solids (SS), ammoniacal nitrogen (NH3–N), and biological oxygen demand (BOD) (Nurul-Ruhayu et al. 2015).
Recently, many news and research studies have reported a noticeable improvement in the quality of water during the lockdown with the Movement Control Order (MCO) due to the COVID-19 outbreak (Saadat et al. 2020; Yunus et al. 2020). The lockdown has brought about a decrease or complete stop on the pollutant discharge affecting the aquatic ecosystem. The pollutants include heavy metals, wastewater, crude oil, and plastic, among others (Häder et al. 2020).
Vembanad Lake, which is the longest freshwater lake in India, has seen considerable improvement in the suspended particulate matter (Yunus et al. 2020). In this study, it was observed that an average of 15.9% reduced the concentration of suspended particulate matter (SPM) during the lockdown period compared to the pre-lockdown time. The SPM concentration dropped by 34% in April 2020, compared to longer-term measurements over the previous years.
In India, massive quantities of industrial discharge, untreated sewage, agricultural and urban runoff, and landfill leachates are discharged into the Ganga River. A decrease in DO concentration and the creation of hypoxic zone caused fish to die, causing a trophic cascade and affecting nutritional and livelihood security in the area. Since the nationwide lockdown from March 21, 2020, River Ganga has been cleaner in many places. The water quality of the Ganga River has improved with the rise in DO and decreased concentration of nitrate. The Ganga tributaries were also refined due to the rise in DO concentrations during the lockdown period.
The Yamuna is another major Indian river that is much polluted. This river is crucial to the daily life of the population dwelling on the banks and surrounding areas. The rapidly rising population and the industrial revolution during several previous decades caused immense pollution, and it is now among the most polluted rivers globally. Domestic waste discharge through minor and main drains and industrial effluents are responsible for the current state of the river (Sharma et al. 2020). With the lockdown still in effect, the waters of the Yamuna River have seen a considerable rise in quality, especially in areas where there are lesser industrial activity and human encroachments. Reports indicate that a reduction in human and industrial activity has led to betterment in the water quality of the Yamuna River (Said and Hussain 2019; Sharma et al. 2020). In Venice, the turbidity is extremely affected by boat waves; however, during the restriction, a noticeable improvement was reported in water due to the reduction in boat traffic (Braga et al. 2020). However, this is less applicable in Malaysia, where there is a small density of boating traffic.
The primary objective of this study was to evaluate the effects of the COVID-19-induced MCO lockdown on the water quality of the lakes and rivers in Malaysia. Two urban rivers (i.e., Rivers of Klang and Penang) and a lake (Putrajaya Lake) were selected for the investigative study. A preliminary analysis of the WQI status before and during the lockdown with MCO due to the COVID-19 outbreak has been carried out in this study.
Materials and methods
Water quality before the movement control order (MCO)
Klang River
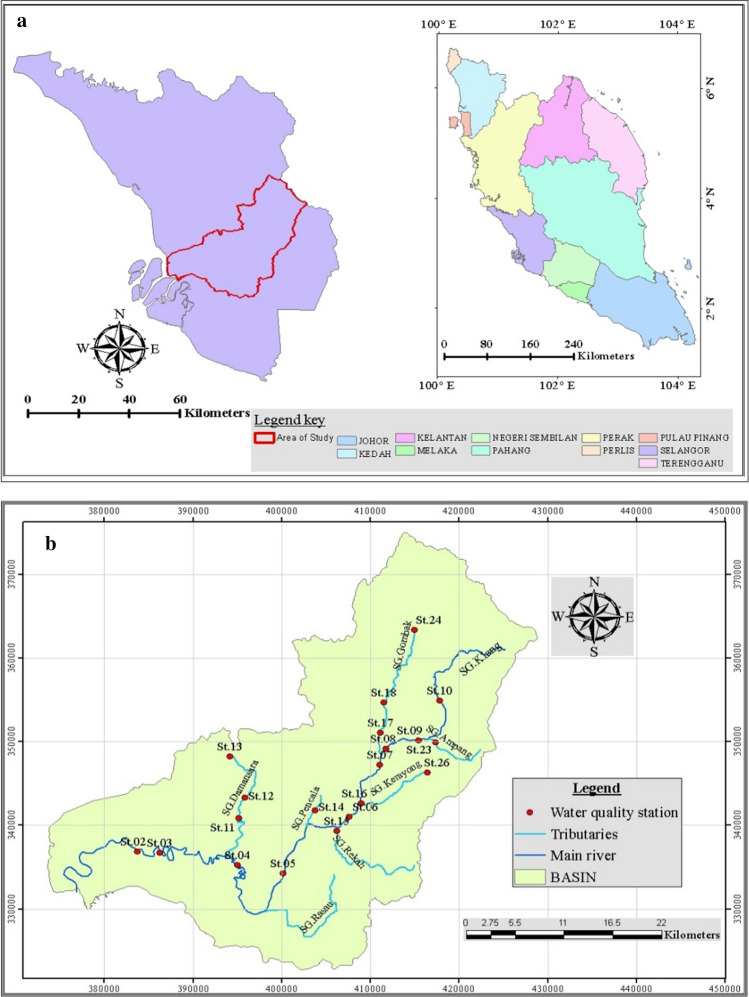
The Klang River is one of the best examples in Malaysia of frequently polluted rivers as a result of rapid urbanization. The Klang River basin lies on the western coast of peninsular Malaysia. It originates from the mountainous region located 25 km Northeast of Kuala Lumpur. Eleven significant tributaries join the river, while it crosses the Federal Territory of Kuala Lumpur and Selangor State downstream before it discharges at Port Klang in the Straits of Malacca.
Figure 1 shows the location of the river and where the water quality monitoring stations are located. The Klang River runs for a total length of 120 km. The massive discharge of several emerging organic wastes in the river’s estuary ecosystem was due to heavy industry, plantations, commercial, and residential activity from populated urban cities (Nazifa et al. 2020). It has been reported that the downstream part of Klang River is polluted, and the class of the river water quality, in general, considers Class V; therefore, there is a need for extensive treatment before the water can be used for domestic purposes (Mohamed et al. 2015).
Fig. 1.
a Location of Klang River basin and b The stations of water quality monitoring (Rezaie-Balf et al. 2020)
Penang River
The Penang River basin covers an area of about 50 km2, encompassing a majority of George Town and the entirety of Paya Terubong and Ayer Itam. Six tributaries feed the river, which all flow through densely populated urban centers of the island. The water quality of the Penang River was categorized as Class IV (Huang et al. 2015), which is next only to the dead river classification. For more than a decade, there have been plans to target a Class II water quality. A majority of the rivers in Penang Island were polluted or slightly polluted. Surface runoff and domestic sewage are the most significant point sources of pollution in the rivers of Penang Island. The waste from nearby communities’ discharges into the river, reducing river water quality. The rivers in the Western and Eastern areas of the island are most affected (Nurul-Ruhayu et al. 2015). Razali et al. (2020) conducted a study that confirmed the sources of river water pollution were agricultural activity associated with landslides, soil erosion, and land clearance. In addition to that, a study conducted by Muhamad et al. (2020) found the status of the Penang River is polluted, which is classified as class V.
Monitoring stations for both Klang and Penang Rivers are operated by DOE, which runs and oversees the water quality of all Malaysian rivers (DOE | Ministry of Environment and Water, Malaysia).
Putrajaya Lake
Putrajaya Lake is located at a significant part of Malaysia’s administrative center that offers a self-sustainable scenic ecosystem for sports, recreation, and tourism. The constructed lake has been present since 2001 and is a significant urban lake that was created after inundating the Bisa and Chuau Rivers, having an area of 400 ha. As per the ecohydrological management technique, artificial wetlands created using a multi-stage and multi-cell approach, built upstream of the Putrajaya Lake, serve as a crucial filtering system that is responsible for treating pollutants and storm runoff before the water drains into the Langat River (Teo et al. 2017).
To make sure that the wetlands and the Putrajaya Lake remain in balance and serve as favorable urban ecosystems, water quality and catchment are considered in an integrated manner comprising thorough monitoring and assessment of the ecosystem’s status (Noordin et al. 2016). Data gathered from 17 sampling stations provide information about the water quality, especially to identify point-source-induced pollution in the lake. For Putrajaya Lake, these data serve to generate the WQI. The Malaysian Department of Environment (DOE) uses the National Water Quality Standards for Malaysia (NWQS) and water quality index (WQI) to assess the river water quality (Huang et al. 2015). Malaysia has been using the WQI system proposed by the DOE for the past 25 years. The system is the basis for evaluating environmental water quality, whereas the NWQS classifies the benefits of the watercourse using WQI. This index is calculated based on six parameters DO, BOD, COD, pH, NH3–N, and SS. Figure 2 illustrates Water Quality Classification based on WQI. Class I means the river status is very good, while Class II is good. Class III means the river quality status is average, while Class IV and Class V is slightly polluted and polluted, respectively.
Fig. 2.
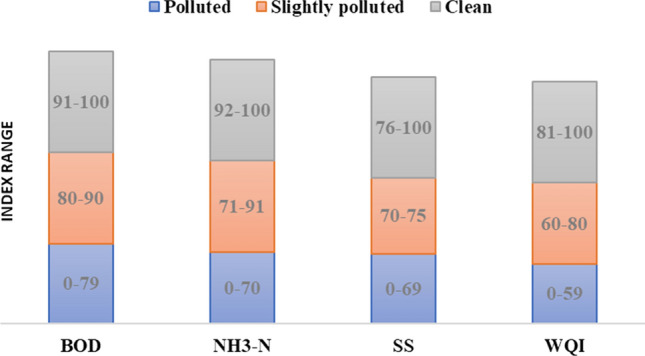
DOE classification of water quality based on the water quality index
Therefore, the water quality improvements in the lake are based on the WQI classification status. Public amenities, including toilets in residential areas, were observed to have occasional sewage backflow or overflow in public holidays or during events (Sharip et al. 2016). It can be seen from Table 1 that the quality of the lake had deteriorated, and it degraded from WQI Class I to Class II. Basically, water quality in the Putrajaya Lake is classified as moderate good to good, corresponding to Class II and Class I.
Table 1.
WQI classification (%) for the Putrajaya Lake from 2011–2019 (Adapted from (BAHAGIAN ALAM SEKITAR, TASIK DAN WETLAND PERBADANAN PUTRAJAYA. http://plwmos.ppj.gov.my/. Accessed 5 May 2020b)
| Year | Class | ||
|---|---|---|---|
| I | II | III | |
| 2011 | 67.0% | 33.0% | |
| 2012 | 40.0% | 60.0% | |
| 2013 | 8.0% | 91.0% | 1.0% |
| 2014 | 6.1% | 93.9% | |
| 2015 | 12.7% | 87.3% | |
| 2016 | 14.7% | 85.3% | |
| 2017 | 12.3% | 87.7% | |
| 2018 | 4.9% | 95.1% | |
| 2019 | 15.7% | 84.3% | |
Model development
Recently, machine learning algorithms were utilized by many researchers to predict most water quality parameters accurately and proved its efficiency (Rahgoshay et al. 2018; Ho et al. 2019; Najah Ahmed et al. 2019). In this study, four different machine learning algorithms, namely multi-layer perceptron (MLP), support vector machine (SVM), random forest (RF), and boosted decision tree (BDT), have been proposed to predict the changes in water quality parameters. More details about these models can be seen in (Choi et al. 2018; Lai et al. 2019; Jumin et al. 2020; Muslim et al. 2020). After developing the above-mentioned techniques, the performance of these techniques was evaluated based on comparing the actual and the predicted data from each technique and based on the relative error percent, which can measure the discrepancy between the predicted and the observed data (Fiyadh et al. 2019):
| 1 |
Finally, sensitivity analysis is recommended by researchers to check how sensitive is the model’s accuracy with each input parameter (Ibrahim et al. 2019). Therefore, in this study, sensitivity analysis will be introduced to check the redundancy and to determine the significance of each input parameters on the accuracy of the proposed models based on Pearson’s correlation coefficient:
| 2 |
rxy is the covariance correlation function, n is the sample size of the data. xi, yi are the individual sample points indexed with i, and sample mean.
Results and discussion
Water quality after movement control order (MCO)
In news reports as recent as April 2020 (Cleaner waterways and rivers during MCO. https://www.thestar.com.my/news/nation/2020/04/25/cleaner-waterways-and-rivers-during-mco), in over just a month’s time, the water quality for Klang River was stated as noticeably clearer and cleaner. The Global Environment Centre (GEC) stated the significant improvements in river conditions, particularly in the tributaries of Klang River at the Gombak River, the Way River, and the Kemuning River, since the MCO commenced in March in Malaysia.
It was also reported that the Penang River had higher cleanliness during the MCO. In contrast, the pre-MCO pollution was caused due to human activity led by oil spills emerging from factories and workshops, which emulsified and mixed with organic content from the wastewater originating from hawkers, markets, among other sources. With MCO in effect, dumping stopped (Coronavirus: Penang River green again, thanks to MCO. https://www.straitstimes.com/asia/se-asia/penang-river-green-again-thanks-to-mco).
It should be noted that on April 21, the Department of Environment (DOE) in Malaysia has reported that 28% of the 29 real-time water quality stations have shown improvement in the quality of water. At the same time, 44% of the stations shown slight changes in the quality of the water. Finally, the remaining 28% of the stations shown no noticeable changes. These improvements are associated with the temporary cessation of operation for non-essential service; they are reported (Jabatan Alam Sekitar | Facebook. https://www.facebook.com/doe.gov.my/. Accessed 21 April 2020h).
As far as Putrajaya Lake is concerned, the closure of industrial and tourist activity since March 2020 caused the emerging pollution almost to cease. Putrajaya Lake is in a state where it offers an opportunity to study water quality change during the lockdown. It can be observed from Fig. 3 that there has been a significant improvement in water quality in the lake during the lockdown with MCO.
Fig. 3.
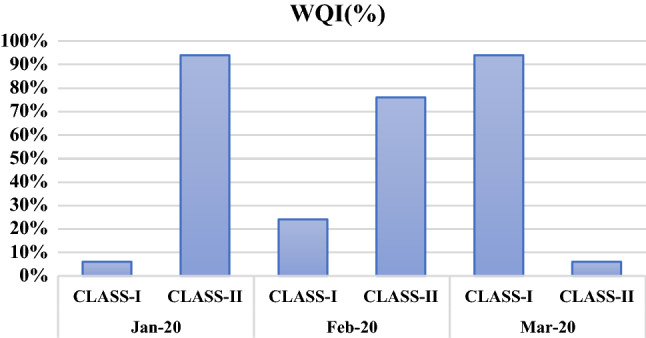
Water quality index for the first three months in 2020 (Adapted from (Perbadanan Putrajaya | Facebook. https://www.facebook.com/putrajaya. Accessed 15 May 2020i))
For example, this improvement had shown a significant increase in the WQI Class I, from 24% in February 2020 to 94% during the MCO month of March 2020. Before the MCO, the lake had only achieved WQI Class II for 94% and 76%, respectively, in January and February 2020. The lake had been deteriorating for some time and had been maintained as WQI Class II before the MCO. During the month of lockdown with MCO in March 2020, the water quality of the lake has experienced a rapid shift from WQI Class II to I. This condition had resulted in the best recorded WQI that had been achieved for the Putrajaya Lake over the past ten years. This is mainly due to its naturally improved water quality since the encroachment of humans had been stopped completely. At the same time, the pollution sources were virtually non-existent as a consequence of the curfew-like MCO. It was found that the three main parameters of the WQI (i.e., TSS, DO, and BOD) had contributed extensively to this improvement of water quality in the lake, as can be seen in Table 2. It is noticeable that the water quality before MCO was Class II, February 2020. Then, since the imposing of the MCO, the water quality became Class I and continued during the entire period of movement control. It should be a highlight that there is slight deterioration after the MCO in the COD.
Table 2.
Average value of water quality parameters
| Time | pH | D.O (mg/l) | BOD (mg/l) | COD (mg/l) | TSS (mg/l) | NH3–N (mg/l) | WQI | Class |
|---|---|---|---|---|---|---|---|---|
| 25-Feb-20 | 7.59 | 7.78 | 4 | 14 | 4 | 0.04 | 92.2 | II |
| 25-Mar-20 | 7.60 | 7.52 | 3 | 7 | 5 | 0.00 | 94.3 | I |
| 8-Apr-20 | 7.57 | 7.69 | 3 | 12 | 4 | 0.01 | 93.4 | I |
| 19-May-20 | 7.55 | 7.85 | 3 | 21 | 2 | 0.05 | 93.3 | I |
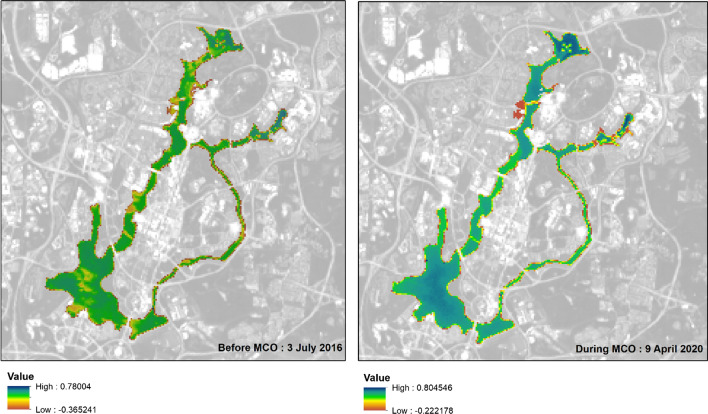
However, it can be seen from Fig. 4 that the COD values post-MCO in 2020 is better than compared with the same month last year, 2019. For example, COD values during post-MCO did not vary much for the entire month of May 2020 where the maximum value was 13 mg/L, while the minimum value was 10 mg/L. While there is a noticeable variation in COD values for the same month in 2019 where the maximum recorded value was 18 mg/L. This indicates that there is improvement in the water quality class of the lake with respect to the COD values during the post-MCO, which is class I compared to the same month in 2019 which Class II. Similarly, the average WQI class for May 2020 is class one, while it was class two during the same month in 2019. In addition to that, Landsat 8 spectral images are used to confirm the improvement of the lake water quality before and during the MCO. Landsat 8 images are gaining popularity among research as an effective tool to monitor the quality of water (González-Márquez et al. 2018a, b). It can be seen from Fig. 5 that the reflectance of the spectral bands of Landsat 8 images is high before MCO compared with the duration during the MCO. Overall, it can be concluded that there is a noticeable improvement in the quality of water.
Fig. 4.
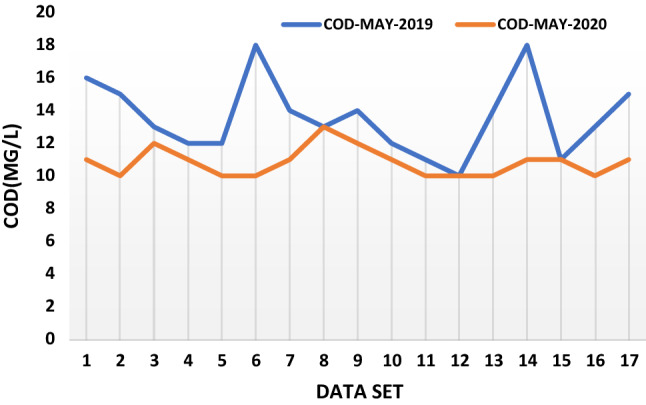
Measured COD during May 2019 and 2020
Fig. 5.
Putrajaya Lake before and after the MCO
Machine learning models
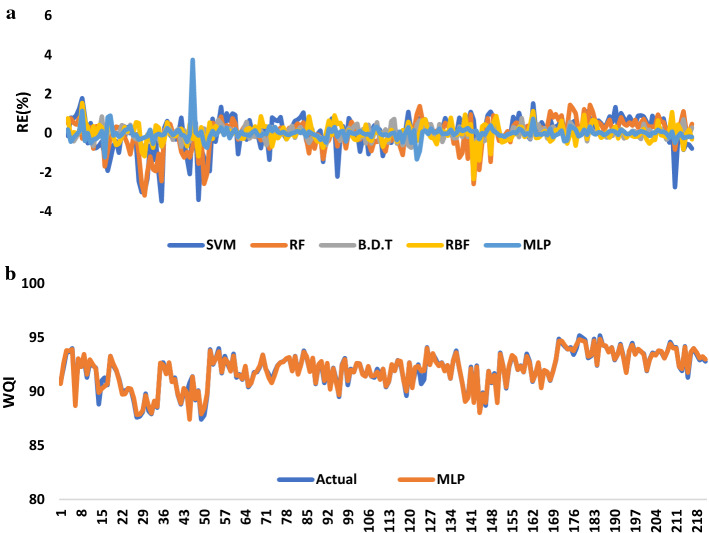
Different machine learning algorithms, namely multi-layer perceptron (MLP), support vector machine (SVM), random forest (RF), and boosted decision tree (BDT), have been proposed to predict the changes in the WQI and the class during the MCO. Figure 6a shows the performances of the proposed four models; these models are recommended by many researchers (Najah et al. 2011a, 2013, 2014; Najah Ahmed et al. 2012; Ahmed and El-Shafie 2014; Yahya et al. 2019). All models performed well with relative error percent, not exceeding 5%. Figure 6b reveals that MLP outperformed all models in detecting the changes in WQI, followed by BTD, RF, while the lowest performance was observed when the SVM model was used.
Fig. 6.
a Relative error percent, b Actual and predicted best model
To assess how sensitive the proposed model is to each input, sensitivity analysis, one of the techniques, is widely used by many researchers (Najah et al. 2011a; Ahmed and El-Shafie 2014; Sinshaw et al. 2019).
It can be seen from Fig. 7 that NH3–N and COD play vital rule and contribute significantly in predicting the class of WQI, followed by BOD, while the remaining three parameters (pH, DO, and TSS) exhibit a low level of importance. Despite that in order to achieve a high level of accuracy, these six parameters need to be included in building a predictive model.
Fig. 7.
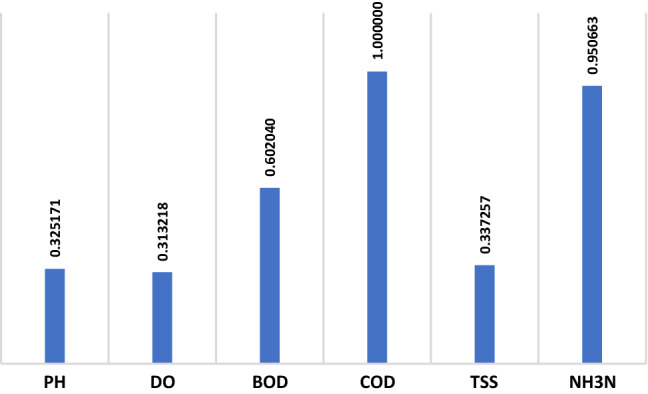
Predictor importance
Despite the impact of COVID-19 from sewerage systems on water bodies not considered in this study, one of the major advantages of the machine learning modeling approach is the unnecessarily to include and consider all the influence variables in the model input, although this variable may affect the model accuracy, with the absence of the sewage water effect, the model still could be developed and provides an acceptable level of accuracy. The accuracy of the proposed machine learning algorithms might be relatively improved once the sewage water effects have been considered. Therefore, future work will be highlighted in conclusion.
Conclusion
Globally, countries have seen their waterways clearing up with decreasing amounts of debris and rubbish due to the minimal contribution of pollution from domestic and industrial activities. Also, it had been shown over the media worldwide that, subsequently, native animals were seen in urban areas as human activity slows down and, in some cases, to a virtual complete stop, drastically thanks to the period of movement restriction and temporarily suspended industrial activities. In Malaysia, there is no doubt that the temporary suspension of non-essential services, including work for development projects, had a positive impact on water quality. During the short MCO period, there were average decreases in COD and BOD, and there was also a slight decrease in total suspended solids (TSS), which contributed to the boost in water quality ([Air and water quality improve during MCO. https://www.nst.com.my/news/nation/2020/04/585488/air-and-water-quality-improve-during-mco. Accessed 15 May 2020h]). This could be due to the fact that while there had been a complete stop of inflowing of pollution from human activities, and there were indeed some days of heavy rainfall due to the monsoon rainfall season (Fakaruddin et al. 2020). Nevertheless, aspects of water quality have been significantly influenced by additional factors like weather, pollutants, and the requirement to create superior sewerage systems to process and treat wastewater from industrial, commercial, and residential sources before discharging the water into the lake or the river. The message is loud and clear, and that is the water quality of all the waterways in Malaysia can only be improved without spending a lot by reducing pollution from all members of the population. With regard to machine learning algorithms, all models performed well with relative error percent, not exceeding 5%. However, the results reveal that MLP outperformed all models in detecting the changes in WQI, followed by BTD, RF, while the lowest performance was observed when the SVM model was introduced. The finding of this study confirms the superiority of the machine learning algorithms in predicting the sudden changes in the quality of water bodies with a high level of accuracy, and it could be used as an effective tool for water resources managers. In the future, machine learning algorithms’ accuracy should be further investigated by considering the impact of COVID-19 from sewerage systems on water bodies.
Acknowledgements
The author would like to thanks BAHAGIAN ALAM SEKITAR, TASIK DAN WETLAND for providing us with the data. In addition to that, we would like to thank puan Awatif Binti Aziz for her help in preparing Fig. 5.
Abbreviation
- WHO
World Health Organization
- MCO
Movement control order
- WQI
Water quality index
- MLP
Multi-layer perceptron
- NH3-N
Ammoniacal nitrogen
- COD
Chemical oxygen demand
- DO
Dissolved oxygen
- TSS
Total suspended solid
- SS
Suspended solid
- SPM
Suspended particulate matter
- DOE
Department of environment
- NWQS
National water quality standards
- SVM
Support vector machine
- RF
Random forest
- BDT
Boosted decision tree
- GEC
Global Environment Centre
Funding
The authors received no financial support for the research.
Availability of data and materials
Data subject to third party restrictions.
Compliance with ethical standards
Conflict of interest
The authors declare that they have no conflict of interest.
Ethical Approval
Not applicable.
Consent to Participate
Not applicable.
Consent to Publish
Not applicable.
References
- Abba SI, Pham QB, Saini G, et al. Implementation of data intelligence models coupled with ensemble machine learning for prediction of water quality index. Environ Sci Pollut Res. 2020 doi: 10.1007/s11356-020-09689-x. [DOI] [PubMed] [Google Scholar]
- Ahmed AN, El-Shafie A (2014) An application Support Vector Machine model (SVM) technique for Biochemical Oxygen Demand (BOD) prediction. Int Conf Artif Intell Pattern Recognition, AIPR 2014, Held 3rd World Congr Comput Inf Technol WCIT 209–212
- Avellán T, Gremillion P. Constructed wetlands for resource recovery in developing countries. Renew Sustain Energy Rev. 2019;99:42–57. doi: 10.1016/j.rser.2018.09.024. [DOI] [Google Scholar]
- Caddis B, Nielsen C, Hong W, Anun Tahir P, Yenn Teo F. Guidelines for floodplain development—a Malaysian case study. Int J River Basin Manag. 2012;10(2):161–170. doi: 10.1080/15715124.2012.688750. [DOI] [Google Scholar]
- Braga F, Scarpa GM, Brando VE, et al. COVID-19 lockdown measures reveal human impact on water transparency in the Venice Lagoon. Sci Total Environ. 2020;736:139612. doi: 10.1016/j.scitotenv.2020.139612. [DOI] [PMC free article] [PubMed] [Google Scholar]
- Choi C, Kim J, Kim J, et al. Development of heavy rain damage prediction model using machine learning based on big data. Adv Meteorol. 2018 doi: 10.1155/2018/5024930. [DOI] [Google Scholar]
- Fakaruddin FJ, Yip WS, Diong JY, et al. Occurrence of meridional and easterly surges and their impact on Malaysian rainfall during the northeast monsoon: a climatology study. Meteorol Appl. 2020 doi: 10.1002/met.1836. [DOI] [Google Scholar]
- Fiyadh SS, AlOmar MK, Binti Jaafar WZ, et al. Artificial neural network approach for modelling of mercury ions removal from water using functionalized CNTs with deep eutectic solvent. Int J Mol Sci. 2019 doi: 10.3390/ijms20174206. [DOI] [PMC free article] [PubMed] [Google Scholar]
- González-Márquez LC, Torres-Bejarano FM, Rodríguez-Cuevas C, et al. Estimation of water quality parameters using Landsat 8 images: application to Playa Colorada Bay, Sinaloa, Mexico. Appl Geomatics. 2018;10:147–158. doi: 10.1007/s12518-018-0211-9. [DOI] [Google Scholar]
- González-Márquez LC, Torres-Bejarano FM, Torregroza-Espinosa AC, et al. Use of LANDSAT 8 images for depth and water quality assessment of El Guájaro reservoir, Colombia. J South Am Earth Sci. 2018;82:231–238. doi: 10.1016/j.jsames.2018.01.004. [DOI] [Google Scholar]
- Häder D-P, Banaszak AT, Villafañe VE, et al. Anthropogenic pollution of aquatic ecosystems: emerging problems with global implications. Sci Total Environ. 2020;713:136586. doi: 10.1016/j.scitotenv.2020.136586. [DOI] [PubMed] [Google Scholar]
- Ho JY, Afan HA, El-Shafie AH, et al. Towards a time and cost effective approach to water quality index class prediction. J Hydrol. 2019;575:148–165. doi: 10.1016/j.jhydrol.2019.05.016. [DOI] [Google Scholar]
- Huang YF, Ang SY, Lee KM, Lee TS. Quality of water resources in Malaysia. Water Qual: Res. Pract; 2015. [Google Scholar]
- Ibrahim S, Choong CE, El-Shafie A. Sensitivity analysis of artificial neural networks for just-suspension speed prediction in solid-liquid mixing systems: performance comparison of MLPNN and RBFNN. Adv Eng Informatics. 2019;39:278–291. doi: 10.1016/j.aei.2019.02.004. [DOI] [Google Scholar]
- Jumin E, Zaini N, Ahmed AN, et al. Machine learning versus linear regression modelling approach for accurate ozone concentrations prediction. Eng Appl Comput Fluid Mech. 2020;14:713–725. doi: 10.1080/19942060.2020.1758792. [DOI] [Google Scholar]
- Lai V, Ahmed AN, Malek MA, et al. Modeling the nonlinearity of sea level oscillations in the Malaysian Coastal Areas using machine learning algorithms. Sustain. 2019 doi: 10.3390/su11174643. [DOI] [Google Scholar]
- Mohamed I, Othman F, Ibrahim AIN, et al. Assessment of water quality parameters using multivariate analysis for Klang River basin, Malaysia. Environ Monit Assess. 2015;187:1–12. doi: 10.1007/s10661-014-4182-y. [DOI] [PubMed] [Google Scholar]
- Muhamad SNN, Idris MFIM, Wahab NIH, Shahidan WNW. Charting the sustainable future of ASEAN in science and technology. Singapore: Springer; 2020. Fuzzy logic water quality index (FWQI) model in determining the water quality status of river in Penang Island; pp. 399–410. [Google Scholar]
- Muslim TO, Ahmed AN, Malek MA, et al. Investigating the influence of meteorological parameters on the accuracy of sea-level prediction models in Sabah. Malaysia Sustainability. 2020;12:1193. doi: 10.3390/su12031193. [DOI] [Google Scholar]
- Najah A, El-Shafie A, Karim OA, et al. An application of different artificial intelligences techniques for water quality prediction. Int J Phys Sci. 2011;6:5298–5308. doi: 10.5897/IJPS11.1180. [DOI] [Google Scholar]
- Najah A, El-Shafie A, Karim OA, Jaafar O. Integrated versus isolated scenario for prediction dissolved oxygen at progression of water quality monitoring stations. Hydrol Earth Syst Sci. 2011;15:2693–2708. doi: 10.5194/hess-15-2693-2011. [DOI] [Google Scholar]
- Najah A, El-Shafie A, Karim OA, El-Shafie AH. Application of artificial neural networks for water quality prediction. Neural Comput Appl. 2013;22:187–201. doi: 10.1007/s00521-012-0940-3. [DOI] [Google Scholar]
- Najah A, El-Shafie A, Karim OA, El-Shafie AH. Performance of ANFIS versus MLP-NN dissolved oxygen prediction models in water quality monitoring. Environ Sci Pollut Res. 2014;21:1658–1670. doi: 10.1007/s11356-013-2048-4. [DOI] [PubMed] [Google Scholar]
- Najah Ahmed A, El-Shafie A, Karim OA, El-Shafie A. An augmented wavelet de-noising technique with neuro-fuzzy inference system for water quality prediction. Int J Innov Comput Inf Control. 2012;8:7055–7082. [Google Scholar]
- Najah Ahmed A, Binti Othman F, Abdulmohsin Afan H, et al. Machine learning methods for better water quality prediction. J Hydrol. 2019;578:124084. doi: 10.1016/j.jhydrol.2019.124084. [DOI] [Google Scholar]
- Nazifa TH, Kristanti RA, Ike M, et al. Occurrence and distribution of estrogenic chemicals in river waters of Malaysia. Toxicol Environ Health Sci. 2020;12:65–74. doi: 10.1007/s13530-020-00036-8. [DOI] [Google Scholar]
- Noordin N, Sharip Z, Majizat A, Ahmad B. Adopting an integrated catchment-based management approach for Putrajaya Lake and Wetlands. Int J Water. 2016;10:343. doi: 10.1504/ijw.2016.10000411. [DOI] [Google Scholar]
- Nurul-Ruhayu M-R, An YJ, Khairun Y. Detection of river pollution using water quality index: a case study of tropical rivers in Penang Island, Malaysia. OALib. 2015;02:1–8. doi: 10.4236/oalib.1101209. [DOI] [Google Scholar]
- Othman F, Alaaeldin ME, Seyam M, Ahmed AN, Teo FY, Ming Fai C, Afan HA, Sherif M, Sefelnasr A, El-Shafie A. Efficient river water quality index prediction considering minimal number of inputs variables. Eng Appl of Comput Fluid Mech. 2020;14(1):751–763. [Google Scholar]
- Rahgoshay M, Feiznia S, Arian M, Hashemi SAA. Modeling daily suspended sediment load using improved support vector machine model and genetic algorithm. Environ Sci Pollut Res. 2018;25:35693–35706. doi: 10.1007/s11356-018-3533-6. [DOI] [PubMed] [Google Scholar]
- Razali A, Syed Ismail SN, Awang S, et al. The impact of seasonal change on river water quality and dissolved metals in mountainous agricultural areas and risk to human health. Environ Forensics. 2020;21:195–211. doi: 10.1080/15275922.2020.1728434. [DOI] [Google Scholar]
- Rezaie-Balf M, Attar NF, Mohammadzadeh A, et al. Physicochemical parameters data assimilation for efficient improvement of water quality index prediction: comparative assessment of a noise suppression hybridization approach. J Clean Prod. 2020;271:122576. doi: 10.1016/j.jclepro.2020.122576. [DOI] [Google Scholar]
- Saadat S, Rawtani D, Hussain CM. Environmental perspective of COVID-19. Sci Total Environ. 2020;728:138870. doi: 10.1016/j.scitotenv.2020.138870. [DOI] [PMC free article] [PubMed] [Google Scholar]
- Said S, Hussain A. Pollution mapping of Yamuna River segment passing through Delhi using high-resolution GeoEye-2 imagery. Appl Water Sci. 2019;9:3. doi: 10.1007/s13201-019-0923-y. [DOI] [Google Scholar]
- Sharip Z, Saman JM, Noordin N, et al. Assessing the spatial water quality dynamics in Putrajaya Lake: a modelling approach. Model Earth Syst Environ. 2016 doi: 10.1007/s40808-016-0104-z. [DOI] [Google Scholar]
- Sharma R, Singh NS, Singh DK. Impact of heavy metal contamination and seasonal variations on enzyme’s activity of Yamuna river soil in Delhi and NCR. Appl Water Sci. 2020 doi: 10.1007/s13201-020-1166-7. [DOI] [Google Scholar]
- Sinshaw TA, Surbeck CQ, Yasarer H, Najjar Y. Artificial neural network for prediction of total nitrogen and phosphorus in US Lakes. J Environ Eng (United States) 2019;145:1–11. doi: 10.1061/(ASCE)EE.1943-7870.0001528. [DOI] [Google Scholar]
- Teo FY, Chun Kiat C, Ab Ghani A, Zakaria NA (2017) River sand mining capacity in Malaysia. In: Proceedings of 37th IAHR WORLD Congress
- VishnuRadhan R, Zainudin Z, Sreekanth GB, et al. Temporal water quality response in an urban river: a case study in peninsular Malaysia. Appl Water Sci. 2015;7:923–933. doi: 10.1007/s13201-015-0303-1. [DOI] [Google Scholar]
- Xu Z, Xu J, Yin H, et al. Urban river pollution control in developing countries. Nat Sustain. 2019;2:158–160. doi: 10.1038/s41893-019-0249-7. [DOI] [Google Scholar]
- Yahya ASA, Ahmed AN, Othman FB, et al. Water quality prediction model based support vector machine model for ungauged river catchment under dual scenarios. Water (Switzerland) 2019 doi: 10.3390/w11061231. [DOI] [Google Scholar]
- Yunus AP, Masago Y, Hijioka Y. COVID-19 and surface water quality: Improved lake water quality during the lockdown. Sci Total Environ. 2020 doi: 10.1016/j.scitotenv.2020.139012. [DOI] [PMC free article] [PubMed] [Google Scholar]
Associated Data
This section collects any data citations, data availability statements, or supplementary materials included in this article.
Data Availability Statement
Data subject to third party restrictions.


