Abstract
Metabolic reprogramming of non‐cancer cells residing in a tumor microenvironment, as a result of the adaptations to cancer‐derived metabolic and non‐metabolic factors, is an emerging aspect of cancer–host interaction. We show that in normal and cancer‐associated fibroblasts, breast cancer‐secreted extracellular vesicles suppress mTOR signaling upon amino acid stimulation to globally reduce mRNA translation. This is through delivery of cancer‐derived miR‐105 and miR‐204, which target RAGC, a component of Rag GTPases that regulate mTORC1 signaling. Following amino acid starvation and subsequent re‐feeding, 13C‐arginine labeling of de novo synthesized proteins shows selective translation of proteins that cluster to specific cellular functional pathways. The repertoire of these newly synthesized proteins is altered in fibroblasts treated with cancer‐derived extracellular vesicles, in addition to the overall suppressed protein synthesis. In human breast tumors, RAGC protein levels are inversely correlated with miR‐105 in the stroma. Our results suggest that through educating fibroblasts to reduce and re‐prioritize mRNA translation, cancer cells rewire the metabolic fluxes of amino acid pool and dynamically regulate stroma‐produced proteins during periodic nutrient fluctuations.
Keywords: breast cancer, extracellular vesicles, microRNA, mRNA translation, mTORC1
Subject Categories: Cancer, Metabolism, RNA Biology
Cancer‐secreted extracellular vesicles suppress amino acid‐induced mTORC1 signaling in fibroblasts. This leads to globally suppressed mRNA translation and re‐prioritized protein synthesis upon amino acid stimulation.

Introduction
Cancer‐directed metabolic reprogramming of non‐cancer niche cells within the tumor microenvironment and the metabolic interaction among various types of tumor‐residing cells are emerging hallmarks of cancer metabolism (Pavlova & Thompson, 2016). In addition to the passive responses to cancer’s exploitation of nutrients and excretion of metabolic wastes, metabolically active non‐cancer cells in the primary and metastatic microenvironments, such as stromal fibroblasts and bone marrow adipocytes, also contribute to the shaping of tumor metabolism by providing nutrients to cancer cells and modulating their metabolic pattern (Chiavarina et al, 2012; Diedrich et al, 2016; Zhao et al, 2016). Recent studies have revealed a role of extracellular vesicles (EVs) in mediating the metabolic interaction between cancer and niche cells through the encapsulation and intercellular transfer of metabolites and metabolism‐regulating messengers including miRNAs (Fong et al, 2015; Zhao et al, 2016; Yan et al, 2018). However, the dynamic and diverse modes of interplay between different cell populations under the ever‐changing metabolic conditions in a tumor microenvironment remain largely unknown.
We have recently shown that cancer‐secreted, EV‐encapsulated miRNAs metabolically reprogram various non‐cancer niche cells to support primary and metastatic tumor growth. Breast cancer‐secreted miR‐122 suppresses glucose uptake in brain and lung cells to bias the nutrient competition toward cancer cells during early metastasis (Fong et al, 2015). miR‐105 secreted by breast cancer cells induces a MYC‐dependent metabolic program in stromal fibroblasts. As a result, the reprogrammed fibroblasts enhance glycolysis and glutaminolysis to fuel adjacent cancer cells when nutrients are sufficient, and detoxify metabolic wastes (lactic acid and ammonium) by converting them into energy‐rich metabolites when nutrients are deprived whereas metabolic byproducts are accumulated (Yan et al, 2018). These previous studies provide new insights into the sharing and exchange of nutrients and metabolites between cancer and niche cells. Rather than glucose and glutamine, the two major nutrients consumed by proliferating mammalian cells, the majority of carbon mass in cells has been shown to be derived from other amino acids (AAs) consumed at much lower rates (Hosios et al, 2016). In the current study, we set out to determine how cancer‐secreted EVs influence the biosynthetic fate of AAs in fibroblasts.
The mechanistic target of rapamycin complex 1 (mTORC1) is a protein kinase that coordinates cellular and organismal growth in response to nutrient availability. mTORC1 is modulated by a variety of environmental signals, including AA availability, oxygen and energy levels, and growth factors, through the Rheb and Rag GTPases residing on the lysosomal surface (Saxton & Sabatini, 2017). In contrast to Rheb, which is activated by growth factors and acts as an activator of mTORC1 while the latter is on the lysosomal surface, the Rag GTPases regulate mTORC1 translocation to the lysosomal surface in response to the levels of nutrients such as AAs. The Rag GTPases are heterodimers formed by a RagA or RagB subunit binding to either RagC or RagD subunit. AA stimulation induces the active conformation containing GTP‐loaded RagA/B and GDP‐loaded RagC/D, promoting mTORC1 translocation to facilitate its activation by RheB on the lysosomal surface (Sancak et al, 2008; Efeyan et al, 2012). Thus, the Rag GTPases and factors modulating their nucleotide loading state and localization, as well as the upstream AA sensors, play critical roles in linking AA sensing to mTORC1‐controlled anabolic processes such as mRNA translation. Regulation of these genes in niche cells by cancer‐derived factors, such as EVs, would alter the AA sensing of these non‐cancer cells, regulating their growth and function to potentially influence tumor growth.
Results
Breast cancer‐secreted EVs suppress AA‐induced mTORC1 signaling and protein synthesis in fibroblasts
We first treated patient‐derived cancer‐associated fibroblasts (CAF) isolated from a primary breast tumor (Tsuyada et al, 2012) and WI‐38 normal fibroblasts with EVs from MDA‐MB‐231 breast cancer cells and MCF10A non‐cancer mammary epithelial cells. The effect of EVs on modulating AA‐stimulated mTORC1 signaling was tested by adding AAs to starved fibroblasts and measuring the time course of p70S6K phosphorylation indicative of mTORC1 activation. Upon re‐feeding with a three‐AA mixture of leucine, arginine, and lysine or a cocktail of essential AAs, both types of fibroblasts pretreated with MDA‐MB‐231‐derived EVs exhibited a significant suppression of p70S6K phosphorylation compared with those treated with EVs from MCF10A cells or with PBS (Fig 1A). To determine whether this effect of cancer EVs on suppressing mTORC1 activation was sufficient to influence protein synthesis, we used the surface sensing of translation (SUnSET) technique (Schmidt et al, 2009), which takes advantage of puromycin acting as a mimetic for tyrosine during mRNA translation. Compared with MCF10A EV and PBS treatments, cancer EVs reduced incorporation of puromycin into newly synthesized proteins after AA re‐feeding, which was consistently observed in CAF and normal human mammary fibroblasts as well as in WI‐38 human lung fibroblasts and NIH3T3 mouse embryonic fibroblasts (Fig 1B). Of note, cancer EVs did not significantly affect global protein synthesis in cells that were continuously cultured under AA repletion (Fig 1C), indicating that the EVs target the translatomic response of recipient cells to the dynamic changes of AA levels in the environment, rather than the basic components of translational machinery. EV uptake by fibroblasts was confirmed by treating cultured fibroblasts with DiI‐labeled EVs (Fig EV1A), and by injecting DiI‐labeled EVs into tumors formed from a mixture of MDA‐MB‐231 cells and GFP‐labeled NIH3T3 cells (Fig EV1B). The expression of CAF markers α‐smooth muscle actin (SMA) and vimentin were not significantly altered by EVs after 48 h of treatment (Fig EV1C).
Figure 1. Cancer‐secreted EVs suppress AA‐induced mTORC1 signaling and protein synthesis in fibroblasts.
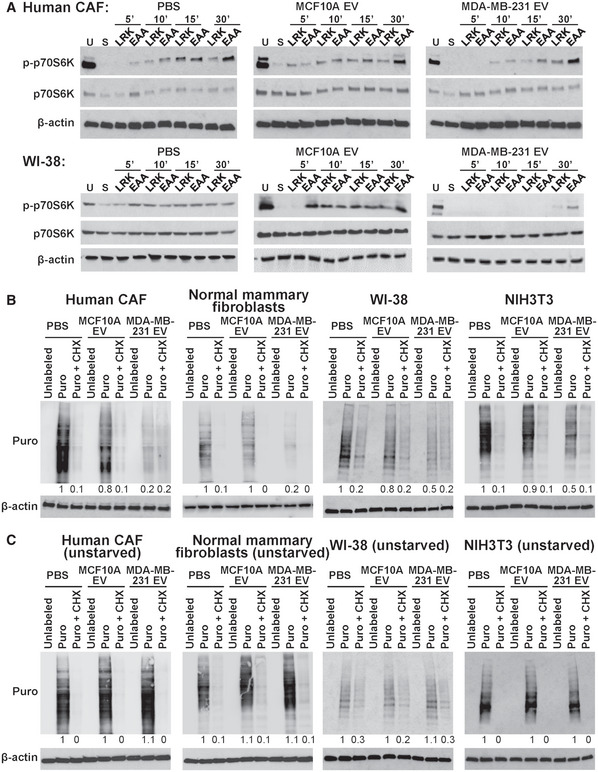
- CAF and WI‐38 cells pretreated with EVs from MDA‐MB‐231 or MCF10A cells, or PBS for 48 h were unstarved (U) or starved (S) for 2 h in EBSS prior to addition of a mixture of leucine, arginine, and lysine (LRK) or a cocktail of essential AAs (EAA). Cells were analyzed by Western blot analysis in a time course as indicated.
- Western blot analysis of puromycin (Puro)‐labeled fibroblasts (CAF, normal human mammary fibroblasts, WI‐38, and NIH3T3) after 2‐h starvation and EAA add‐back in the presence or absence of cycloheximide (CHX).
- Western blot analysis of Puro‐labeled fibroblasts cultured in growth medium.
Source data are available online for this figure.
Figure EV1. EV uptake by fibroblasts and characterization by nanoparticle tracking analysis, Western blots, and RT–qPCR.
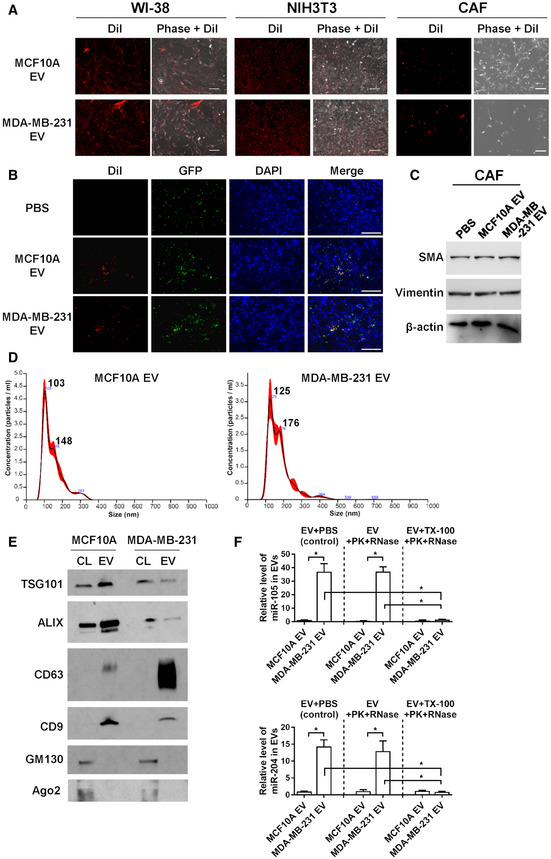
- WI‐38, NIH3T3, and CAF were incubated with DiI‐labeled EVs (red) for 24 h before fluorescent and phase contrast images were captured. Bar = 100 μm.
- Female NSG mice received mammary fat pad injection of MDA‐MB‐231 cells mixed with GFP‐labeled NIH3T3 cells. After 5 weeks, DiI‐labeled EVs or PBS were injected into the mammary tumor, which was collected after 24 h and sectioned for fluorescent microscopy. DAPI (4′,6‐diamidino‐2‐phenylindole) indicates nuclear stain. Bar = 100 μm.
- Western blot analysis of CAF treated with PBS or EVs from indicated cells for 48 h.
- EVs pelleted at 110,000 × g were analyzed by nanoparticle tracking analysis. The black line indicates mean, whereas the red shaded area indicates standard error of the mean (SEM) (n = 3 biological replicates for each type of EVs).
- Western blot analysis of cell lysates (CL) and EVs for known EV markers (TSG101, ALIX, CD63, and CD9), a Golgi marker (GM130), and a marker for non‐vesicular particles (Ago2).
- Levels of miR‐105 and miR‐204 in EVs treated with Proteinase K (PK, 10 μg/ml) followed by RNase If (RNase, 40 U) or with PBS (as control) in the presence or absence of 1% Triton X‐100 (TX‐100). RT–qPCR data were normalized to an ath‐miR159a spike‐in control added after all treatments (n = 3 biological replicates for each group). Data are presented as mean ± SD. *P < 0.001 (Student’s t‐test).
Source data are available online for this figure.
We further tracked AA‐induced mTORC1 activation using a live‐cell FRET reporter for mTORC1 activity (TORCAR) (Zhou et al, 2015), which contains a Cyan fluorophore (CFP) linked to 4EBP1 followed by a yellow fluorophore (YFP). Phosphorylation of 4EBP1 by mTORC1 leads to a decrease in energy transfer efficiency from CFP to YFP, which provides a dynamic readout of mTORC1 activity in living cells (Fig 2A). Upon AA stimulation, an increase in cyan over yellow emission ratio was observed in control cells indicating an increase in mTORC1 activity. Suppression of the AA‐induced TORCAR responses was observed in fibroblasts pretreated with cancer EVs but not MCF10A EVs (Fig 2B).
Figure 2. Cancer‐derived EVs suppress AA‐induced responses of an mTORC1 activity reporter.
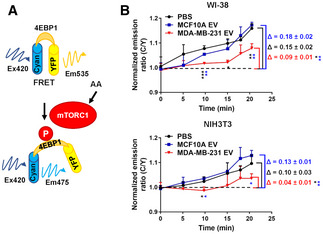
- Schematic of the FRET reporter for mTORC1 activity (TORCAR).
- TORCAR FRET reporter assay in WI‐38 or NIH3T3 cells after 2‐h starvation and EAA add‐back at time 0 (n = 3 biological replicates for each group). Data are presented as mean ± SD. *P < 0.05, **P < 0.01, ***P < 0.001 (one‐way ANOVA).
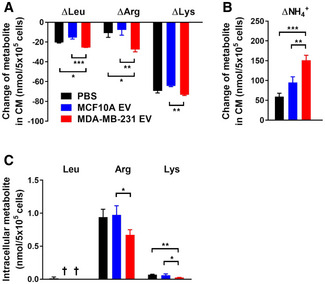
To determine whether the suppressed mTORC1 response to AA stimulation could be possibly caused by reduced cellular uptake of AAs, we measured the levels of leucine, arginine, and lysine in the conditioned medium of EV‐pretreated fibroblasts at 30 min after re‐feeding of the three AAs. Notably, we detected an increased but not decreased consumption of leucine and arginine in fibroblasts pretreated with cancer EVs (Fig 3A). This was accompanied by an increased level of ammonium released into the conditioned medium (Fig 3B). The intracellular pools of leucine and arginine in MDA‐MB‐231 EV‐pretreated fibroblasts, when compared to PBS treatment, did not change significantly, whereas the intracellular level of lysine showed a decrease (Fig 3C). Collectively, these results suggest that cancer EVs suppress AA‐induced mTORC1 signaling and protein synthesis likely through regulating components of the AA sensing and mTORC1 activation pathway, but not by limiting AA uptake.
Figure 3. Effects of cancer‐derived EVs on AA consumption by fibroblasts.
-
A, BDecreases of leucine, arginine, and lysine (A) as well as production of ammonium (B) in the conditioned medium (CM) of NIH3T3 cells at 30 min after the LRK mixture was added to starved cells that were pretreated with EVs or PBS (n = 3 biological replicates for each group).
-
CIntracellular levels of leucine, arginine, and lysine in NIH3T3 cells collected 30 min after the LRK mixture was added to starved cells (n = 3 biological replicates for each group).
Data information: In (A–C), data are presented as mean ± SD. *P < 0.05, **P < 0.01, ***P < 0.001 (one‐way ANOVA). † not detected.
Cancer‐derived EVs suppress protein synthesis through downregulating RAGC
To investigate the mechanism through which cancer EVs suppress AA‐induced protein synthesis, components of mTORC1/p70S6K signaling were analyzed after EV treatment, with only RAGC consistently showing reduction by MDA‐MB‐231 EVs in both WI‐38 and NIH3T3 fibroblast models (Fig 4A). To further demonstrate that downregulation of RAGC was sufficient to reduce protein synthesis, siRNA against RRAGC or RRAGD was used in SUnSET puromycin labeling, showing that knockdown of RagC, but not RagD, suppressed puromycin incorporation into newly synthesized proteins (Fig 4B and C). Ectopic expression of a RagC cDNA construct lacking 3′UTR abolished the effect of cancer EVs on puromycin incorporation (Fig 4D). Lastly, treatment of CAF with EVs from multiple breast cancer cell lines, including MDA‐MB‐231, SK‐BR‐3, MCF7, and patient‐derived cancer cells (PDX), but not MCF10A EVs, consistently resulted in downregulation of RagC and suppression of puromycin‐labeled protein synthesis (Fig 4E). These results demonstrate that downregulation of RagC is sufficient to inhibit AA‐stimulated protein synthesis and indeed mediates the effect of cancer‐derived EVs.
Figure 4. Cancer‐derived EVs suppress protein synthesis through downregulating RAGC.
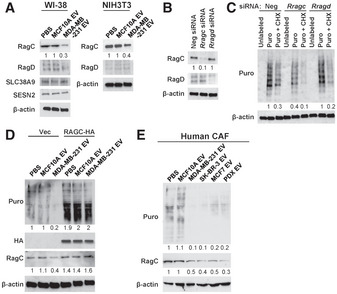
- Western blot analysis of WI‐38 and NIH3T3 cells treated with EVs or PBS for 48 h.
- Western blot analysis of NIH3T3 cells transfected with indicated siRNA for 48 h.
- Western blot analysis of NIH3T3 cells that had been transfected with indicated siRNA and labeled with Puro in the presence or absence of CHX.
- Western blot analysis of NIH3T3 cells that had been transfected with a pRK5‐RAGC‐HA‐GST expression plasmid or control vector and treated with EVs or PBS for 48 h, and then labeled with Puro.
- Western blot analysis of CAF that had been treated with PBS or EVs from indicated cells for 48 h.
Source data are available online for this figure.
miR‐105 and miR‐204 in breast cancer‐secreted EVs directly target RRAGC
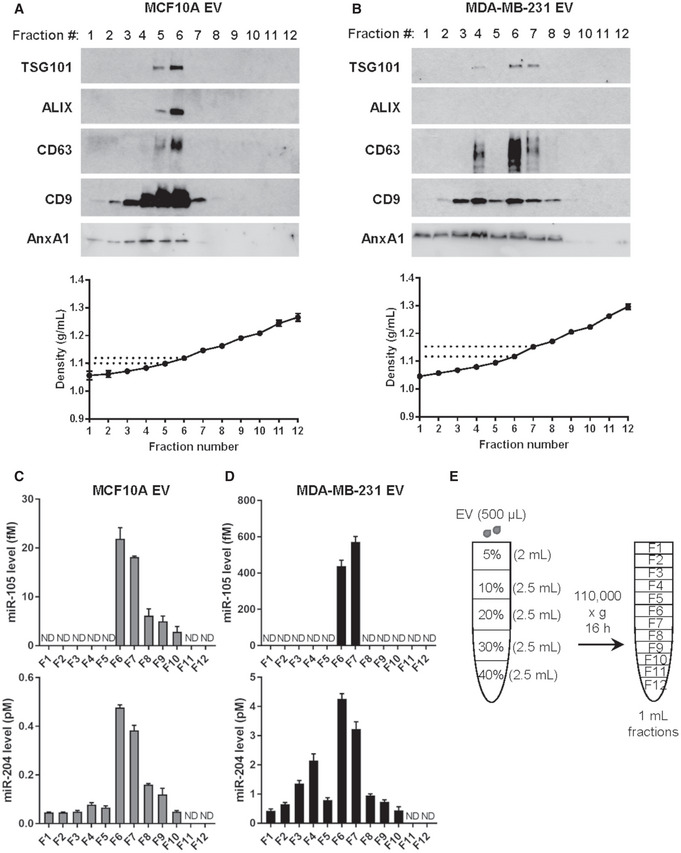
A search for miRNA‐binding sites in the 3′UTR of RRAGC by TargetScan and a previous profiling of miRNAs in EVs from MDA‐MB‐231 and MCF10A cells (Zhou et al, 2014) predicted three miRNAs that are highly expressed in MDA‐MB‐231 EVs may directly target RRAGC, i.e., miR‐105, miR‐122, and miR‐204. By using anti‐miRNAs to block the selected EV miRNAs, we found that miR‐105 and miR‐204, but not miR‐122, were required for cancer EVs to downregulate RagC and suppress protein synthesis (Fig 5A). The majority of EVs used in this study showed a diameter of 100–200 nm (Fig EV1D) and expressed protein markers of “small EVs” including exosomes (Gould & Raposo, 2013; Jeppesen et al, 2019) (Fig EV1E). Both miR‐105 and miR‐204 were resistant to RNase treatment in the absence of detergent, indicating their intra‐EV localization (Fig EV1F). Upon density gradient fractionation of the EVs, both miR‐105 and miR‐204 were found to be enriched in the fractions containing exosomes and with a density between ~ 1.10 and ~ 1.145 g/ml (Fig EV2). We next cloned the 3′UTR of human RRAGC into the psiCHECK reporter vector, and further point‐mutated all three predicted miR‐105 binding sites or the miR‐204‐binding site (Fig 5B) to generate mutant reporters. Co‐transfection of miR‐105 or miR‐204 mimic both effectively suppressed the wild‐type RRAGC 3’UTR reporter; the effect was abolished in mutant reporters with the corresponding miRNA‐binding sites mutated (Fig 5C). Treatment with MDA‐MB‐231 EVs, but not MCF10A EVs, significantly downregulated the wild‐type RRAGC 3’UTR reporter; both the miR‐105 and miR‐204 binding sites were required for this effect, as demonstrated by the loss of response in mutant reporters (Fig 5D). These results show that EV‐secreted miR‐105 and miR‐204 target RRAGC to suppress AA‐induced protein synthesis and that the two miRNAs may function in a synergistic manner, as previously shown with other groups of miRNAs (Chen et al, 2017; Bhaskaran et al, 2019), to potentially enhance the potency of gene regulation by EV‐enclosed miRNAs.
Figure 5. miR‐105 and miR‐204 in cancer‐secreted EVs target RRAGC .
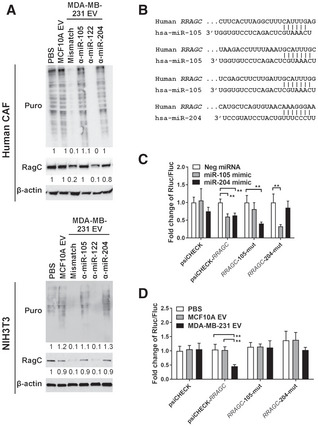
- Western blot analysis of CAF and NIH3T3 cells transfected with indicated anti‐miRNAs or control for 24 h and then treated with EVs or PBS for 48 h.
- Sequences of the predicted binding sites for miR‐105 and miR‐204 in the 3′UTR of human RRAGC.
- Dual luciferase assay of the psiCHECK reporters containing the 3’UTR of RRAGC that was wild‐type, with all three miR‐105 sites mutated, or with the miR‐204 site mutated. NIH3T3 cells were co‐transfected with the reporter and indicated miRNA mimic (n = 3 biological replicates for each group).
- Dual luciferase assay of the indicated psiCHECK reporters in NIH3T3 cells treated with EVs or PBS for 48 h (n = 3 biological replicates for each group).
Data information: In (C, D), data are presented as mean ± SD. **P < 0.01 (one‐way ANOVA).
Source data are available online for this figure.
Figure EV2. EV characterization by density gradient fractionation.
-
A, BWestern blot and density measurement of EV fractions collected from indicated cell lines to detect EV markers.
-
C, DRT–qPCR of EV fractions collected from indicated cell lines to detect miR‐105 and miR‐204 levels (n = 3 biological replicates for each fraction). Data are presented as mean ± SD. ND: not detected.
-
EA schematic representation of the density gradient separation procedure to further characterize the 110,000 × g pellets.
Source data are available online for this figure.
Breast cancer‐secreted EVs alter the spectrum of de novo protein synthesis in fibroblasts
To determine whether suppressed mTORC1 signaling selectively regulates synthesis of certain groups of proteins, we used 13C6‐arginine to label newly synthesized proteins for proteomic analysis as previously described (Ong et al, 2002). NIH3T3 cells pretreated with EVs from MDA‐MB‐231 or MCF10A cells were starved for 2 h before 13C6‐arginine and other AAs (unlabeled) were supplied to enable protein synthesis. After 3 h, peptides carrying the “heavy” 13C isotope were characterized by mass spectrometry (Fig 6A). We identified a total of 185 proteins in cells treated with MCF10A EVs; among these, about half (89) were unique and not detected in cells treated with MDA‐MB‐231 EVs. In contrast, 37 13C‐labeled proteins were identified as unique to MDA‐MB‐231 EV treatment (Fig 6B, Dataset EV1). Using Ingenuity Pathway Analysis (IPA), we annotated the functions of those proteins whose synthesis was significant in MCF10A‐EV‐treated cells but was suppressed by > 2‐fold in cancer‐EV‐treated cells during the 3‐h tracing window (108 proteins). These proteins were associated with functions such as “Expression of RNA”, “Metabolism of DNA”, and “Differentiation of mesenchymal cells” (Fig 6C). Of note, several proteins in the extracellular matrix (ECM), including thrombospondin 2 (THBS2), cystatin C (CST3), collagen type III alpha 1 chain (COL3A1), fibronectin 1 (FN1), extracellular matrix protein 1 (ECM1), and gelsolin (GSN), as well as several proteins involved in cytoskeletal organization (e.g., filamin A/FLNA, cortactin/CTTN, actinin alpha 4/ACTN4, and CDC42 effector protein 2/CDC42EP2), were found in this group and may regulate cell adhesion, movement, and shape control. Synthesis of platelet‐derived growth factor receptor alpha (PDGFRA) was exclusively detected under MCF10A EV treatment, suggesting that fibroblasts treated with cancer EVs may have suppressed response to PDGF‐stimulated signaling during AA re‐feeding. In contrast, proteins synthesized by > 2‐fold in MDA‐MB‐231‐EV‐treated cells (51 proteins) were associated with functions including “Cell viability of tumor cells”, “Communication of cells”, “Signal transduction”, “Breast cancer”, and “Formation of vesicles”, etc. (Fig 6C). Proteins related to formation of autophagosomes including sequestosome 1 (SQSTM1/p62), BCL2‐associated athanogene 3 (BAG3), and clathrin heavy chain (CLTC) are significantly synthesized in cancer‐EV‐treated fibroblasts. Also synthesized in these cells include enzymes associated with lipid metabolism, such as hydroxyacyl‐CoA dehydrogenase trifunctional multienzyme complex subunit alpha (HADHA), fatty acid synthase (FASN), and ATP citrate lyase (ACLY). Two proteins in the extracellular space are significantly synthesized under this condition, namely complement C3 (C3) and secreted protein acidic and cysteine rich (SPARC). It is possible that under crippled protein synthesis following cancer EV treatment, the cells increase autophagy and rewire lipid metabolism to maintain functionality, and meanwhile tune their interaction with neighboring cells partially through altering ECM composition. How the synthesis of these proteins is induced under the global suppression of translation is unclear and may involve other mechanisms regulated by cancer EVs leading to selective induction of individual gene expression.
Figure 6. Cancer‐secreted EVs alter the spectrum of de novo protein synthesis in fibroblasts.
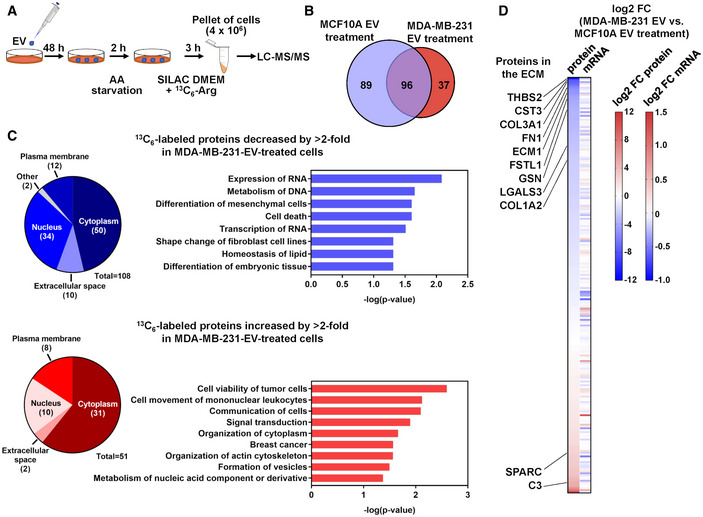
- Schematic of 13C6‐Arg labeling strategy to profile de novo protein synthesis in EV‐treated NIH3T3 cells.
- A Venn diagram showing the numbers of 13C6‐labeled proteins identified in NIH3T3 cells pretreated with MCF10A or MDA‐MB‐231 EVs.
- Detected 13C6‐labeled proteins were analyzed by IPA for prediction of functions associated with proteins decreased or increased by > 2‐fold in MDA‐MB‐231‐EV‐treated cells. Pie charts show the numbers of proteins categorized by subcellular localization.
- A heatmap showing the comparison of log2 fold change (FC) of the abundance of each identified 13C6‐labeled protein and its corresponding mRNA level determined by RNA‐seq.
Transcriptomic profiling by RNA‐seq was carried out in parallel to the proteomic profiling in EV‐treated NIH3T3 cells to further determine whether the observed differences in protein synthesis possibly reflect corresponding changes at the RNA level. For most proteins that were differentially synthesized in MCF10A‐ or MDA‐MB‐231‐EV‐treated cells during the tracing window, no associated differences were detected at the RNA level, suggesting regulations at the translational level (Fig 6D, Dataset EV1).
RAGC levels in tumor stroma are inversely correlated with miR‐105
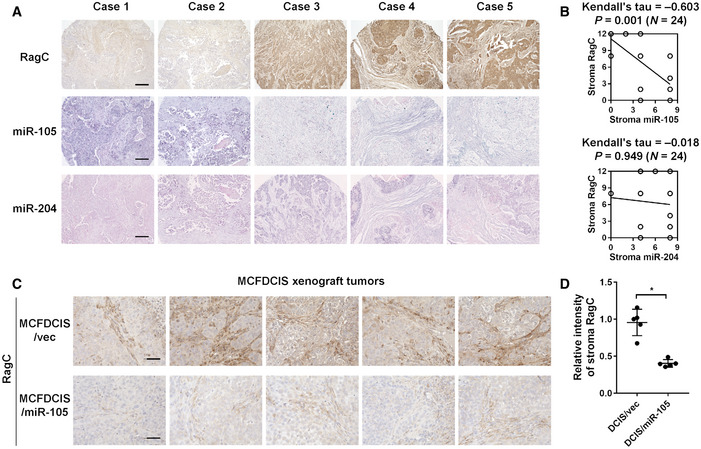
We further examined 24 primary human breast tumors to seek evidence for the regulation of RagC in stromal fibroblasts by miR‐105 and/or miR‐204. Levels of RagC proteins were determined by immunohistochemistry (IHC), whereas levels of the miRNAs were determined by in situ hybridization (ISH). An inverse correlation was observed between RagC and miR‐105, but not miR‐204, in tumor stroma (Fig 7A and B). In xenograft tumors formed by the MCF10A‐derived, tumorigenic MCFDCIS cells that were engineered to overexpress miR‐105, significantly decreased stromal expression of RagC was detected compared to tumors without miR‐105 overexpression (Fig 7C and D). These results suggest that, at least for the primary and xenograft tumors examined in this study, miR‐105 may serve as a more potent regulator of RagC.
Figure 7. RAGC levels in tumor stroma are inversely correlated with miR‐105.
-
A, BA breast cancer tissue array was analyzed for correlations among RagC, miR‐105, and miR‐204 in tumor stroma by IHC/ISH‐determined scores. Representative IHC and ISH images (A) and correlations determined by Kendall’s tau correlation tests (N = 24 independent tumors; Kendall’s tau and two‐sided P value as indicated) (B) are shown. Bar = 200 μm.
-
C, DXenograft mammary tumors formed from MCFDCIS cells overexpressing miR‐105 or empty vector were collected from NSG mice for RagC IHC (n = 5 tumors for each group). The relative intensity of RagC stain in tumor stroma was quantified by ImageJ. Bar = 50 μm. In (D), data are presented as mean ± SD. *P < 0.05 (Student’s t‐test).
Discussion
It has been recognized that the cancer cells’ high demand for nutrients can induce starvation in normal cells (Chang et al, 2015). To add some complexity, cancer‐secreted EVs may suppress glucose uptake in certain types of normal cells (Fong et al, 2015). The combination of these effects may result in periods of temporary and recurring nutrient limitations in normal cells co‐residing a cancer niche. It is during this time window when precise sensing of the fluctuating extracellular nutrient levels is particularly important to the control of niche cell behaviors. Our study demonstrates that cancer‐secreted miR‐105 and miR‐204 de‐sensitize fibroblasts’ response to AA stimulation by globally suppressing protein synthesis, which would relieve the requirements for AAs and energy at the expense of compromised cell proliferation. This is achieved by targeting RRAGC that is critical for AA sensing by mTORC1 pathway. It is noted that MDA‐MB‐231 EVs were able to reduce both RRAGC and RRAGD expression in human fibroblasts (Fig 4A). However, as RRAGC is more abundant in fibroblasts and that RRAGD knockdown was not sufficient to suppress protein synthesis (Fig 4A–C), we chose to focus on RRAGC. Compromised cell growth due to suppressed mTORC1 signaling and protein synthesis may reroute fibroblasts toward other functional commitments. Indeed, quiescent fibroblasts have been shown to undergo high metabolic activity (Lemons et al, 2010). Upon AA re‐feeding, fibroblasts reprogrammed by cancer EVs exhibit increased, but not decreased AA uptake and ammonium production (Fig 3A and B). This may reflect increased catabolism of AAs to fuel cells as a carbon source, although glucose is constantly supplied at a high level in our experimental system. We have previously reported that cancer‐EV‐educated fibroblasts enhance glutaminolysis and glycolysis as a result of MYC activation to produce and secrete energy‐rich metabolites such as acetate, lactate, and glutamate, which can then be used to support cancer cell growth (Yan et al, 2018). Other studies have shown that cancer‐associated fibroblasts can support cancer growth by providing ketone bodies, fatty acids, AAs, and citric acid cycle intermediates (Fiaschi et al, 2012; Martinez‐Outschoorn et al, 2012; Martinez‐Outschoorn et al, 2014; Zhao et al, 2016). Similarly, cancer‐reprogrammed fibroblasts may generally enhance uptake of essential AAs. As a result of globally suppressed protein synthesis shown herein as well as other mechanisms leading to increased AA catabolism, fibroblasts could use the intracellular AAs toward energy production (and possibly energy transfer to cancer cells via secretion of metabolites) and/or specialized biosynthesis rather than benefiting their own growth. The potential mechanisms of increased AA uptake and catabolism include induction of AA transporters with a broad substrate specificity, such as SLC1A5, SLC7A8, SLC7A11, and SLC7A5, and enzymes catalyzing AA catabolism such as arginase 2 (ARG2), nitric oxide synthase 2 (NOS2), branched chain amino acid transaminase 2 (BCAT2), all of which are induced in fibroblasts by cancer‐secreted miR‐105 (Yan et al, 2018).
We show that miR‐105, but not miR‐204, is negatively associated with stroma RagC in an array of human breast tumors and that stroma RagC is downregulated in MCFDCIS xenograft tumors when miR‐105 is overexpressed in cancer cells (Fig 7). Our previous and current studies thus together indicate a multifaceted function of cancer‐secreted miR‐105 in modifying the tumor microenvironment to promote tumor growth and metastasis, including metabolic reprogramming of CAF (Yan et al, 2018), an altered protein synthesis response of CAF to the intermittent AA replenishments in the tumor microenvironment (current study), and modulation of the tumor vasculature (Zhou et al, 2014). All these mechanisms may contribute to the miR‐105‐induced tumor growth and metastasis as well as the tumor‐suppressive effect of anti‐miR‐105 treatment reported in our previous studies (Zhou et al, 2014; Yan et al, 2018).
ECM biosynthesis is a key function of fibroblasts and has been previously linked to cell response to nutrient availability. Upon serum starvation or contact inhibition, fibroblasts that are induced into quiescence enhance ECM expression at RNA and protein levels through downregulation of miR‐29, which targets genes encoding collagen I, III, and VI; overexpression of miR‐29 in turn promotes cell cycle re‐entry from a quiescent state (Suh et al, 2012). The reported increase of ECM biosynthesis in mitogen‐starved cells, in comparison with proliferating cells, is consistent with our SILAC proteomic data showing that several ECM proteins including collagen I and III, fibronectin 1, thrombospondin 2, and cystatin C are rapidly synthesized in high abundances upon AA re‐feeding to starved fibroblasts (Dataset EV1). This is critical to the survival of neighboring epithelial cells in a shared niche, which may directly uptake ECM as a nutrient supply during starvation. Normal mammary epithelial cells can endocytose laminin together with its membrane receptor β4‐integrin; internalized laminin localizes to lysosomes and increases intracellular AA levels to stimulating mTORC1 signaling, promoting survival, and maintaining epithelial cell growth under starvation (Muranen et al, 2017). Ras‐transformed cancer cells take up extracellular proteins especially albumin via micropinocytosis for proteolytic degradation to provide AAs (Commisso et al, 2013; Kamphorst et al, 2015; Palm et al, 2015). Although AAs released from endocytosed extracellular proteins activate mTORC1, under AA starvation mTORC1 activation suppresses cell proliferation by limiting lysosomal catabolism of internalized proteins, whereas mTORC1 inhibition promotes growth of poorly vascularized tumors (Palm et al, 2015). This demonstrates the ability of mTORC1 to discriminate different source of AAs for a precise sensation of environmental nutrients. In cancer‐reprogrammed fibroblasts with suppressed mTORC1 signaling, we detected increased and prompt synthesis of certain proteins, in contrast to the global suppression of translation. The lack of their significant induction at the RNA level suggests unknown mechanisms acting at the translational level to specifically induce individual protein synthesis. These proteins are related to autophagy, lipid metabolism, survival, and intercellular communication (Fig 6C, Dataset EV1), which may contribute to survival of fibroblasts and their ability to support growth of neighboring cancer cells. Among these, HADHA catalyzes mitochondrial β‐oxidation of long chain fatty acids to promote their use as an alternative energy source (Carpenter et al, 1992), TXNDC17 (thioredoxin domain containing 17) may regulate cellular redox, whereas complement C3 and its degradation products may regulate recruitments of innate and adaptive immune cells (Afshar‐Kharghan, 2017). Increased autophagy, as suggested by several proteins specifically synthesized in cancer‐EV‐treated fibroblasts such as SQSTM1/p62, as well as increased free fatty acid catabolism, could be direct effects of mTORC1 inhibition (Laplante & Sabatini, 2009; Kim & Guan, 2015) and may support cancer cell growth by providing degradation products. Therefore, while the PI3K/mTOR pathway is frequently activated in cancer cells and considered a promising therapeutic target for pharmacological inhibition (Engelman et al, 2006; Efeyan et al, 2012), inhibition of mTOR pathway may induce survival not only in cancer cells (Palm et al, 2015) but also in stromal fibroblasts to potentiate complex intercellular crosstalk within the tumor milieu. Future studies may further elucidate the different outcome of various AA utilization modes, e.g., synthesis of ECM versus other specialized proteins as well as enhanced AA catabolism, in stromal fibroblasts under different nutrient availability for their influence on cancer cell survival and growth.
Materials and Methods
Cell lines
WI‐38, NIH3T3, MDA‐MB‐231, MCF10A, SK‐BR‐3, and MCF7 cells were obtained from the American Type Culture Collection (Manassas, VA). MCF10DCIS.com (MCFDCIS) cells were purchased from Asterand (Detroit, MI). All cells were authenticated by using the short tandem repeat profiling method and tested to be free of mycoplasma contamination before and after the project. WI‐38 cells were cultured in minimal essential medium (Corning; Corning, NY) supplemented with 10% fetal bovine serum (FBS; Sigma‐Aldrich; St. Louis, MO). NIH3T3, MDA‐MB‐231, and MCF7 cells were cultured in Dulbecco's modified Eagle's medium (DMEM) supplemented with 10% FBS. MCF10A and MCFDCIS cells were cultured in DMEM/F‐12 1:1 mixture supplemented with 5% horse serum, 10 µg/ml insulin, 20 ng/ml epidermal growth factor (EGF), 500 ng/ml hydrocortisone, and 100 ng/ml cholera toxin. SK‐BR‐3 cells were cultured in McCoy's 5A (modified) medium (Thermo Fisher Scientific; Waltham, MA) supplemented with 10% FBS. Patient‐derived primary fibroblasts CAF265922 (denoted as CAF in this study) and cancer cells (PDX265922, denoted as PDX) were derived from a triple‐negative breast tumor as previously described (Tsuyada et al, 2012) and cultured in Iscove's modified Dulbecco's medium (Thermo Fisher Scientific) supplemented with 20% FBS. Primary normal human mammary fibroblasts were obtained from Zen‐Bio (Research Triangle Park, NC) and cultured in the recommended media. Cells were starved of amino acids with Earle's balanced salt solution (EBSS) supplemented with 3 g/l glucose for 2 h before adding back a cocktail containing all essential amino acids (EAA; Corning, Catalog number 25‐030‐CI) at 1 × final concentration or a mixture of l‐Leucine (final concentration 52.5 mg/l), l‐Arginine HCl (126.4 mg/l), and l‐Lysine HCl (72.5 mg/l) (LRK; Sigma‐Aldrich).
Plasmids and constructs
The pcDNA‐TORCAR plasmid was previously generated (Zhou et al, 2015). The human RRAGC 3′UTR fragment was generated by PCR using primers 5′‐GAAAGCGCTGACACACAATG and 5′‐AAATACATTTATTGATACCCATTTCA and cloned into the psiCHECK2 vector (Promega; Madison, WI). Mutations of the miRNA‐binding sites in RRAGC 3′UTR were generated using mutagenesis primers 5′‐GCTCAGTGTAACACGCGGAATTAAAAGTTTTC and its complementary reverse primer for the putative miR‐204 site, 5′‐CACTTAGGCTTTCAGCAGAGTAGACTCTAA and 5′‐AGCTTCTTGATTGCTGCTGGTTGACCACGAGT and their complementary reverse primers for the putative miR‐105 sites 1 and 3. The miR‐105 site 2 was mutated using primers 5′‐CATGCTTGCTAACTCGGAAGACACATAGTC and 5′‐CGCATTTAAAAGGTCTTAGTTGTGCAATGT with the assistance of Q5 high‐fidelity DNA polymerase (New England Biolabs; Ipswich, MA) following the manufacturer's protocol. The pRK5‐HA GST RagC wt plasmid was obtained from Addgene (Plasmid #19304) (Sancak et al, 2008). mirVana™ miRNA mimics and anti‐miRNA inhibitors were purchased from Thermo Fisher Scientific (Waltham, MA). FlexiTube GeneSolution siRNAs against Rragc (Catalog number SI01407847, SI01407854, SI01407861, and SI01407868) and Rragd (Catalog number SI01407875, SI01407896, SI04413430, and SI04451188) as well as AllStars Negative Control siRNA (Catalog number 1027280) were purchased from Qiagen (Hilden, Germany).
EV preparation
EVs were prepared as previously reported (Zhou et al, 2014; Fong et al, 2015; Yan et al, 2018). Conditioned medium (CM) was first collected after incubating cells in growth medium containing 10% EV‐depleted FBS (prepared by overnight ultracentrifugation of medium‐diluted FBS at 100,000 × g at 4ºC) for 48 h and pre‐cleared by centrifugation at 500 × g for 15 min and then at 10,000 × g for 20 min. EVs were isolated by ultracentrifugation at 110,000 × g for 70 min and washed in PBS using the same ultracentrifugation conditions. When indicated, DiI (1,1′‐dioctadecyl‐3,3,3′,3′‐tetramethylindocarbocyanine perchlorate; Sigma‐Aldrich) was added into the PBS at 1 µM and incubated for 20 min before the washing spin, followed by an additional wash to remove the excess dye. The pelleted EVs were resuspended in ~ 100 µl of PBS. For cell treatment, approximately 1 × 10⁸ EVs harvested from MDA‐MB‐231 or MCF10A cells were used to treat 1.25 × 10⁵ recipient cells seeded on 6‐well plates. For EV characterization, EVs were subjected to nanoparticle tracking analysis using a NanoSight NS300 (Malvern; Westborough, MA), or further fractionated by gradient separation following a modified protocol. Buoyant density gradient separation was performed as in Ji et al (2013) and Tauro et al (2012) using 40, 30, 20, 10, and 5% discontinuous OptiPrep (Sigma‐Aldrich) gradient diluted with NTE buffer (137 mM NaCl, 1 mM EDTA, and 10 mM Tris, pH 7.4) (Quek et al, 2017). Crude 110,000 × g pellets were resuspended in 500 µl of NTE buffer and placed on the top of the gradient column. Centrifugation was performed at 110,000 × g for 16 h at 4°C. Fractions were collected in 1 ml increments from the top (Fraction 1) down. Each fraction was analyzed by Western blot for EV protein markers and by RNA extraction using TRIzol LS (Thermo Fisher Scientific) to determine the abundance of miRNA effector by RT–qPCR using the Qiagen miScript system. To determine the topology of EV‐associated miRNA, EVs were treated with Proteinase K (10 μg/ml) followed by RNase If (40 U) in the presence or absence of 1% Triton X‐100 before RNA extraction, as previously described (Shurtleff et al, 2017).
Puromycin labeling for detection of de novo protein synthesis
The SUnSET technique is described in Schmidt et al (2009). Briefly, cells starved for 2 h were treated with 10 µM puromycin for 10 min, washed three times with PBS, and incubated in 1 × EAA diluted in glucose‐supplemented EBSS for 30 min. When indicated, cycloheximide (Sigma‐Aldrich) was added at 50 µM to inhibit protein synthesis prior to addition of puromycin.
Western blot analysis
Protein extracts were separated by SDS–PAGE using 4–15% precast protein gels (Bio‐Rad Laboratories; Hercules, CA). Western blot analyses were performed using the following antibodies: Phospho‐p70 S6 Kinase (Thr389) (Cell Signaling Technology; Danvers, MA; #9234; 1:1,000 dilution), p70 S6 Kinase (Cell Signaling Technology; #2708; 1:1,000 dilution), RagC (Cell Signaling Technology; #9480; 1:1,000 dilution), RagD (Abcam; Cambridge, United Kingdom; #ab187679; 1:10,000 dilution), SESN2 (GeneTex; Irvine, CA; #GTX116925; 1:2,000 dilution), SLC38A9 (Novus Biologicals; Centennial, CO; #NBP1‐69235; 1:1,000 dilution), Puromycin (EMD Millipore; Burlington, MA; #MABE343; 1:25,000 dilution), HA‐tag (Cell Signaling Technology; #2367; 1:1,000 dilution), β‐actin (Sigma‐Aldrich; #A1978; 1:6,000 dilution), CD63 (Santa Cruz Biotechnology; Dallas, TX; #sc‐5275; 1:500 dilution), CD9 (Cell Signaling Technology; #13403; 1:1,000 dilution), TSG101 (Thermo Fisher Scientific; #MA1‐23296; 1:1,000 dilution), Alix (Cell Signaling Technology; #2171; 1:1,000 dilution), GM130 (Cell Signaling Technology; #12480; 1:1,000 dilution), AnxA1 (Cell Signaling Technology; #3299; 1:1,000 dilution), Ago2 (Santa Cruz Biotechnology; #sc‐376696; 1:500 dilution), SMA (Sigma‐Aldrich; #A2547; 1:1,000 dilution), and Vimentin (Sigma‐Aldrich; #V2258; 1:1,000 dilution) (Zhou et al, 2015). For SLC38A9, proteins were deglycosylated using PNGase F (New England Biolabs) following manufacturer’s protocol prior to SDS–PAGE. Scanned images were quantitated using ImageJ (Fiji software) with normalization to the corresponding β‐actin blot.
TORCAR FRET reporter analysis
A total of 3 × 10³ cells transfected with pcDNA‐TORCAR (Zhou et al, 2015) and treated with EVs as indicated were seeded on Corning 96‐well black clear‐bottom microplates. On the next day, cells were starved for 2 h before stimulation with EAA. Fluorescence was read at Ex420/Em475 for CFP and Ex420/Em535 for YFP FRET using a Varioskan LUX microplate reader (Thermo Fisher Scientific).
Metabolite measurements
Cells were treated with EVs for 48 h and then starved for 2 h before the LRK mixture was added for 30 min. Levels of leucine, arginine, and lysine in the CM and in cell extracts were measured by nuclear magnetic resonance spectroscopy as in (Yan et al, 2018). Media collected from cell‐free plates after 30‐min incubation was used as the baseline control to calculate the consumption of each AA, which was further normalized to the cell number in each plate determined at the time of CM collection. Levels of ammonium in the CM were measured by an EnzyChrom™ ammonia/ammonium assay kit (BioAssay Systems; Hayward, CA).
Mass spectrometry for protein identification
NIH3T3 cells were seeded on 10‐cm dishes and treated with EVs for 48 h. Starved cells were labeled with 13C6‐Arginine (Thermo Fisher Scientific) diluted in SILAC DMEM (Sigma‐Aldrich) for 3 h. The cells were then washed 3 times in PBS and the pellet collected and resuspended in a buffer containing 50 mM Tris pH 8.0, 100 mM NaCl, and 1 mM EDTA. Protein samples were prepared with 0.1% RapiGest SF reagent (Waters Corp.), 1 mM TCEP (Tris(2‐carboxyethyl)phosphine), and 0.5 mg/ml of iodoacetamide followed by neutralization with TCEP. Trypsin‐digested peptides were analyzed by ultra‐high pressure liquid chromatography coupled with tandem mass spectroscopy using nano‐spray ionization. Peptides were eluted from the C18 column into the mass spectrometer using a linear gradient (5–80%) of acetonitrile. Mass spectrometer parameters are as follows: an MS1 survey scan using the orbitrap detector (mass range 400–1,500 m/z using quadrupole isolation, 120,000 resolution setting, spray voltage of 2,200 V, ion transfer tube temperature of 275°C, AGC target of 400,000, and maximum injection time of 50 ms) followed by data dependent scans; the fragment masses were analyzed in the ion trap mass analyzer. Data analysis was carried out using the Peaks Studio™ (Bioinformatics Solutions Inc.). For Ingenuity pathway analysis (content version: 42012434; build: ing_pandora; Qiagen), identified 13C‐labeled proteins were matched to their human counterparts (222 proteins in total; Dataset EV1) and uploaded to predict functions associated with those decreased or increased by > 2‐fold in MDA‐MB‐231‐EV‐treated cells compared with MCF10A‐EV‐treated cells.
RNA‐seq
RNA sequencing was performed by the City of Hope Integrative Genomics Core using RNA samples from NIH3T3 cells treated with MCF10A or MDA‐MB‐231 EVs for 48 h, starved for 2 h, and then replenished with EAA for 3 h. RNA was reverse‐transcribed into cDNA, followed by end repair, A‐tailing, and linker ligation. The ligated material was amplified by PCR and then analyzed on a HiSeq2500 (Illumina; San Diego, CA) for parallel sequencing. Sequences were aligned to human genome assembly hg19. Bioconductor package “edgeR” 3.4.2 was used to normalize the data and calculate P value and log2 fold change between different groups.
Xenograft tumors in mice
Animal experiments were approved by the institutional animal care and use committees at the University of California San Diego and the Beckman Research Institute of the City of Hope. The study is compliant with all relevant ethical regulations regarding animal research. Female NOD/SCID/IL2Rγ‐null (NSG) mice of 8 weeks old were purchased from the Jackson Laboratory (Bar Harbor, ME) and housed at a facility that maintains a 12:12 h light/dark cycle with Zeitgeber time 12 = lights off. Mice were randomized before tumor cell injection. Xenograft tumors were established by injecting 2 × 10⁵ MCFDCIS cells overexpressing miR‐105 or empty pBABE vector (Zhou et al, 2014) into the No. 4 mammary fat pad. Tumors were collected at week 6. For detection of EV uptake, a mixture of 1 × 10⁶ MDA‐MB‐231 cells and 1 × 10⁶ GFP‐labeled NIH3T3 cells were injected into the No. 4 mammary fat pad. At week 5, 2 μg of DiI‐labeled EVs were injected into the mammary tumor, which was collected after 24 h and sectioned for fluorescent microscopy as described (Fong et al, 2015; Yan et al, 2018).
IHC and ISH
Breast cancer tissue arrays were purchased from US Biomax (Cat #BR724; Rockville, MD). IHC and ISH were performed as previously described (Tsuyada et al, 2012; Zhou et al, 2014; Fong et al, 2015), using anti‐RAGC (Cell Signaling Technology; #5466; 1:4,000 dilution) and probes for miR‐105 and miR‐204 (Exiqon; Denmark; #38476‐15 and #619857‐360, respectively). Stained slides were scored according to intensity of staining (−: 0; +: 1; ++: 2; and +++: 3) and percentage of the cells of interest staining positive (0%: 0; 1–25%: 1; 26–50%: 2; 51–75%: 3; and 76–100%: 4). The intensity score was multiplied by the percentage score to obtain a final score, which was used in the statistical analyses.
Statistics
All experiments in cultured cells were repeated independently three times. All quantitative data are presented as mean ± standard deviation (SD) unless stated otherwise. Statistical tests were performed using GraphPad Prism 7.01 and SPSS 22. Two‐sided Student’s t‐tests were used for comparisons of the means of data between two groups. For multiple independent groups, one‐way ANOVA with post hoc Tukey tests were used. The correlations between IHC/ISH‐determined gene expression levels were evaluated by Kendall’s tau correlation tests. Values of P < 0.05 were considered significant. Sample size was generally chosen based on preliminary data indicating the variance within each group and the differences between groups. All samples were included for the analyses.
Author contributions
Performance and design of experiments and data analysis: MYF; Experiments and data analyses: WY, XZ, MC, LJ, JW, and XL; Mass spectrometry: MG; IPA analyses and RNA‐seq: XW; Experimental design and feedback: JZ; Conception of ideas and project: SEW; Manuscript writing: MYF and SEW.
Conflict of interest
The authors declare that they have no conflict of interest.
Supporting information
Expanded View Figures PDF
Dataset EV1
Source Data for Expanded View
Review Process File
Source Data for Figure 1
Source Data for Figure 4
Source Data for Figure 5
Acknowledgements
This work was supported by the United States Army Research and Material Command grant W81‐14‐1‐0029 (M.Y.F.), National Institutes of Health (NIH)/National Cancer Institute (NCI) grants R01CA218140 (S.E.W.), R01CA206911 (S.E.W.), and R35CA197622 (J.Z.). Proteomic profiling was performed at the Biomolecular and Proteomics Mass Spectrometry Facility at the University of California, San Diego. Research reported in this publication included work performed in the core facilities supported by the NIH/NCI under grant number P30CA23100 (UC San Diego Cancer Center) and in the City of Hope Integrative Genomics Core supported by NIH/NCI under grant number P30CA33572.
EMBO reports (2021) 22: e51239.
Data availability
The datasets produced in this study are available in the following databases:
RNA‐Seq data: Gene Expression Omnibus GSE140852 (https://www.ncbi.nlm.nih.gov/geo/query/acc.cgi?acc=GSE140852)
Mass spectrometry proteomics data: ProteomeXchange Consortium via the PRIDE (Perez‐Riverol et al, 2019) partner repository dataset identifier PXD022311 (http://www.ebi.ac.uk/pride/archive/projects/PXD022311)
References
- Afshar‐Kharghan V (2017) The role of the complement system in cancer. J Clin Invest 127: 780–789 [DOI] [PMC free article] [PubMed] [Google Scholar]
- Bhaskaran V, Nowicki MO, Idriss M, Jimenez MA, Lugli G, Hayes JL, Mahmoud AB, Zane RE, Passaro C, Ligon KL et al (2019) The functional synergism of microRNA clustering provides therapeutically relevant epigenetic interference in glioblastoma. Nat Commun 10: 442 [DOI] [PMC free article] [PubMed] [Google Scholar]
- Carpenter K, Pollitt RJ, Middleton B (1992) Human liver long‐chain 3‐hydroxyacyl‐coenzyme A dehydrogenase is a multifunctional membrane‐bound beta‐oxidation enzyme of mitochondria. Biochem Biophys Res Commun 183: 443–448 [DOI] [PubMed] [Google Scholar]
- Chang CH, Qiu J, O'Sullivan D, Buck MD, Noguchi T, Curtis JD, Chen Q, Gindin M, Gubin MM, van der Windt GJ et al (2015) Metabolic competition in the tumor microenvironment is a driver of cancer progression. Cell 162: 1229–1241 [DOI] [PMC free article] [PubMed] [Google Scholar]
- Chen X, Zhao W, Yuan Y, Bai Y, Sun Y, Zhu W, Du Z (2017) MicroRNAs tend to synergistically control expression of genes encoding extensively‐expressed proteins in humans. PeerJ 5: e3682 [DOI] [PMC free article] [PubMed] [Google Scholar]
- Chiavarina B, Martinez‐Outschoorn UE, Whitaker‐Menezes D, Howell A, Tanowitz HB, Pestell RG, Sotgia F, Lisanti MP (2012) Metabolic reprogramming and two‐compartment tumor metabolism: opposing role(s) of HIF1alpha and HIF2alpha in tumor‐associated fibroblasts and human breast cancer cells. Cell Cycle 11: 3280–3289 [DOI] [PMC free article] [PubMed] [Google Scholar]
- Commisso C, Davidson SM, Soydaner‐Azeloglu RG, Parker SJ, Kamphorst JJ, Hackett S, Grabocka E, Nofal M, Drebin JA, Thompson CB et al (2013) Macropinocytosis of protein is an amino acid supply route in Ras‐transformed cells. Nature 497: 633–637 [DOI] [PMC free article] [PubMed] [Google Scholar]
- Diedrich JD, Rajagurubandara E, Herroon MK, Mahapatra G, Huttemann M, Podgorski I (2016) Bone marrow adipocytes promote the Warburg phenotype in metastatic prostate tumors via HIF‐1alpha activation. Oncotarget 7: 64854–64877 [DOI] [PMC free article] [PubMed] [Google Scholar]
- Efeyan A, Zoncu R, Sabatini DM (2012) Amino acids and mTORC1: from lysosomes to disease. Trends Mol Med 18: 524–533 [DOI] [PMC free article] [PubMed] [Google Scholar]
- Engelman JA, Luo J, Cantley LC (2006) The evolution of phosphatidylinositol 3‐kinases as regulators of growth and metabolism. Nat Rev Genet 7: 606–619 [DOI] [PubMed] [Google Scholar]
- Fiaschi T, Marini A, Giannoni E, Taddei ML, Gandellini P, De Donatis A, Lanciotti M, Serni S, Cirri P, Chiarugi P (2012) Reciprocal metabolic reprogramming through lactate shuttle coordinately influences tumor‐stroma interplay. Cancer Res 72: 5130–5140 [DOI] [PubMed] [Google Scholar]
- Fong MY, Zhou W, Liu L, Alontaga AY, Chandra M, Ashby J, Chow A, O'Connor ST, Li S, Chin AR et al (2015) Breast‐cancer‐secreted miR‐122 reprograms glucose metabolism in premetastatic niche to promote metastasis. Nat Cell Biol 17: 183–194 [DOI] [PMC free article] [PubMed] [Google Scholar]
- Gould SJ, Raposo G (2013) As we wait: coping with an imperfect nomenclature for extracellular vesicles. J Extracell Vesicles 2: 20389 [DOI] [PMC free article] [PubMed] [Google Scholar]
- Hosios AM, Hecht VC, Danai LV, Johnson MO, Rathmell JC, Steinhauser ML, Manalis SR, Vander Heiden MG (2016) Amino acids rather than glucose account for the majority of cell mass in proliferating mammalian cells. Dev Cell 36: 540–549 [DOI] [PMC free article] [PubMed] [Google Scholar]
- Jeppesen DK, Fenix AM, Franklin JL, Higginbotham JN, Zhang Q, Zimmerman LJ, Liebler DC, Ping J, Liu Q, Evans R et al (2019) Reassessment of exosome composition. Cell 177: 428–445.e18 [DOI] [PMC free article] [PubMed] [Google Scholar]
- Ji H, Greening DW, Barnes TW, Lim JW, Tauro BJ, Rai A, Xu R, Adda C, Mathivanan S, Zhao W et al (2013) Proteome profiling of exosomes derived from human primary and metastatic colorectal cancer cells reveal differential expression of key metastatic factors and signal transduction components. Proteomics 13: 1672–1686 [DOI] [PubMed] [Google Scholar]
- Kamphorst JJ, Nofal M, Commisso C, Hackett SR, Lu W, Grabocka E, Vander Heiden MG, Miller G, Drebin JA, Bar‐Sagi D et al (2015) Human pancreatic cancer tumors are nutrient poor and tumor cells actively scavenge extracellular protein. Cancer Res 75: 544–553 [DOI] [PMC free article] [PubMed] [Google Scholar]
- Kim YC, Guan KL (2015) mTOR: a pharmacologic target for autophagy regulation. J Clin Invest 125: 25–32 [DOI] [PMC free article] [PubMed] [Google Scholar]
- Laplante M, Sabatini DM (2009) An emerging role of mTOR in lipid biosynthesis. Curr Biol 19: R1046–R1052 [DOI] [PMC free article] [PubMed] [Google Scholar]
- Lemons JM, Feng XJ, Bennett BD, Legesse‐Miller A, Johnson EL, Raitman I, Pollina EA, Rabitz HA, Rabinowitz JD, Coller HA (2010) Quiescent fibroblasts exhibit high metabolic activity. PLoS Biol 8: e1000514 [DOI] [PMC free article] [PubMed] [Google Scholar]
- Martinez‐Outschoorn UE, Lin Z, Whitaker‐Menezes D, Howell A, Lisanti MP, Sotgia F (2012) Ketone bodies and two‐compartment tumor metabolism: stromal ketone production fuels mitochondrial biogenesis in epithelial cancer cells. Cell Cycle 11: 3956–3963 [DOI] [PMC free article] [PubMed] [Google Scholar]
- Martinez‐Outschoorn UE, Lisanti MP, Sotgia F (2014) Catabolic cancer‐associated fibroblasts transfer energy and biomass to anabolic cancer cells, fueling tumor growth. Semin Cancer Biol 25: 47–60 [DOI] [PubMed] [Google Scholar]
- Muranen T, Iwanicki MP, Curry NL, Hwang J, DuBois CD, Coloff JL, Hitchcock DS, Clish CB, Brugge JS, Kalaany NY (2017) Starved epithelial cells uptake extracellular matrix for survival. Nat Commun 8: 13989 [DOI] [PMC free article] [PubMed] [Google Scholar]
- Ong SE, Blagoev B, Kratchmarova I, Kristensen DB, Steen H, Pandey A, Mann M (2002) Stable isotope labeling by amino acids in cell culture, SILAC, as a simple and accurate approach to expression proteomics. Mol Cell Proteomics 1: 376–386 [DOI] [PubMed] [Google Scholar]
- Palm W, Park Y, Wright K, Pavlova NN, Tuveson DA, Thompson CB (2015) The utilization of extracellular proteins as nutrients is suppressed by mTORC1. Cell 162: 259–270 [DOI] [PMC free article] [PubMed] [Google Scholar]
- Pavlova NN, Thompson CB (2016) The emerging hallmarks of cancer metabolism. Cell Metab 23: 27–47 [DOI] [PMC free article] [PubMed] [Google Scholar]
- Perez‐Riverol Y, Csordas A, Bai J, Bernal‐Llinares M, Hewapathirana S, Kundu DJ, Inuganti A, Griss J, Mayer G, Eisenacher M et al (2019) The PRIDE database and related tools and resources in 2019: improving support for quantification data. Nucleic Acids Res 47: D442–D450 [DOI] [PMC free article] [PubMed] [Google Scholar]
- Quek C, Bellingham SA, Jung CH, Scicluna BJ, Shambrook MC, Sharples RA, Cheng L, Hill AF (2017) Defining the purity of exosomes required for diagnostic profiling of small RNA suitable for biomarker discovery. RNA Biol 14: 245–258 [DOI] [PMC free article] [PubMed] [Google Scholar]
- Sancak Y, Peterson TR, Shaul YD, Lindquist RA, Thoreen CC, Bar‐Peled L, Sabatini DM (2008) The Rag GTPases bind raptor and mediate amino acid signaling to mTORC1. Science 320: 1496–1501 [DOI] [PMC free article] [PubMed] [Google Scholar]
- Saxton RA, Sabatini DM (2017) mTOR signaling in growth, metabolism, and disease. Cell 168: 960–976 [DOI] [PMC free article] [PubMed] [Google Scholar]
- Schmidt EK, Clavarino G, Ceppi M, Pierre P (2009) SUnSET, a nonradioactive method to monitor protein synthesis. Nat Methods 6: 275–277 [DOI] [PubMed] [Google Scholar]
- Shurtleff MJ, Yao J, Qin Y, Nottingham RM, Temoche‐Diaz MM, Schekman R, Lambowitz AM (2017) Broad role for YBX1 in defining the small noncoding RNA composition of exosomes. Proc Natl Acad Sci USA 114: E8987–E8995 [DOI] [PMC free article] [PubMed] [Google Scholar]
- Suh EJ, Remillard MY, Legesse‐Miller A, Johnson EL, Lemons JM, Chapman TR, Forman JJ, Kojima M, Silberman ES, Coller HA (2012) A microRNA network regulates proliferative timing and extracellular matrix synthesis during cellular quiescence in fibroblasts. Genome Biol 13: R121 [DOI] [PMC free article] [PubMed] [Google Scholar]
- Tauro BJ, Greening DW, Mathias RA, Ji H, Mathivanan S, Scott AM, Simpson RJ (2012) Comparison of ultracentrifugation, density gradient separation, and immunoaffinity capture methods for isolating human colon cancer cell line LIM1863‐derived exosomes. Methods 56: 293–304 [DOI] [PubMed] [Google Scholar]
- Tsuyada A, Chow A, Wu J, Somlo G, Chu P, Loera S, Luu T, Li AX, Wu X, Ye W et al (2012) CCL2 mediates cross‐talk between cancer cells and stromal fibroblasts that regulates breast cancer stem cells. Cancer Res 72: 2768–2779 [DOI] [PMC free article] [PubMed] [Google Scholar]
- Yan W, Wu X, Zhou W, Fong MY, Cao M, Liu J, Liu X, Chen CH, Fadare O, Pizzo DP et al (2018) Cancer‐cell‐secreted exosomal miR‐105 promotes tumour growth through the MYC‐dependent metabolic reprogramming of stromal cells. Nat Cell Biol 20: 597–609 [DOI] [PMC free article] [PubMed] [Google Scholar]
- Zhao H, Yang L, Baddour J, Achreja A, Bernard V, Moss T, Marini JC, Tudawe T, Seviour EG, San Lucas FA et al (2016) Tumor microenvironment derived exosomes pleiotropically modulate cancer cell metabolism. Elife 5: e10250 [DOI] [PMC free article] [PubMed] [Google Scholar]
- Zhou W, Fong MY, Min Y, Somlo G, Liu L, Palomares MR, Yu Y, Chow A, O'Connor ST, Chin AR et al (2014) Cancer‐secreted miR‐105 destroys vascular endothelial barriers to promote metastasis. Cancer Cell 25: 501–515 [DOI] [PMC free article] [PubMed] [Google Scholar]
- Zhou X, Clister TL, Lowry PR, Seldin MM, Wong GW, Zhang J (2015) Dynamic visualization of mTORC1 activity in living cells. Cell Rep 10: 1767–1777 [DOI] [PMC free article] [PubMed] [Google Scholar]
Associated Data
This section collects any data citations, data availability statements, or supplementary materials included in this article.
Supplementary Materials
Expanded View Figures PDF
Dataset EV1
Source Data for Expanded View
Review Process File
Source Data for Figure 1
Source Data for Figure 4
Source Data for Figure 5
Data Availability Statement
The datasets produced in this study are available in the following databases:
RNA‐Seq data: Gene Expression Omnibus GSE140852 (https://www.ncbi.nlm.nih.gov/geo/query/acc.cgi?acc=GSE140852)
Mass spectrometry proteomics data: ProteomeXchange Consortium via the PRIDE (Perez‐Riverol et al, 2019) partner repository dataset identifier PXD022311 (http://www.ebi.ac.uk/pride/archive/projects/PXD022311)


