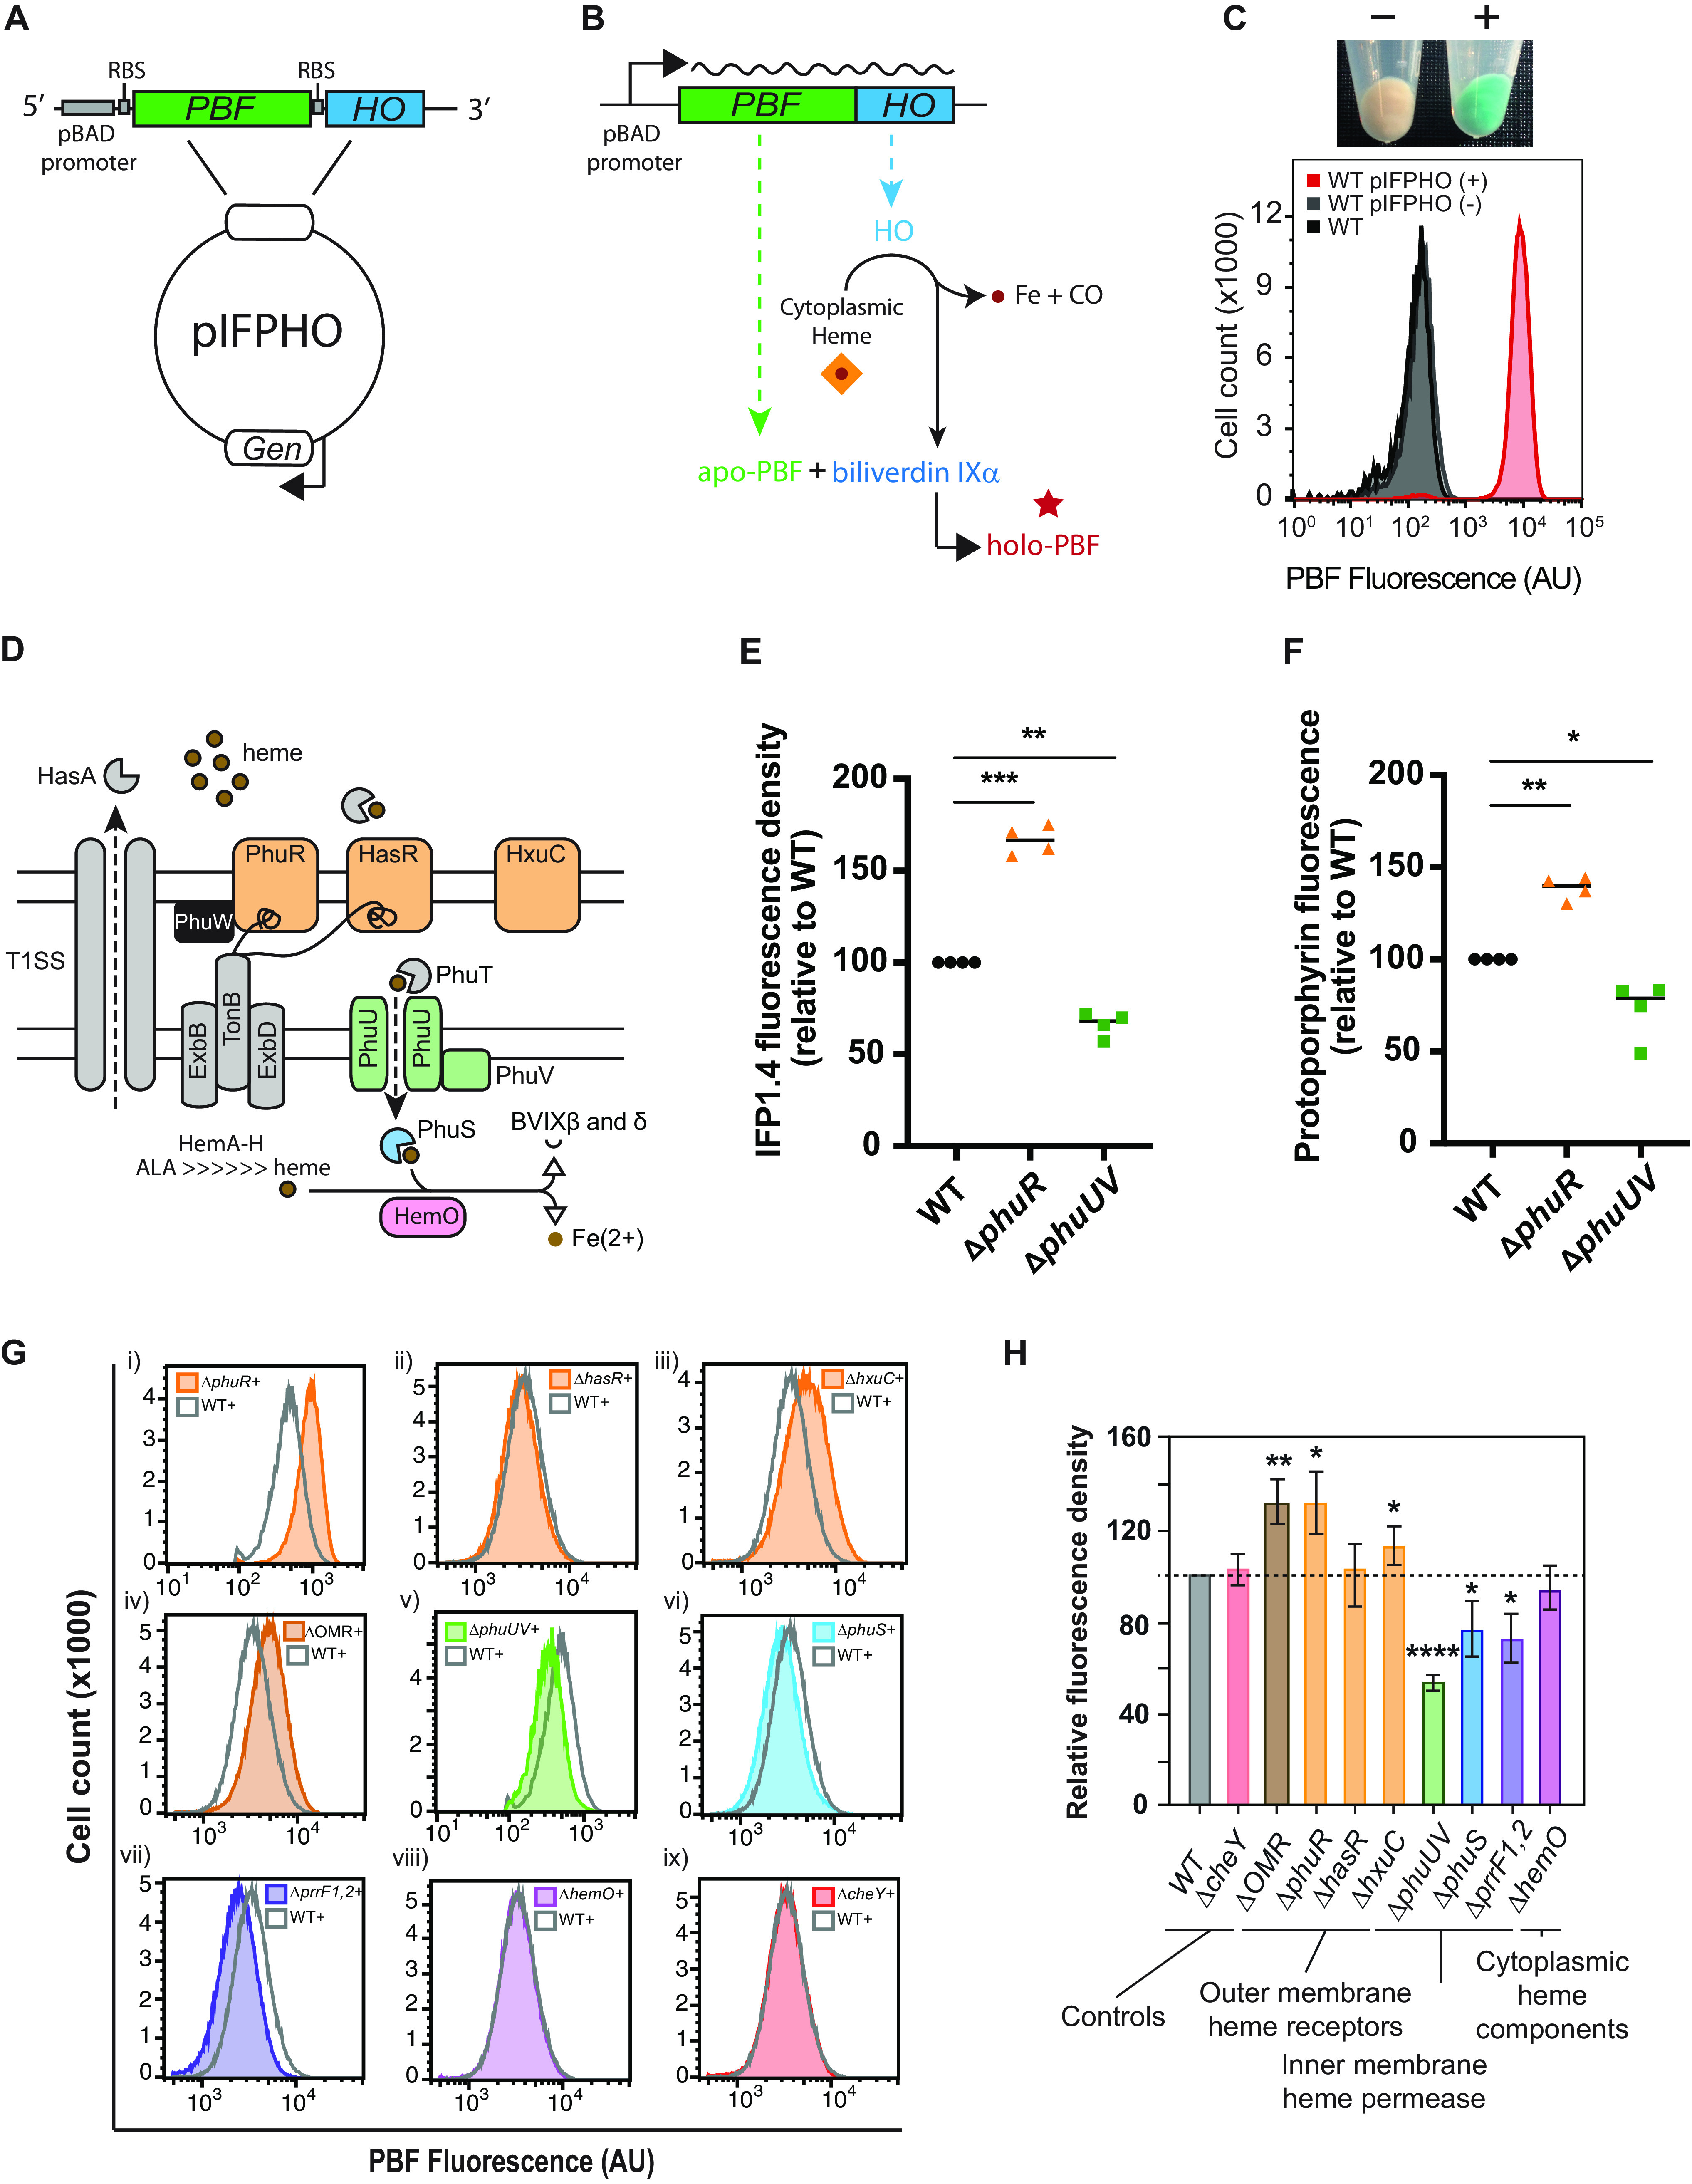
FIG 1.

PBF-HO heme biosensor. Map of the pIFPHO plasmid, constructed from parent plasmid pSB109 (A) and schematic diagram depicting biosensor function (B). (C) (Top) Cell pellets of MPAO1 pIFPHO grown in M9 minimal medium plus 5 μM heme without (−) and with (+) 0.2% arabinose. (Bottom) Flow cytometric analysis of MPAO1 WT and MPAO1 pIFPHO without (−) or with (+) 0.2% arabinose. Data are representative of two biological repeats. (D) Schematic representation of components of the known heme uptake and processing systems of P. aeruginosa. Biosensor (IFP1.4) fluorescence density (E) and protoporphyrin fluorescence (F) as measured according to reference 30 after 14 h of growth in M9 plus 5 μM heme and 0.2% arabinose. Both fluorescence density and protoporphyrin fluorescence data were derived from the same samples for optimal comparison. Individual data points are plotted. The horizontal lines indicate the median values from four biological repeats. Flow cytometry analysis of PBF-expressing MPAO1 mutants (G) and the mean (± standard deviation [SD]) relative fluorescence density (H) at the 11-h time point after growth in M9 plus 5 μM heme and 0.2% arabinose. Three biological repeats are shown as a percentage of WT fluorescence. Statistically significant differences in panels E and F were determined using a one-sample t test with Wilcoxon test; statistically significant differences in panel H were determined using a one-sample t test. *, P < 0.05; **, P < 0.01; ***, P < 0.001; ****, P < 0.0001.
