Abstract
Esophageal squamous cell carcinoma (ESCC) is the most common subtype of esophageal cancer worldwide. The most commonly mutated gene in ESCC is TP53. Using a combinatorial genetic and carcinogenic approach, we generate a novel mouse model of ESCC expressing either mutant or null p53 and show that mutant p53 exhibits enhanced tumorigenic properties and displays a distinct genomic profile. Through RNA‐seq analysis, we identify several endocytic recycling genes, including Rab Coupling Protein (Rab11‐FIP1), which are significantly downregulated in mutant p53 tumor cells. In 3‐dimensional (3D) organoid models, genetic knockdown of Rab11‐FIP1 results in increased organoid size. Loss of Rab11‐FIP1 increases tumor cell invasion in part through mutant p53 but also in an independent manner. Furthermore, loss of Rab11‐FIP1 in human ESCC cell lines decreases E‐cadherin expression and increases mesenchymal lineage‐specific markers, suggesting induction of epithelial–mesenchymal transition (EMT). Rab11‐FIP1 regulates EMT through direct inhibition of Zeb1, a key EMT transcriptional factor. Our novel findings reveal that Rab11‐FIP1 regulates organoid formation, tumor cell invasion, and EMT.
Keywords: Epithelial–Mesenchymal transition, esophageal cancer, invasion, Rab coupling protein (Rab11‐FIP1)
Subject Categories: Cancer, Signal Transduction
Loss of the Rab coupling protein Rab11‐FIP1 fosters disruption of epithelial stratification, tumor cell invasion and EMT in esophageal squamous cell carcinoma.

Introduction
Esophageal cancer is a highly aggressive cancer and is the 6th leading cause of cancer death worldwide. Esophageal squamous cell carcinoma (ESCC) is the most prevalent subtype worldwide (Pennathur et al, 2013; Rustgi & El‐Serag, 2014). Patients with ESCC are often diagnosed with advanced stages of disease, associated with frequent metastases and a poor 5‐year survival rate of about 15% (Zhang et al, 2015). ESCC development is a multistep process, and several common genetic alterations have been identified, including mutations in TP53, overexpression of epidermal growth factor receptor (EGFR) and CCND1, and inactivation of CTNND1 and CDKN2A. A recent comprehensive genomic analysis of 158 ESCC patients identified TP53 as the most commonly mutated gene, with over 80% of cases containing a TP53 mutation, the majority of which were found in the DNA binding domain (Song et al, 2014).
TP53 is a canonical tumor suppressor gene that encodes for the protein p53, which is critical in the regulation of cell cycle, cell division, DNA damage repair, and apoptosis (Bieging et al, 2014). Point mutations of p53 have been shown to enable invasive and metastatic properties (Muller & Vousden, 2014). One molecular mechanism through which mutant p53 regulates tumor cell invasion is through the endocytic recycling pathway (Muller et al, 2009; Muller et al, 2013). Endocytic trafficking is critical to proper cell function, and a wide variety of cargo is trafficked by the endocytic pathway, including growth factor receptors, adhesion proteins, and G protein‐coupled receptors. Alterations in endocytosis, trafficking, and recycling are key drivers of cancer and affect all stages of tumor progression through the regulation of several cancer hallmarks, such as epithelial polarity, epithelial to mesenchymal transition (EMT), cell adhesion, and growth factor signaling (Goldenring, 2013). Endocytic trafficking is coordinated by the Rab family of proteins, which are known to be deregulated in various cancers. Specifically, the recycling pathway is regulated by Rab11 and Rab25 that work in concert with their effector proteins to mediate protein trafficking back to the plasma membrane. Rab Coupling Protein (Rab11‐FIP1) is an effector and binding partner of Rab11 and Rab25 and has been shown to have tumor promoting and tumor suppressive functions by mediating EGFR and integrin trafficking to the membrane (Caswell et al, 2008; Zhang et al, 2009). Interestingly, mutant p53 has been implicated in the indirect regulation of EGFR and integrin recycling through Rab11‐FIP1 (Muller et al, 2009).
Previous work from our laboratory has demonstrated that overexpression of mutant p53 together with EGFR induces cell invasion when cells are grown in 3D organotypic culture (OTC; Michaylira et al, 2010). To identify genes that may regulate invasion in this system, we dissected (laser capture microdissection) invasive and non‐invasive regions from 3D OTC and performed RNA microarray analysis. Our results identified POSTN and WNT10A as mediators of invasion (Michaylira et al, 2010). In addition, the RNA microarray analysis revealed that several endocytic recycling genes were downregulated significantly in the invasive cells in the OTCs overexpressing EGFR and mutant p53, when compared to non‐invasive cells. In our current study, we utilize mouse models of mutant p53 overexpression or p53 loss together with a chemical carcinogen administration to phenocopy key features of human ESCC and to identify genetic pathways that are differentially regulated by mutant p53. We show that several genes in the recycling pathway, including Rab11‐FIP1, are downregulated in mutant p53 esophageal tumor cells compared to WT p53 cells. Knockdown of Rab11‐FIP1 results in increased organoid size in ESCC 3D organoid culture. Depletion of Rab11‐FIP1 also promotes tumor cell invasion. Furthermore, our data show that loss of Rab11‐FIP1 in ESCC cell lines induces EMT. Mechanistically, we have identified Zeb1 as a downstream effector of Rab11‐FIP1 to mediate EMT in ESCC. Taken together, our results support a model wherein Rab11‐FIP1 induces EMT to promote tumor cell invasion.
Results and Discussion
A novel mouse model of mutant p53 driven ESCC is generated
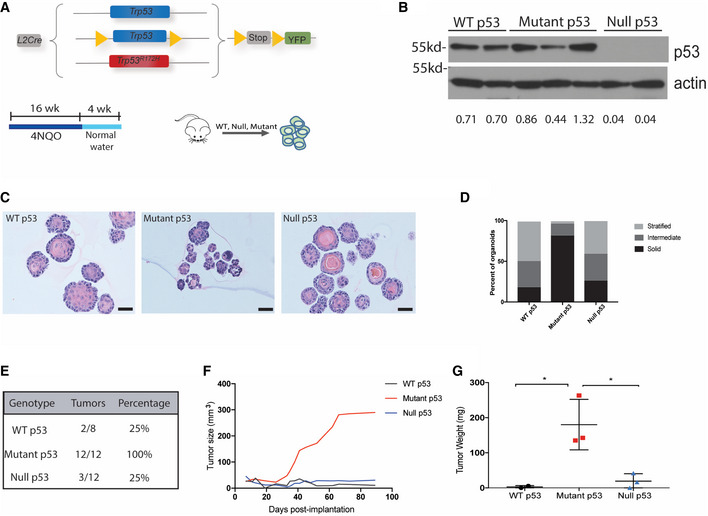
We generated a mouse model of mutant p53‐driven ESCC using a combined genetic and carcinogenic approach. We combined the esophagus specific L2‐Cre promoter (Stairs et al, 2011) with a Rosa26lox‐Stop‐lox‐YFP allele and crossed it with Trp53+/+, Trp53‐/‐, or Trp53R172H mice. We generated three experimental genotypes: L2‐Cre;Trp53+/+;Rosa26lox‐Stop‐lox‐YFP, L2‐Cre;Trp53‐/‐;Rosa26lox‐Stop‐lox‐YFP, and L2‐Cre;Trp53R172H/‐; Rosa26lox‐Stop‐lox‐YFP which will be referred to as p53 WT, null, and mutant, respectively (Fig 1A). In addition, p53 mutant and p53 null mice were treated with the carcinogen 4‐nitroquinoline 1‐oxide (4‐NQO) in drinking water for 16 weeks. 4‐NQO is a quinolone derivative that causes DNA injury similar to the carcinogens in tobacco smoke, leading to malignant esophageal lesions similar to that observed in esophageal squamous cell carcinomas (Tang et al, 2004). After 16 weeks of 4NQO treatment, the mice were switched to normal drinking water for 2–4 weeks. Esophageal tissues were then harvested and YFP+ esophageal epithelial cells were isolated from WT, null, and mutant p53 mice by FACS and early passage cell lines were generated. Our analysis of p53 protein levels in the established cell lines confirmed low, high, and absent expression of p53 in WT, mutant, and null p53 cells, respectively (Fig 1B).
Figure 1. Mutant p53 increases tumorigenic potential of ESCC cells.
-
ASchematic of the p53 mouse model which generates L2‐Cre;Trp53+/+;R26lox‐Stop‐lox‐YFP, L2‐Cre;Trp53‐/‐;R26lox‐Stop‐lox‐YFP, and L2‐Cre;Trp53R172H/‐;R26lox‐Stop‐lox‐YFP mice. Mice were treated with 4NQO in the drinking water for 16 weeks followed by normal water. Esophageal epithelial cells were isolated, and cell lines were generated.
-
BCell lines generated from WT, null, and mutant p53 esophagi were assessed by Western blot analysis for p53 protein expression. Relative intensity densitometry of Rab11‐FIP1 results is shown at the bottom.
-
COrganoids generated from WT, mutant, and null p53 cell lines. Scale bar: 100 μm.
-
DQuantification of the portion of organoids exhibiting a solid, intermediate, or stratified morphology (>37 organoids from 2–3 cell lines per group).
-
E–GCells were subcutaneously injected in the lower flanks of nude mice (n = 4 flanks/cell line. WT p53 2 cell lines, Mutant p53‐3 cell lines, p53 null‐3 cell lines). E. The number of tumors formed in each group was quantified. F. Tumor growth was measured at the indicated time points post‐implantation. Graph represents total tumor size per group. G. Average tumor weight following dissection (n = 2 biological replicates for WT p53 cell lines, n = 3 biological replicates for mutant p53 cell lines, n = 3 biological replicates for p53 null cell lines, n = 4 technical replicates injected per cell line, calculated as average tumor weight per cell line). Error bars represent ± SEM. *P = 0.02 Mutant p53 vs. WT p53, *P = 0.02 Mutant p53 vs. Null p53 (one‐way ANOVA).
Source data are available online for this figure.
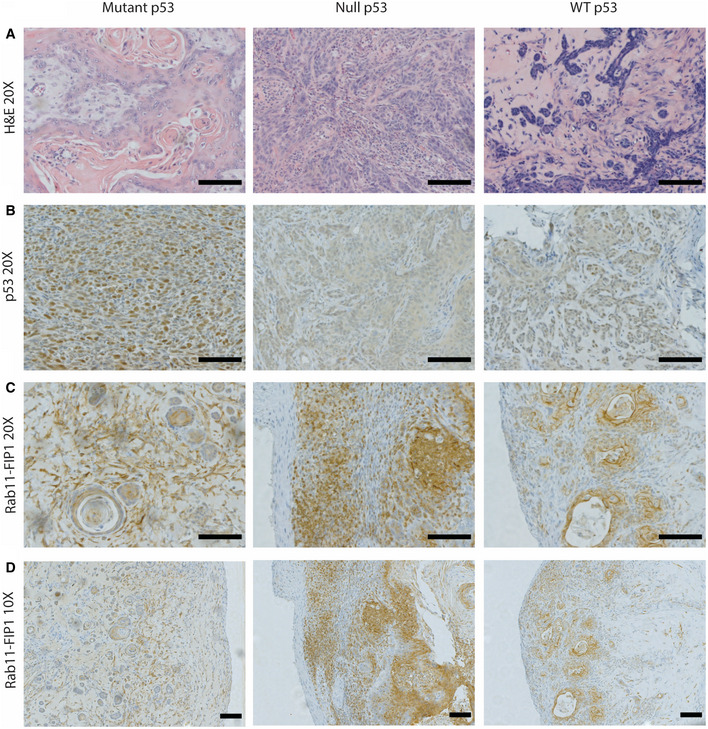
To investigate the tumorigenic potential of WT, null, and mutant p53‐expressing cells, we generated esophageal 3D organoids and compared organoid structure and epithelial organization based upon p53 status. Organoids generated from WT p53 cells were primarily large, spherical in shape and well‐stratified. 3D organoids derived from p53 null cells were morphologically similar to WT organoids with slightly less stratification (Fig 1C and D). Conversely, 3D organoids generated from mutant p53 cells were smaller, irregularly shaped and exhibited little stratification (Fig 1C and D). To study the tumorigenic properties of WT, null, and mutant p53 cells, we established a subcutaneous xenograft model in immunodeficient nude mice. WT p53 cells formed small tumors in two out of eight injected flanks with an average tumor weight of 11 mg. P53 null cells produced slightly larger tumors in three of 12 flanks with an average weight of 77.3 mg. Strikingly, mutant p53 cells produced tumors in all 12 of 12 injected flanks. These tumors developed faster, grew larger in size, and had an average weight of 180 mg (Fig 1E–G). Histological analysis validated that all tumors were squamous cell carcinomas (Fig EV1A), and immunohistochemical staining for p53 confirmed that p53 expression was highest in mutant p53 tumors and absent in p53 null tumors (Fig EV1B). Taken together, these studies suggest that mutant p53 enhances tumorigenicity in ESCC.
Figure EV1. Hematoxylin‐eosin staining and Immunostaining for p53 and Rab11‐FIP1 in subcutanous tumors.
-
AHematoxylin–eosin staining of subcutaneous xenograft tumors formed by mutant p53‐expressing, p53‐null or WT p53 ESCC cells. 20×. Scale bar = 100 μm.
-
BImmunostaining for p53 in subcutaneous xenograft tumors formed by mutant p53‐expressing, p53‐null or WT p53 ESCC cells. 20×. Scale bar = 100 μm.
-
C, DImmunostaining for Rab11‐FIP1 in mutant p53, null p53 or WT p53 subcutaneous xenograft tumors. Scale bar = 100 μm. 20 × and 10×, respectively.
Endocytic recycling genes are downregulated in mutant p53 cells
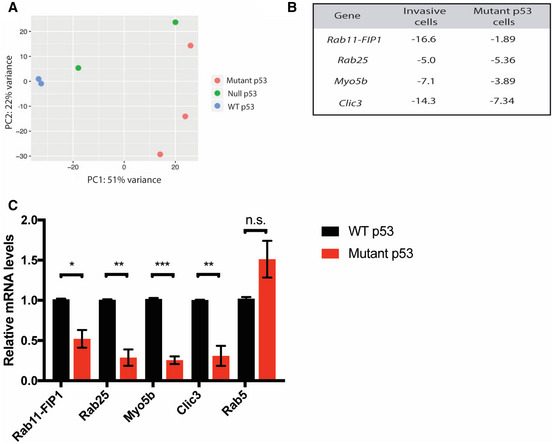
To assess how mutant p53 promotes tumorigenicity in ESCC, we next performed RNA‐seq of WT, null, and mutant p53 cells to identify genes with significantly different expression levels based upon p53 status. A principal component analysis (PCA) revealed that WT and mutant p53 samples cluster away from each other (Fig 2A), indicating distinct transcriptome signatures, and thus, serving as the basis for our further experiments, since mutant p53 is more prevalent in ESCC than loss of p53. Consistent with our previous finding that expression of several endocytic recycling genes is reduced in invasive ESCC cells (Michaylira et al, 2010), we found that endocytic recycling genes are downregulated in mutant p53 cells compared to WT p53 cells (Fig 2B). These data suggest that intracellular recycling may be impaired in invasive ESCC as a possible functional consequence of mutant p53. To confirm our RNA‐seq results, we verified RNA levels of RAB25, Rab11‐FIP1, Myo5b, and CLIC3 were significantly downregulated in mutant p53 cells, compared to WT p53 cells (Fig 2C). To determine if mutant p53 regulation of the endocytic recycling pathway was specific, we also examined the expression level of a non‐recycling gene, Rab5, which is involved in the early endocytic pathway. Unlike the recycling genes, Rab5 expression was not reduced by mutant p53 expression (Fig 2C). These findings suggest that the effect of mutant p53 is specific to the endocytic recycling pathway.
Figure 2. Endocytic recycling genes are downregulated in mutant p53 cells.
-
ARNA‐seq was performed on WT, mutant, and null p53 low passage cell lines. Principle component analysis (PCA) highlights distinct genetic profiles based on p53 status.
-
BRelative fold change in expression level of endocytic recycling genes in invasive vs. non‐invasive cells, and in mutant vs. WT p53 cells based on microarray and RNA‐seq analysis, respectively.
-
CqPCR analysis of recycling‐related gene expression in mutant p53 relative to WT p53 cells (red and black bars, respectively). Graphs represent mean ± SEM (n = 3 biological replicates for Rab11‐FIP1, Rab25, Myo5b and Clic3; n = 2 biological replicates for Rab5). Rab11‐FIP1 *P = 0.0109, Rab25 **P = 0.0021, Myo5b ***P = 0.0001, Clic3 **P = 0.0051, Rab5 no significant differences (n.s.) (Unpaired t‐test).
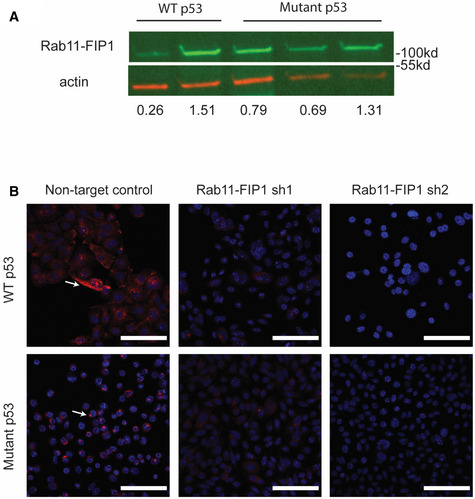
Since expression of recycling genes is reduced both in invasive cells and in mutant p53 cells, we next sought to elucidate the contribution of endocytic recycling in mutant p53 driven ESCC tumor invasion. Previous work has suggested that Rab11‐FIP1 may be regulated by mutant p53 in an indirect manner (Muller et al, 2009). Therefore, we investigated the role of Rab11‐FIP1‐mediated recycling in ESCC invasion and tumorigenesis. Rab11‐FIP1 expression and localization were examined by Western blotting and immunofluorescence staining in WT and mutant p53 cells (Fig EV2). In WT p53 cells, Rab11‐FIP1 is expressed throughout the cytoplasm (Fig EV2B). However, in mutant p53 cells, Rab11‐FIP1 expression is reduced (Fig EV2A and B) and localized to small perinuclear puncta (Fig EV2B), suggesting that the endocytic recycling compartment may be dysregulated in mutant p53 cells.
Figure EV2. Expression patterns of Rab11‐FIP1 in WT or Mutant p53 parental or Rab11‐FIP1 depleted cells.
-
ARepresentative Western blot for Rab11‐FIP1 in WT and mutant p53 cell lines relative to actin. Relative intensity densitometry of Rab11‐FIP1 results are shown at bottom.
-
BImmunofluorescent staining for Rab11‐FIP1 (red) in WT and mutant p53 cells expressing non‐target control or Rab11‐FIP1 shRNAs. White arrows indicate Rab11‐FIP1 staining. 40×. Scale bar = 100 μm.
Knockdown of Rab11‐FIP1 increases epithelial disorganization and organoid size
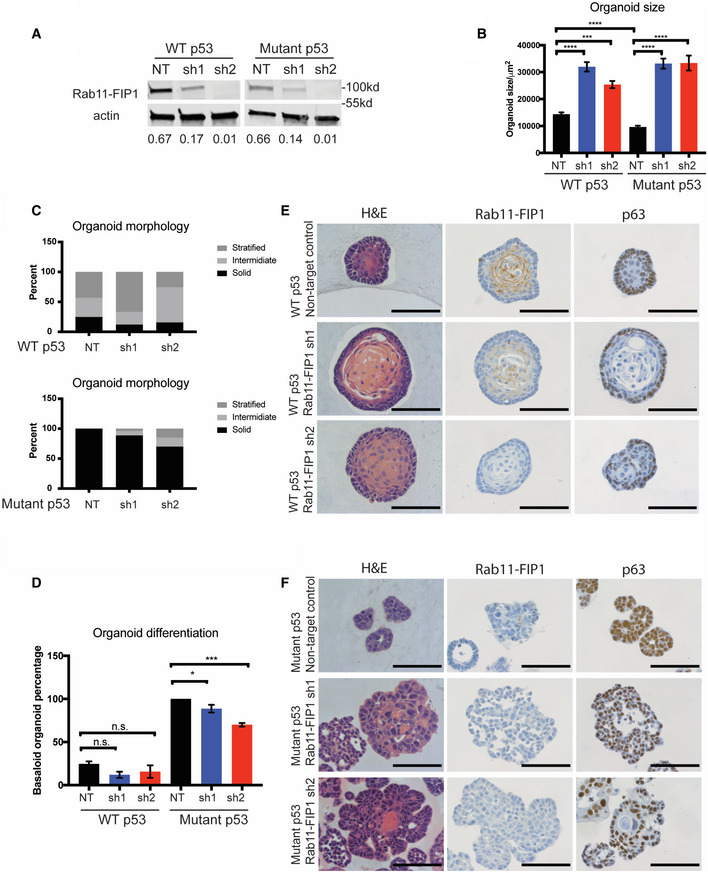
To study the functional role of Rab11‐FIP1 in ESCC, we knocked down Rab11‐FIP1 expression in WT and mutant p53 cells with two different shRNAs (Fig 3A). We then used a 3D organoid model to examine epithelial organization and tumorigenic properties in Rab11‐FIP1‐depleted cells. Loss of Rab11‐FIP1 in both WT and mutant p53 cells resulted in a significant increase in 3D organoid size (Fig 3B). We next classified 3D organoids by a stratified, intermediate, or solid morphology (Fig 3C). We observed a decrease in solid organoid percentage following depletion of Rab11‐FIP1 in both WT and mutant p53 organoids (Fig 3C). Furthermore, we categorized 3D organoid differentiation by the features of being basaloid and keratinized. In the context of WT p53 and mutant p53, Rab11‐FIP1 loss leads to a decrease in basaloid organoid percentage (Fig 3D). This is consistent with the results of immunohistochemical staining for the basal cell transcriptional factor p63 (Fig 3E and F). In the context of WT p53, Rab11‐FIP1 loss results in a decreased level of p63 (Fig 3E). 3D organoids harboring mutant p53 show high p63 expression. Depletion of Rab11‐FIP1 leads to a slight decrease in p63 expression, likely due to the low expression of Rab11‐FIP1 in mutant p53 organoids (Fig 3D). Taken together, these factors may contribute to the larger overall 3D organoid size, a property of tumorigenesis following Rab11‐FIP1 depletion.
Figure 3. Knockdown of Rab11‐FIP1 promotes epithelial disorganization and increases 3D organoid size.
-
AWestern blot confirming knockdown of Rab11‐FIP1 by shRNAs. Relative intensity by densitometry of Rab11‐FIP1 results are shown at the bottom.
-
B–F3D organoids were generated from WT and mutant p53 cells expressing non‐targeting control (NT) or Rab11‐FIP1 shRNAs (sh1 and sh2). (B) Diameter of organoids (n = 80–130 organoids). Bar graph represents mean diameter ± SEM. ****P < 0.0001 WT or mutant p53 non‐targeting control vs. Rab11‐FIP1 shRNA1, ***P = 0.0006 WT non‐targeting control vs. Rab11‐FIP1 shRNA2, ****P < 0.0001 mutant p53 non‐targeting control vs. Rab11‐FIP1 shRNA2 (one‐way ANOVA). ****P < 0.0001 WT vs. mutant p53 non‐targeting control (Unpaired t‐test). (C) Percent of WT p53 (top panel) and mutant (bottom panel) organoids exhibiting a solid, intermediate, or stratified morphology (n > 50 organoids generated from three different cell passages quantified). (D) Percent of WT p53 and mutant organoids exhibiting a basaloid‐like morphology (n > 50 organoids generated from three different cell passages quantified). Bar graph represents mean diameter ± SEM. n.s. WT p53 non‐targeting control vs. Rab11‐FIP1 shRNAs, *P = 0.046 mutant p53 non‐targeting control vs. Rab11‐FIP1 shRNA1, ***P = 0.0002 mutant p53 non‐targeting control vs. Rab11‐FIP1 shRNA2 (one‐way ANOVA). (E) WT p53 organoids stained for H&E (left), Rab11‐FIP1 (middle), and the basal cell marker p63 (right) by immunohistochemistry (IHC). 40×. Scale bar = 100 μm. (F) Mutant p53 organoids stained for H&E (left), Rab11‐FIP1 (middle), and the basal cell marker p63 (right) by IHC. 40×. Scale bar = 100 μm.
Source data are available online for this figure.
Loss of Rab11‐FIP1 promotes ESCC invasion
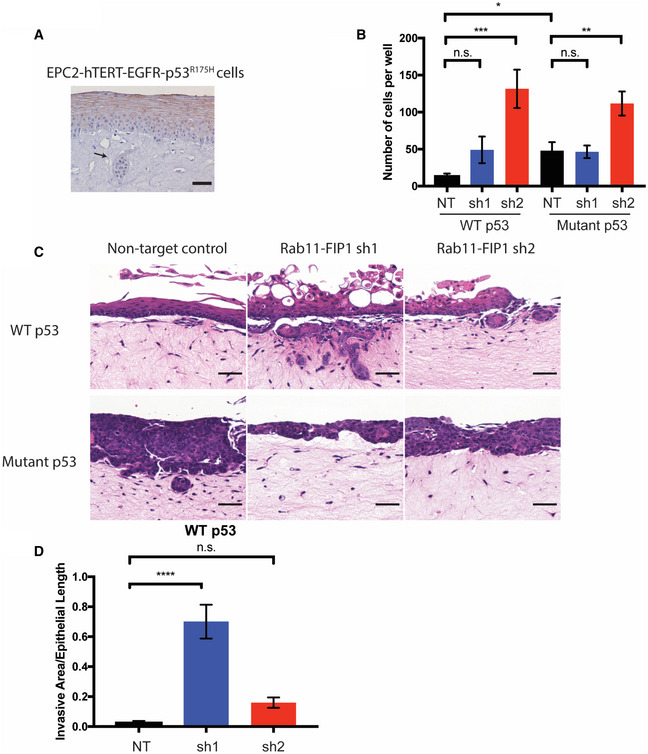
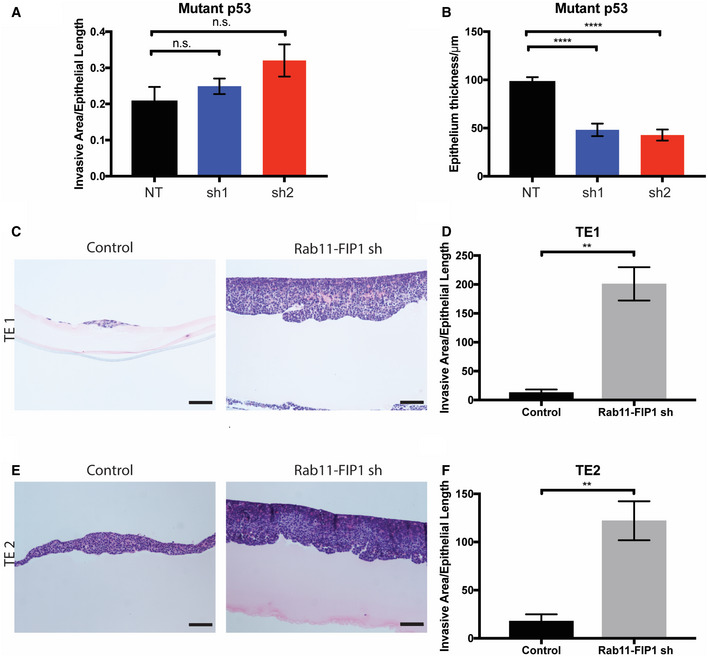
Rab11‐FIP1 expression was reduced in invasive regions compared to the non‐invasive normal region in 3D OTC (Fig 4A). In addition, immunohistochemical staining of Rab11‐FIP1 in xenograft tumors with mutant p53 shows a reduction of Rab11‐FIP1 in the invasive front of such tumors (Fig EV1C and D). Therefore, loss of Rab11‐FIP1 in invasive cells led us to investigate whether Rab11‐FIP1 could regulate tumor invasion directly. To assess the effect of Rab11‐FIP1 in invasion, we performed the Boyden chamber assay and demonstrated that Rab11‐FIP1 depletion significantly increased tumor cell invasion (Fig 4B). To address further the role of Rab11‐FIP1 in tumor cell invasion, we cultured WT and mutant p53 cells with Rab11‐FIP1 knockdown in 3D OTC models. In WT p53 OTC, reduction of Rab11‐FIP1 led to a significant invasive phenotype (Fig 4C and D). In mutant p53 OTC with intact Rab11‐FIP1 expression, a disorganized epithelium formed with a small degree of tumor cell invasion. However, reduction of Rab11‐FIP1 resulted only in a trend of increased invasion (Figs 4C and EV3A). This may be due to the poorly differentiated epithelium in 3D OTC harboring mutant p53 (Fig EV3B), which is intrinsically invasive, and thus, changes in invasion may be more challenging to evaluate in this assay.
Figure 4. Loss of Rab11‐FIP1 promotes mutant p53 driven invasion.
-
AEPC2‐hTERT‐EGFR‐p53R175H cells grown in OTC stained for RCP. Arrow indicates invasive region (scale bar = 100 μm).
-
BTranswell Boyden Chamber invasion assay of WT and mutant p53 cells expressing non‐targeting control (NT) and Rab11‐FIP1 shRNAs (sh1 and sh2; n = 6 technical replicates for WT p53 NT, n = 9 technical replicates for other groups from three different passages). Error bars represent ± SEM. n.s. WT p53 NT vs. sh1, ***P = 0.0005 WT p53 NT vs. sh2, n.s. Mutant p53 NT vs. sh1, **P = 0.0026 Mutant p53 NT vs. sh2, (one‐way ANOVA) *P = 0.0173 WT p53 NT vs. Mutant p53 NT, (unpaired t‐test).
-
C, DWT and mutant p53 cells expressing non‐target control and Rab11‐FIP1 shRNAs were grown in OTC. C. H&E staining of OTC with WT p53 (top) and mutant p53 (bottom) with invasive regions. Scale bar = 50 μm. D. Graph shows relative invasive area from OTC of WT p53 non‐target control and Rab11‐FIP1 shRNAs. n = 5 technical replicates in WT p53 NT, n = 6 technical replicates in WT p53 sh1, n = 6 technical replicates in WT p53 sh2. Error bars represent ± SEM. ****P < 0.0001 WT p53 NT vs. sh1, n.s. WT p53 NT vs. sh2 (one‐way ANOVA).
Figure EV3. The effects of Rab11‐FIP1 upon invasion in 3D organotypic cultures of murine mutant p53 cells and human ESCC cells.
-
ARelative invasive area from OTC of mutant p53 non‐target control and Rab11‐FIP1 shRNAs. n = 6 technical replicates in mutant p53 NT, sh1 and sh2 OTC. n.s. Mutant p53 NT vs. sh1, Mutant p53 NT vs. sh2 (one‐way ANOVA).
-
BEpithelial thickness quantification from OTC of mutant p53 non‐target control and Rab11‐FIP1 shRNAs. n = 6 technical replicates in mutant p53 NT, sh1, and sh2 OTC. Error bars represent ± SEM. ****Mutant p53 NT vs. sh1, Mutant p53 NT vs. sh2, P < 0.0001 (one‐way ANOVA).
-
C–F(C, E) TE1 and TE2 cells expressing control or Rab11‐FIP1 shRNA were grown in OTC. Scale bar = 100 μm. (D, F) Graphs show relative invasive area from OTC of TE1 and TE2 cells expressing control or Rab11‐FIP1 shRNA. Error bars represent ± SEM. TE1 n = 3 technical replicates in TE1 control and shRNA **P = 0.030, TE2 n = 3 technical replicates in TE1 control and shRNA **P = 0.0082 (Unpaired t‐test).
Loss of Rab11‐FIP1 induces epithelial–mesenchymal transition in ESCC
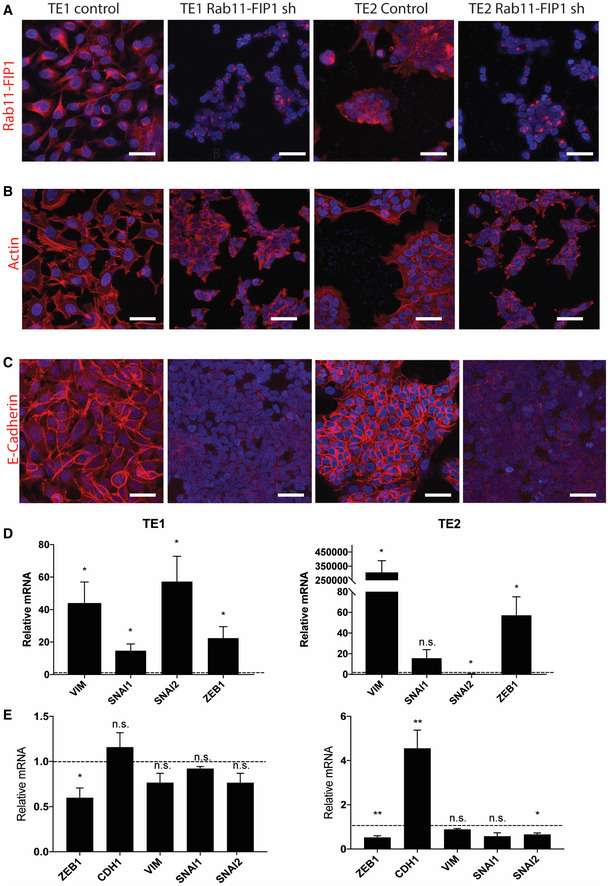
Next, we examined the effects of Rab11‐FIP1 downregulation in the well‐established human ESCC cell lines TE1 and TE2 (Nishihira et al, 1979). We used shRNAs to knock down Rab11‐FIP1 expression in TE1 and TE2 ESCC cell lines and used immunofluorescent staining to confirm a reduction of Rab11‐FIP1 levels (Fig 5A). Functionally, depletion of Rab11‐FIP1 in TE1 and TE2 cells promotes an invasive phenotype in OTC (Fig EV3C–F). Interestingly, knockdown of Rab11‐FIP1 also resulted in a disorganized actin cytoskeleton and changes in cell morphology consistent with a possible mesenchymal phenotype (Fig 5B). To further investigate this apparent loss of epithelial identity, we evaluated E‐cadherin expression and found a complete E‐cadherin loss in Rab11‐FIP1‐deficient cells, suggesting the possible emergence of EMT (Fig 5C). Therefore, we examined the expression levels of several EMT markers by qPCR. Compared to control cells, cells with Rab11‐FIP1 knockdown showed a drastic increase in several mesenchymal genes, including VIM and ZEB1 (Fig 5D). Conversely, depletion of ZEB1 in Rab11‐FIP1 knockdown TE1 and TE2 cells led to increased CDH1 expression and a decrease in mesenchymal genes, indicating the regulation of EMT by Rab11‐FIP1 is mediated possibly through ZEB1 (Fig 5E). Taken together, these results indicate that loss of Rab11‐FIP1 induces E‐cadherin downregulation and EMT through upregulation of ZEB1 in ESCC cells. Since EMT is involved in tumor cell invasion (Lamouille et al, 2014), our results suggest that Rab11‐FIP1 may regulate EMT through epithelial disorganization and invasion in ESCC.
Figure 5. Loss of Rab11‐FIP1 induces epithelial–mesenchymal transition in ESCC.
-
AImmunofluorescent staining for Rab11‐FIP1 in TE1 and TE2 ESCC cell lines expressing a non‐targeting control shRNA or shRNA against Rab11‐FIP1. Scale bar = 50 μm.
-
BImmunofluorescent staining for f‐actin in TE1 and TE2 ESCC cell lines expressing a non‐targeting control shRNA or shRNA against Rab11‐FIP1. Scale bar = 50 μm.
-
CImmunofluorescent staining for E‐cadherin, in TE1 and TE2 ESCC cell lines expressing a non‐targeting control shRNA or shRNA against Rab11‐FIP1. Scale bar = 50 μm.
-
DqPCR analysis of epithelial and mesenchymal gene expression in TE1 (left) and TE2 (right) cells expressing Rab11‐FIP1 shRNA relative to control cells (dotted line). Graph error bars represent mean SEM (n = 3 technical replicates from three different cell passages). n.s. TE2 SNAI2, *P < 0.05 (Unpaired t‐test).
-
EqPCR analysis of epithelial and mesenchymal gene expression following ZEB1 depletion in TE1 (left) and TE2 (right) cells expressing Rab11‐FIP1 shRNA relative to control cells (dotted line). Graph error bars represent mean SEM (n = 3 technical replicates from three different cell passages). **P < 0.01, *P < 0.05, n.s. TE1 CDH1, VIM. SNAI1, SNAI2, TE2 VIM, SNAI1 (Unpaired t‐test).
Endocytic trafficking mediates a wide range of cellular processes that drive cancer, and an imbalance in this trafficking dynamic can play a significant role in tumor cell invasion. TP53 is the gene most frequently mutated in ESCC, and in this study, we have shown that the p53R172H mutation results in downregulation of several endocytic recycling genes. In addition, we utilized 3D organoid and 3D organotypic culture models of ESCC to show that loss of the recycling gene Rab11‐FIP1 increases 3D organoid size and tumor cell invasion and promotes EMT. Taken together, these results suggest that regulation of the endocytic recycling pathway may be one potential mechanism of tumor cell invasion in ESCC, and perhaps, other cancers as well.
Rab25 has been implicated as an oncogene in luminal breast cancer, ovarian, lung, and bladder cancers (Cheng et al, 2004; Zhang et al, 2013; Mitra et al, 2016). Interestingly, Rab25 acts as a tumor suppressor gene in head and neck, colon and esophageal cancers (Goldenring & Nam, 2011; Tong et al, 2012; Amornphimoltham et al, 2013). However, the function of Rab11‐FIP1 in cancer has not been studied as thoroughly. In breast cancer, Rab11‐FIP1 has been shown to play both tumor enhancing and suppressive roles, and in head and neck cancer Rab11‐FIP1 expression correlates with malignant progression (Zhang et al, 2009; Dai et al, 2012; Boulay et al, 2016). In addition, Rab11‐FIP1 promotes metastasis in pancreatic adenocarcinoma (Gundry et al, 2017). However, our findings suggest that Rab11‐FIP1 may have tumor suppressive functions in ESCC.
The mechanism(s) underlying the role of Rab25 and Rab11‐FIP1 in cancer is currently unclear. The function of Rab25 and Rab11‐FIP1 likely depends upon the type of cargo being trafficked or the subcellular location in which the cargo is being trafficked. Alternatively, the role of these recycling proteins may depend on their interaction with various binding partners, including CLIC3, Myo5b, and Rab11. In addition, our work suggests that Rab11‐FIP1 may increase tumor cell invasion in part through mutant p53 but also in an independent manner. Interestingly, mutant p53 enhances Rab11‐FIP1‐dependent integrin and EGFR recycling, but the underlying mechanism is not clear (Muller et al, 2009).
Epithelial–mesenchymal transition is a key driver of tumor cell invasion and metastasis during cancer progression, and it is marked by downregulation of epithelial lineage genes, such as ECAD, and the upregulation of mesenchymal lineage genes, such as VIM. These phenotypic changes correspond to a shift in physiology of a cell undergoing EMT, as it gradually loses the ability to form tight junctions with neighboring cells and acquires greater mobility. We have shown that knockdown of Rab11‐FIP1 in human ESCC cell lines results in EMT, as evidenced by changes in morphology and a shift in lineage‐specific gene expression. We demonstrate that E‐cadherin is completely lost in cells with reduced Rab11‐FIP1, which is accompanied by disruption of the actin cytoskeleton (Fig 5). In addition, VIM and other mesenchymal specific genes are upregulated upon loss of Rab11‐FIP1 (Fig 5D).
Previous studies have shown that the role of Rab11‐FIP1 in EMT may vary. In breast cancer, loss of Rab11‐FIP1 leads to decreased E‐cadherin expression, while in lung adenocarcinoma E‐cadherin is increased upon loss of Rab11‐FIP1 (Boulay et al, 2016; Lindsay & McCaffrey, 2017). In addition, overexpression of Rab11‐FIP1 results in upregulated Slug expression and downregulated E‐cadherin expression to promote EMT and tumor invasion (Hwang et al, 2017). Interestingly, our results suggest that in ESCC, Slug is not critical for the downregulation of E‐cadherin and EMT. In TE1 ESCC cells, Slug (Snai2) is upregulated approximately 60‐fold while in TE2 ESCC cells lines Slug is downregulated significantly despite reduced E‐cadherin levels in both ESCC cell lines (Fig 5D).
Our data suggest that Zeb1 may be vital in Rab11‐FIP1‐mediated effects. Zeb1 is appreciated as a key transcription factor in EMT, and it is significantly upregulated in response to Rab11‐FIP1 reduction (Fig 5D). This finding prompted us to investigate whether Zeb1 may be crucial in Rab11‐FIP1 loss‐driven EMT. Indeed, siRNA‐mediated knockdown of Zeb1 in ESCC cell lines TE1 and TE2 reversed the EMT gene expression signature induced in these cells through loss of Rab11‐FIP1 (Fig 5E). Taken together, we propose that Rab11‐FIP1 regulates EMT through the modulation of Zeb1.
Previous studies investigating the role of Rab11‐FIP1 in tumorigenesis have exclusively utilized 2D cell culture systems. In our study we employ two 3D culture models, namely 3D organoids and 3D organotypic culture, which are more physiologically relevant. We have demonstrated that loss of Rab11‐FIP1 increases organoid size and enhances invasion in organotypic culture models, which has not been reported previously.
TP53 is the gene most commonly mutated in ESCC. In this study, we demonstrate that in ESCC, mutant p53 interferes with the endocytic recycling pathway, which normally assists in maintaining epithelial identity. ESCC cells that acquire p53 mutations have reduced expression of Rab11‐FIP1, a component of the endocytic recycling pathway. It is conceivable that downregulation of Rab11‐FIP1 may be involved in certain contexts as a partial contributor to the function of mutant p53 in tumorigenesis, but that Rab11‐FIP1‐mediated tumor cell invasion involves EMT and induction of Zeb1.
Materials and Methods
Animal models
The Institutional Animal Care and Use Committee of the University of Pennsylvania approved all animal studies. Mice were housed in a pathogen‐free facility at the University of Pennsylvania (Philadelphia, PA, USA). Trp53LoxP (Marino et al, 2000), Trp53R172H (Olive et al, 2004), and Rosa26loxP‐STOP‐loxP‐EYPF (Srinivas et al, 2001) mice were obtained from Jackson Laboratory. L2‐Cre transgenic mice were generated by cloning Cre recombinase under control of the EBV ED‐L2 promoter (Nakagawa et al, 1997). 4‐nitroquinoline 1‐oxide (4‐NQO) treatment was performed as previously described (Long et al, 2015). Briefly, 8‐week‐old mice were given 0.1 mg/ml of 4‐NQO diluted in 10% propylene glycol in the drinking water ad libitum for 16 weeks. Mice were euthanized 2–4 weeks following treatment, and esophageal epithelial cells were isolated as described below. For the xenograft tumor model, NCR nude mice were purchased (Taconic), and a total of 3 × 10⁶ cells were suspended in 100 μl Matrigel (Corning) and injected subcutaneously into the right and left flanks. Tumor size was measured every 3–5 days, and mice were sacrificed when tumors reach a size greater than 300 mm3 or after 85 days.
Esophageal epithelial cell isolation
Primary esophageal cells were isolated and cultured as previously described (Giroux et al, 2017). Briefly, the epithelium was peeled from the esophagus of p53 WT, null, and mutant mice and dissociated in 0.25% trypsin‐EDTA. Trypsin activity was stopped with soybean trypsin inhibitor, and cells were filtered through a 40 μm strainer. Cells were grown in Keratinocyte serum‐free medium without CaCl2, supplemented with 0.018 mM CaCl2, 50 μg/ml bovine pituitary extract, and 5ng/ml human recombinant EGF. To establish p53+/+, p53 −/− , and p53R172H/ − cell lines, cells were expanded, and epithelial cells were isolated by fluorescence activated cell sorting for YFP. Expression of p53 was confirmed by Western blot.
Cell culture
Mouse epithelial cells were cultured in Keratinocyte serum‐free medium (KSFM) without CaCl2, supplemented with 0.018 mM CaCl2, 50 μg/ml bovine pituitary extract, 5ng/ml human recombinant EGF, and 1% penicillin/streptomycin. Cells were grown at 37°C in a 5% CO2 humidified chamber. For Rab11‐FIP1 knockdown studies, cells were infected with mouse lentiviral shRNAs against Rab11‐FIP1 (Sigma, sequences are listed in Table 1) or non‐targeting control shRNA (Sigma, SHC016). Forty eight hours after infection cells were selected in 2 μg/ml puromycin, and knockdown was confirmed by Western blot. For ZEB1 knockdown assay, TE1 and TE2 cells were transfected with human ZEB1 siRNA (Santa Cruz, sc‐38643) or non‐targeting control siRNA (Santa Cruz, sc‐37007). Cells were collected 72 h post‐transfection for RNA isolation and qPCR.
Table 1.
shRNA sequences for lentiviral depletion
| Species | Gene | TRCN Number | Sequence |
|---|---|---|---|
| Mouse | Rab11‐FIP1 | TRCN0000028301 | CCGGCCGCAGGAAGAAGCAATGGTACTCGAGTACCATTGCTTCTTCCTGCGGTTTTT |
| Mouse | Rab11‐FIP1 | TRCN0000028230 | CCGGCCTGAGAAAGATGCTCTACCTCTCGAGAGGTAGAGCATCTTTCTCAGGTTTTT |
| Human | Rab11‐FIP1 | TRCN0000141878 | CCGGGCAACTGAACCAGGTCAACTTCTCGAGAAGTTGACCTGGTTCAGTTGCTTTTTTG |
| Human | Rab11‐FIP1 | TRCN0000145281 | CCGGGAAATCCAAACCAGGAAAGAACTCGAGTTCTTTCCTGGTTTGGATTTCTTTTTTG |
3D organotypic and 3D organoid culture
Esophageal cells were grown in organotypic culture as previously described (Kalabis et al, 2012). For mouse organotypic cultures, 3T3 cells were used to establish the fibroblast layer. Organoids were generated by suspending 3,000 cells in 50 μl Matrigel in a 24 well dish and were allowed to solidify for 1 h. Following solidification, media (DMEM/F12, 1× Glutamax, 1× HEPES, 1× N2 Supplement, 1× B27 Supplement, 0.1 mM N‐Acetylcysteine, 50 ng/ml recombinant EGF, Noggin/R‐Spondin conditioned media, 10 μM Y27632) were added and replaced every 2 days, and organoids were allowed to grow for 10 days. To harvest, organoids were recovered from Matrigel by pipetting several times until the matrigel was dissolved. Organoids were fixed in 4% PFA for 3 h at 4°C and embedded in 2% Bacto‐Agar:2.5% gelatin.
RNA isolation and qPCR
Total RNA was isolated using RNeasy Mini Kit (Qiagen), and cDNA was synthesized using TaqMan Reverse Transcription Reagents kit (Applied Biosystems) according to the manufacturer’s instructions. qPCR was performed using Power SYBR Green PCR Master Mix (Applied Biosystems) or TaqMan Fast Universal PCR Master mix (Thermo Fisher) using the StepOnePlus Real‐Time PCR System (Applied Biosystems). Primer sequences and reference numbers (TaqMan) are listed in Table 2.
Table 2.
qPCR and TaqMan primers
| qPCR primers | ||
|---|---|---|
| Gene | Forward | Reverse |
| Rab11‐FIP1 | ATGAACACAACAGCCACCAA | CCTTCTTGCTGATGGTCTCC |
| Rab25 | CCACGATTGTTGTCATGCTC | AACAGCAGGCCATTGTTTTC |
| Myo5b | AACGGGTCACAGTGTCCTTC | ATCGAGTCCATGGTCAGAGC |
| CLIC3 | AGTCTACTACCCAAGCTGCA | CTGTCCAAGTAGCGACGAAC |
| Rab5a | TCCTATGCAGATGACAACAGC | TGGTTCATTCTTTGGCAGCT |
| TaqMan primers | |
|---|---|
| Gene | |
| TBP | Hs00427620 |
| CDH1 | Hs00170423 |
| Vim | Hs00958116 |
| Zeb1 | Hs00232783 |
| Snai1 | Hs00195591 |
| Snai2 | Hs00161904 |
| Twist1 | Hs00361186 |
Bulk RNA sequencing
For RNA‐seq studies, RNA was isolated from low passage number cells as described above. Libraries were prepared using Illumina TruSeq Stranded mRNA sample preparation kits from 500 ng of purified total RNA according to the manufacturer’s protocol. Generated dsDNA libraries were quantified by Qubit fluorometer, Agilent TapeStation 2200, and RT–qPCR using the Kapa Biosystems library quantification kit according to manufacturer’s protocols. Uniquely indexed libraries were pooled in equimolar ratios and sequenced on an Illumina NextSeq500 with single‐end 75 bp reads at the Dana‐Farber Cancer Institute Molecular Biology Core Facilities. Sequenced reads were aligned to the UCSC hg19 reference genome assembly, and gene counts were quantified using STAR (v2.5.1b). Differential gene expression testing was performed by DESeq2 (v1.10.1) and normalized read counts (FPKM) were calculated using cufflinks (v2.2.1).
Invasion assay
Corning BioCoat Matrigel Invasion Chambers were used according to manufacturer’s guidelines. Briefly, chambers were rehydrated in DMEM with 10% FBS for 2 h at 37°C. 1 × 10⁵ cells were seeded in the upper chamber in 500 μl serum‐free DMEM, while DMEM with 10% FBS was added to the bottom of the well. Cells were incubated for 28–48 h at 37°C. After incubation, non‐invading cells were removed from the upper surface with a cotton swab, and the remaining cells were fixed in 100% methanol at −20°C for 15 min. Non‐Matrigel coated chambers were used as a control. Membranes were removed from the chambers using a scalpel and mounted in Vectashield mounting media with Dapi (Vector Labs) for imaging. Cell nuclei were counted from five fields of view per cell line and averaged. Invasion was calculated by number of invaded cells per field. For OTC invasion assays, invasion was measured by quantitating the area of invasive regions divided by the total epithelial length.
Immunohistochemistry and immunofluorescence
Immunohistochemistry (IHC) staining was performed as described previously. Briefly, formalin‐fixed, paraffin embedded tissue was sectioned, and antigen retrieval was performed by pressure cooking in citric acid buffer at pH 6. 3% peroxide was used to quench endogenous peroxidases, and sections were blocked with avidin, biotin, and protein blocking buffer (Thermo Fisher) at room temperature. Primary antibodies were incubated at 4°C overnight, and biotinylated antibodies for 30 min at 37°C. Sections were then incubated with ABC reagent (Vector Labs) for 30 min at 37°C, and slides were treated with DAB substrate (Vector Labs) and counterstained with hematoxylin.
For immunofluorescence (IF), cells were grown on cover slips and fixed with 4% PFA for 15 min at room temperature and blocked with blocking solution (PBS, 1% BSA, 0.3% Triton X, 5% serum) for 1 h at room temperature. Cells were then incubated with primary antibodies overnight at 4°C, washed, incubated with secondary antibody for 1 h, and mounted with Vectashield mounting media (Vector Labs). Cells were imaged using a Leica SP8 confocal microscope. Primary antibodies include the following: Rab11‐FIP1 (Cell Signaling, 12849, 1:50 for IHC, 1:200 for IF), p53 (Leica, NCL‐L‐p53‐CM5p, 1:200), p63 (Santa Cruz, sc‐8431, 1:500).
Western blot
Western blot was performed as previously described [33]. Primary antibodies (Rab11‐FIP1 (Cell Signaling, 12849, 1:1,000), p53 (Leica, NCL‐L‐p53‐CM5p, 1:1,000), beta‐actin (Sigma A5316 1:10,000), were incubated overnight at 4°C, and secondary antibodies for 2 h at room temperature. Western blots were imaged using the Odyssey Infrared Imager (LICOR) and analyzed with Image Studio Lite software.
Author contributions
QT, AL, GE, KS, TK, and ALong performed experiments and data analysis. VG assisted with experiments. MI performed RNA‐seq analysis. EPW performed biostatistical analysis. AJK performed histopathology and immunohistochemistry analysis. HN designed experiments. AB reviewed manuscript. AKR designed experiments, performed data analysis and wrote the manuscript. Also, QT, AL, and TK wrote the manuscript.
Conflict of interest
The authors declare that they have no conflict of interest.
Supporting information
Expanded View Figures PDF
Source Data for Expanded View
Review Process File
Source Data for Figure 1
Source Data for Figure 3
Acknowledgements
We thank the Flow Cytometry and Cell Sorting Core at University of Pennsylvania Perelman School of Medicine, and the Molecular Pathology core and Biostatistics Shared Resources at the Herbert Irving Comprehensive Cancer Center (HICCC) of Columbia University Irving Medical Center; and the Molecular Biology Core Facility (MBCF) at the Dana‐Farber Cancer institute (DFCI). This work was funded by NIH grant P01‐CA098101 (AKR), P30‐CA01369645 and the American Cancer Society Research Professorship (AKR).
EMBO reports (2021) 22: e48351.
Data availability
The dataset produced in this study is available in the following database:
RNA‐seq data: Gene Expression Omnibus GSE120353 (https://www.ncbi.nlm.nih.gov/geo/query/acc.cgi?acc=GSE120353)
References
- Amornphimoltham P, Rechache K, Thompson J, Masedunskas A, Leelahavanichkul K, Patel V, Molinolo A, Gutkind JS, Weigert R (2013) Rab25 regulates invasion and metastasis in head and neck cancer. Clin Cancer Res 19: 1375–1388 [DOI] [PMC free article] [PubMed] [Google Scholar]
- Bieging KT, Mello SS, Attardi LD (2014) Unravelling mechanisms of p53‐mediated tumour suppression. Nat Rev Cancer 14: 359–370 [DOI] [PMC free article] [PubMed] [Google Scholar]
- Boulay PL, Mitchell L, Turpin J, Huot‐Marchand JE, Lavoie C, Sanguin‐Gendreau V, Jones L, Mitra S, Livingstone JM, Campbell S et al (2016) Rab11‐FIP1C is a critical negative regulator in ErbB2‐mediated mammary tumor progression. Cancer Res 76: 2662–2674 [DOI] [PMC free article] [PubMed] [Google Scholar]
- Caswell PT, Chan M, Lindsay AJ, McCaffrey MW, Boettiger D, Norman JC (2008) Rab‐coupling protein coordinates recycling of alpha5beta1 integrin and EGFR1 to promote cell migration in 3D microenvironments. J Cell Biol 183: 143–155 [DOI] [PMC free article] [PubMed] [Google Scholar]
- Cheng KW, Lahad JP, Kuo WL, Lapuk A, Yamada K, Auersperg N, Liu J, Smith‐McCune K, Lu KH, Fishman D et al (2004) The RAB25 small GTPase determines aggressiveness of ovarian and breast cancers. Nat Med 10: 1251–1256 [DOI] [PubMed] [Google Scholar]
- Dai Y, Liu Y, Huang D, Yu C, Cai G, Pi L, Ren C, Chen G, Tian Y, Zhang X (2012) Increased expression of Rab coupling protein in squamous cell carcinoma of the head and neck and its clinical significance. Oncol Lett 3: 1231–1236 [DOI] [PMC free article] [PubMed] [Google Scholar]
- Giroux V, Lento AA, Islam M, Pitarresi JR, Kharbanda A, Hamilton KE, Whelan KA, Long A, Rhoades B, Tang Q et al (2017) Long‐lived keratin 15+ esophageal progenitor cells contribute to homeostasis and regeneration. J Clin Invest 127: 2378–2391 [DOI] [PMC free article] [PubMed] [Google Scholar]
- Goldenring JR, Nam KT (2011) Rab25 as a tumour suppressor in colon carcinogenesis. Br J Cancer 104: 33–36 [DOI] [PMC free article] [PubMed] [Google Scholar]
- Goldenring JR (2013) A central role for vesicle trafficking in epithelial neoplasia: intracellular highways to carcinogenesis. Nat Rev Cancer 13: 813–820 [DOI] [PMC free article] [PubMed] [Google Scholar]
- Gundry C, Marco S, Rainero E, Miller B, Dornier E, Mitchell L, Caswell PT, Campbell AD, Hogeweg A, Sansom OJ et al (2017) Phosphorylation of Rab‐coupling protein by LMTK3 controls Rab14‐dependent EphA2 trafficking to promote cell:cell repulsion. Nat Commun 8: 1–15 [DOI] [PMC free article] [PubMed] [Google Scholar]
- Hwang MH, Cho KH, Jeong KJ, Park YY, Kim JM, Yu SL, Park CG, Mills GB, Lee HY (2017) RCP induces Slug expression and cancer cell invasion by stabilizing beta1 integrin. Oncogene 36: 1102–1111 [DOI] [PubMed] [Google Scholar]
- Kalabis J, Wong GS, Vega ME, Natsuizaka M, Robertson ES, Herlyn M, Nakagawa H, Rustgi AK (2012) Isolation and characterization of mouse and human esophageal epithelial cells in 3D organotypic culture. Nat Protoc 7: 235–246 [DOI] [PMC free article] [PubMed] [Google Scholar]
- Lamouille S, Xu J, Derynck R (2014) Molecular mechanisms of epithelial‐mesenchymal transition. Nat Rev Mol Cell Biol 15: 178–196 [DOI] [PMC free article] [PubMed] [Google Scholar]
- Lindsay AJ, McCaffrey MW (2017) Rab coupling protein mediated endosomal recycling of N‐cadherin influences cell motility. Oncotarget 8: 104717–104732 [DOI] [PMC free article] [PubMed] [Google Scholar]
- Long A, Giroux V, Whelan KA, Hamilton KE, Tetreault MP, Tanaka K, Lee JS, Klein‐Szanto AJ, Nakagawa H, Rustgi AK (2015) WNT10A promotes an invasive and self‐renewing phenotype in esophageal squamous cell carcinoma. Carcinogenesis 36: 598–606 [DOI] [PMC free article] [PubMed] [Google Scholar]
- Marino S, Vooijs M, Van Der Gulden H, Jonkers J, Berns A (2000) Induction of medulloblastomas in p53‐null mutant mice by somatic inactivation of Rb in the external granular layer cells of the cerebellum. Genes Dev 14: 994–1004 [PMC free article] [PubMed] [Google Scholar]
- Michaylira CZ, Wong GS, Miller CG, Gutierrez CM, Nakagawa H, Hammond R, Klein‐Szanto AJ, Lee JS, Kim SB, Herlyn M et al (2010) Periostin, a cell adhesion molecule, facilitates invasion in the tumor microenvironment and annotates a novel tumor‐invasive signature in esophageal cancer. Cancer Res 70: 5281–5292 [DOI] [PMC free article] [PubMed] [Google Scholar]
- Mitra S, Federico L, Zhao W, Dennison J, Sarkar TR, Zhang F, Takiar V, Cheng KW, Mani S, Lee JS et al (2016) Rab25 acts as an oncogene in luminal B breast cancer and is causally associated with Snail driven EMT. Oncotarget 7: 40252–40265 [DOI] [PMC free article] [PubMed] [Google Scholar]
- Muller PAJ, Caswell PT, Doyle B, Iwanicki MP, Tan EH, Karim S, Lukashchuk N, Gillespie DA, Ludwig RL, Gosselin P et al (2009) Mutant p53 drives invasion by promoting integrin recycling. Cell 139: 1327–1341 [DOI] [PubMed] [Google Scholar]
- Muller PAJ, Trinidad AG, Timpson P, Morton JP, Zanivan S, Van Den Berghe PVE, Nixon C, Karim SA, Caswell PT, Noll JE et al (2013) Mutant p53 enhances MET trafficking and signalling to drive cell scattering and invasion. Oncogene 32: 1252–1265 [DOI] [PMC free article] [PubMed] [Google Scholar]
- Muller PAJ, Vousden KH (2014) Mutant p53 in cancer: new functions and therapeutic opportunities. Cancer Cell 25: 304–317 [DOI] [PMC free article] [PubMed] [Google Scholar]
- Nakagawa H, Wang TC, Zukerberg L, Odze R, Togawa K, May GHW, Wilson J, Rustgi AK (1997) The targeting of the cyclin D1 oncogene by an Epstein‐Barr virus promoter in transgenic mice causes dysplasia in the tongue, esophagus and forestomach. Oncogene 14: 1185–1190 [DOI] [PubMed] [Google Scholar]
- Nishihira T, Kasai M, Mori S, Watanabe T, Kuriya Y, Suda M, Kitamura M, Hirayama K, Akaishi T (1979) Characteristics of two cell lines (TE‐1 and TE‐2) derived human squamous cell carcinoma of the esophagus. Gan 70: 575–584 [PubMed] [Google Scholar]
- Olive KP, Tuveson DA, Ruhe ZC, Yin B, Willis NA, Bronson RT, Crowley D, Jacks T (2004) Mutant p53 gain of function in two mouse models of Li‐Fraumeni syndrome. Cell 119: 847–860 [DOI] [PubMed] [Google Scholar]
- Pennathur A, Gibson MK, Jobe BA, Luketich JD (2013) Oesophageal carcinoma. Lancet 381: 400–412 [DOI] [PubMed] [Google Scholar]
- Rustgi AK, El‐Serag H (2014) Esophageal carcinoma. N Engl J Med 371: 2499–2509 [DOI] [PubMed] [Google Scholar]
- Song Y, Li L, Ou Y, Gao Z, Li E, Li X, Zhang W, Wang J, Xu L, Zhou Y et al (2014) Identification of genomic alterations in oesophageal squamous cell cancer. Nature 509: 91–95 [DOI] [PubMed] [Google Scholar]
- Srinivas S, Watanabe T, Lin C, Tanabe Y, Costantini F (2001) Cre reporter strains produced by targeted insertion of EYFP and ECFP into the ROSA26 locus. BMC Dev Biol 1: 4 [DOI] [PMC free article] [PubMed] [Google Scholar]
- Stairs DB, Bayne LJ, Rhoades B, Vega ME, Waldron TJ, Kalabis J, Klein‐Szanto AJ, Lee JS, Katz JP, Diehl JA et al (2011) Deletion of p120‐Catenin results in a tumor microenvironment with inflammation and cancer that establishes it as a tumor suppressor gene. Cancer Cell 19: 470–483 [DOI] [PMC free article] [PubMed] [Google Scholar]
- Tang XH, Knudsen B, Bemis D, Tickoo S, Gudas LJ (2004) Oral cavity and esophageal carcinogenesis modeled in carcinogen‐treated mice. Clin Cancer Res 10: 301–313 [DOI] [PubMed] [Google Scholar]
- Tong M, Chan KW, Bao JY, Wong KY, Chen JN, Kwan PS, Tang KH, Fu L, Qin YR, Lok S et al (2012) Rab25 is a tumor suppressor gene with antiangiogenic and anti‐invasive activities in esophageal squamous cell carcinoma. Cancer Res 72: 6024–6035 [DOI] [PubMed] [Google Scholar]
- Zhang J, Liu X, Datta A, Govindarajan K, Tam WL, Han J, George J, Wong C, Ramnarayanan K, Phua TY et al (2009) RCP is a human breast cancer‐promoting gene with Ras‐activating function. J Clin Invest 119: 2171–2183 [DOI] [PMC free article] [PubMed] [Google Scholar]
- Zhang J, Wei J, Lu J, Tong Z, Liao B, Yu B, Zheng F, Huang X, Chen Z, Fang Y et al (2013) Overexpression of Rab25 contributes to metastasis of bladder cancer through induction of epithelial‐mesenchymal transition and activation of Akt/GSK‐3β/snail signaling. Carcinogenesis 34: 2401–2408 [DOI] [PubMed] [Google Scholar]
- Zhang J, Jiang Y, Wu C, Cai S, Wang R, Zhen Y, Chen S, Zhao K, Huang Y, Luketich J et al (2015) Comparison of clinicopathologic features and survival between eastern and western population with esophageal squamous cell carcinoma. J Thorac Dis 7: 1780–1786 [DOI] [PMC free article] [PubMed] [Google Scholar]
Associated Data
This section collects any data citations, data availability statements, or supplementary materials included in this article.
Supplementary Materials
Expanded View Figures PDF
Source Data for Expanded View
Review Process File
Source Data for Figure 1
Source Data for Figure 3
Data Availability Statement
The dataset produced in this study is available in the following database:
RNA‐seq data: Gene Expression Omnibus GSE120353 (https://www.ncbi.nlm.nih.gov/geo/query/acc.cgi?acc=GSE120353)


