

We studied MET alterations in 474 advanced non‐small‐cell lung cancer (NSCLC) patients by nCounter, an RNA‐based technique. We identified 3% with METΔex14 mRNA and 3.5% with very‐high MET mRNA expression, a surrogate of MET amplification. MET alterations identified by nCounter correlated with clinical benefit from MET inhibitors. Quantitative mRNA‐based techniques can improve the selection of patients for MET‐targeted therapies.
Keywords: amplification, expression, lung cancer, MET, RNA, skipping
Abstract
MET inhibitors have shown activity in non‐small‐cell lung cancer patients (NSCLC) with MET amplification and exon 14 skipping (METΔex14). However, patient stratification is imperfect, and thus, response rates have varied widely. Here, we studied MET alterations in 474 advanced NSCLC patients by nCounter, an RNA‐based technique, together with next‐generation sequencing (NGS), fluorescence in situ hybridization (FISH), immunohistochemistry (IHC), and reverse transcriptase polymerase chain reaction (RT–PCR), exploring correlation with clinical benefit. Of the 474 samples analyzed, 422 (89%) yielded valid results by nCounter, which identified 13 patients (3%) with METΔex14 and 15 patients (3.5%) with very‐high MET mRNA expression. These two subgroups were mutually exclusive, displayed distinct phenotypes and did not generally coexist with other drivers. For METΔex14, 3/8 (37.5%) samples positive by nCounter tested negative by NGS. Regarding patients with very‐high MET mRNA, 92% had MET amplification by FISH and/or NGS. However, FISH failed to identify three patients (30%) with very‐high MET RNA expression, among which one received MET tyrosine kinase inhibitor treatment deriving clinical benefit. Our results indicate that quantitative mRNA‐based techniques can improve the selection of patients for MET‐targeted therapies.
Abbreviations
- FISH
fluorescence in situ hybridization
- HS
histoscore
- IHC
immunohistochemistry
- nC
nCounter
- NGS
next‐generation sequencing
- NSCLC
non‐small‐cell lung cancer
- RT–PCR
reverse transcription polymerase chain reaction
1. Introduction
Aberrant activation of the mesenchymal–epithelial transition (MET) gene has recently emerged as an actionable target, particularly in non‐small‐cell lung cancer (NSCLC) [1, 2]. Multiple molecular mechanisms including amplification, point mutations, alternative splicing, and protein overexpression [3, 4] can lead to abnormal MET activation, which increases cell proliferation, survival, invasion, and metastasis. MET amplification has been described in 1–6% of newly diagnosed NSCLC tumors and constitutes a frequent mechanism of acquired resistance in EGFR‐mutant (EGFR‐mut) NSCLC patients treated with tyrosine kinase inhibitors (TKI) [5]. MET exon 14 alterations in donor and acceptor splicing sites—including point mutations, indels, and whole‐exon deletions—lead to the exclusion (skipping) of MET exon 14 at the RNA level (MET∆ex14), which has been described in 3–4% of patients with advanced NSCLC [6, 7, 8].
Amplification of the MET gene in NSCLC and mutations leading to MET∆ex14 were first reported in 2005 and 2006, respectively [9, 10], while two seminal works published in 2015 identified MET∆ex14 as a potential therapeutic target in advanced NSCLC [11, 12]. Since then, several trials have evaluated the efficacy of MET inhibitors in patients with MET∆ex14 and MET amplification [13, 14, 15, 16, 17], with response rates varying widely across the different studies. Capmatinib is the first MET inhibitor that has gained recent Food and Drug Administration approval for the treatment of advanced NSCLC with MET∆ex14 [18], and novel mechanisms of resistance have meanwhile started to emerge [19].
The most frequent technologies used to assess MET gene copy number variations in the clinical setting are fluorescence in situ hybridization (FISH) and next‐generation sequencing (NGS), whereas for MET∆ex14 detection, both NGS and reverse transcription polymerase chain reaction (RT–PCR) are commonly used [6, 7, 13, 14, 20, 21, 22, 23, 24]. However, the optimal method(s) and the more adequate thresholds for stratification are not yet defined. The controversies around MET testing [25] have been complicated by the small number of comprehensive studies on MET status in advanced NSCLC and the fact that most reports evaluating the performance of different techniques have focused on a single MET alteration.
The NanoString nCounter™ Analysis System is a high‐throughput, quantitative transcript‐based hybridization technology that allows for the simultaneous analysis of the expression of hundreds of target genes [26] and can be easily incorporated in the routine molecular testing workflow of tumor samples [27]. Although nCounter has been used to determine some MET alterations in particular types of tumors [28, 29, 30], it has never been employed for MET testing in NSCLC. In the previous studies, we demonstrated that this methodology can identify relevant gene rearrangements in advanced NSCLC [27, 31]. Here, we aimed to determine whether nCounter could improve the characterization of clinically relevant MET alterations. To this end, we screened a large cohort of NSCLC patients and compared the nCounter results with those obtained by standard techniques. Our results indicate that multiplex, RNA‐based techniques such as nCounter have the potential to become the technology of choice to select patients for MET‐targeted therapies.
2. Materials and methods
2.1. Patients, samples, and cell lines
A total of 474 formalin‐fixed, paraffin‐embedded (FFPE) tumor samples from patients with NSCLC were tested to identify MET alterations. Samples were collected from 10 participating hospitals (Supporting Information) with prior full informed patient consent and approval from the corresponding ethical committees. All advanced NSCLC patients arriving to our institutions and having biopsies available with sufficient tumor tissue were offered to participate in the study, which was conducted in accordance with the principles of the Declaration of Helsinki. FFPE slides (4 µm) were obtained by standard procedures and stained with hematoxylin and eosin. A pathologist determined the tumor area and evaluated the percentage of tumor infiltration. RNA was extracted with a high purity FFPE RNA isolation kit (Roche, Mannheim, Germany), while the GeneRead DNA FFPE Kit or the QIAamp DNA FFPE Tissue Kit (Qiagen, Hilden, Germany) was used for DNA extraction from FFPE samples, according to the manufacturer’s instructions. DNA and RNA concentrations were measured by Qubit (Thermo Fisher Scientific, Waltham, MA, USA). Three cell lines (Hs746T, PC9, and E98) were used for validation purposes. The Hs746T cell line, harboring METΔex14, was purchased from the American Type Culture Collection. E98 is a patient‐derived astrocytoma cell line with amplification of MET gene. EGFR‐mut PC9 cells were obtained from F. Hoffman‐La Roche Ltd (Basel, Switzerland) with the authorization of Dr. Mayumi Ono (Kyushu University, Fukuoka, Japan). All cell lines were cultured in RPMI medium with 10% fetal bovine serum under standard conditions and counted after trypsinization. Pellets from a minimum of five T‐75 flasks were used to generate FFPE blocks.
2.2. FISH and immunohistochemistry (IHC)
FISH for MET was performed with the ZytoLight® SPEC MET/centromere 7 (MET/CEP7) Dual Color Probe (ZytoVision, Bremerhaven, Germany) according to manufacturer’s instructions. Three positivity criteria for MET amplification were used as follows: (a) a ratio (r) MET/CEP7 ≥ 2; (b) gene copy number (GCN) per cell ≥ 6; (c) ≥ 5 copies in ≥ 50% of cells; (d) or ≥ 15 copies in > 10% tumor cells. These three criteria have been employed for patient stratification in clinical trials of anti‐MET therapies (Table S1). Immunostaining was performed with MET SP44 clone (Roche) on a BenchMark ULTRA automated tissue staining system (Ventana Medical Systems, Tucson, AZ, USA). Two different cutoff points for IHC positivity were considered: (i) membrane intense staining (3+) in ≥ 50% of the tumor cells and (ii) histoscore (HS) ≥ 220.
2.3. NGS sample preparation, sequencing run, and data processing
DNA NGS was performed with the GeneRead® QIAact Lung DNA UMI Panel (Qiagen) or OncomineTM Solid Tumour (OST) DNA Panel (Thermo Fisher Scientific), according to the manufacturer’s instructions (Table S2). Both panels target genes frequently altered in lung cancer, including DNA alterations at exons 13–15 of MET and the surrounding intronic regions. The GeneRead panel can also detect amplifications in five genes. For the GeneRead panel, up to 40 ng of purified DNA was used as a template. Clonal amplification was performed on 625 pg of pooled libraries, and, following bead enrichment, the GeneReader instrument was used for sequencing.
RNA‐NGS was performed with the GeneRead® QIAact Lung RNA Fusion UMI Panel (Qiagen) according to the manufacturer’s instructions. This panel targets a fusion‐specific and splicing variants (Table S2), including METΔex14. The GeneRead® QIAact Lung RNA Fusion UMI Panel is designed to enrich selected fusion targets starting with 100 ng of total RNA. After target enrichment and library preparation, clonal amplification was performed using 625 pg of pooled libraries, and, following bead enrichment, the GeneReader instrument was used for sequencing.
Qiagen Clinical Insight Analyze (qci‐a) software was employed to align the read data and call sequence variants, which were imported into the Qiagen Clinical Insight Interpret (QCI‐I) web interface for data interpretation and generation of final custom report. In the case of the OST panel, 10 ng of purified DNA was used as a template. Libraries were pooled at 20 pM and, following ion spheres, sequenced using the Ion Personal Genome Machine (Thermo Fisher Scientific). The Ion Reporter Server (Thermo Fisher Scientific) was used to align the read data to the human reference genome and call sequence variants. The MET gene copy numbers by NGS were assessed using the QCI‐A and QCI‐I software. Copy numbers provided by QCI‐I were selected according to the tumor infiltration of the sample, as assessed by an expert pathologist. The GCN ≥ 6 was chosen as a threshold based on the previous experience of our laboratory. During the validation of the NGS panel prior to its implementation in the clinical setting, this threshold had been found to show the highest correlation with FISH MET/CEP7 > 2.
2.4. RT–PCR analysis for METΔex14 transcripts
RNA was converted to cDNA using M‐MLV retrotranscriptase (Thermo Fisher Scientific) and oligo‐dT primers, and METΔex14 was amplified using HotStart Taq polymerase (Qiagen) in a 20 µL reaction and visualized in agarose gels. Primers used were located in exons 13 and 15, sequences were as follows: forward (exon 13) 5′‐TTTTCCTGTGGCTGAAAAAGA‐3′ and reverse (exon 15) 5′‐GGGGACATGTCTGTCAGAGG‐3′. Amplification generated a 246‐bp band for wild‐type (wt) MET RNA and a 106‐bp band for METΔex14. Positive samples were confirmed by bidirectional Sanger sequencing of RT–PCR products, using the big‐dye 3.1 sequencing kit (Applied Biosystems, Waltham, MA, USA).
2.5. nCounter analysis
Total RNA was hybridized with a custom‐designed mixture of biotinylated capture tags and fluorescently labeled reporter probes (Elements Chemistry) that included, among others, probes for MET‐wt and METΔex14 target sequences. Detailed sequence information for the MET gene target regions is provided in Table S3. The codeset also included probes for housekeeping genes (actin beta, ACTB; proteasome 26S subunit ATPase 4, PSMC4 and mitochondrial ribosomal protein L19, MRPL19), positive and negative controls. All processes of hybridization, capture, cleanup, and digital data acquisition were performed with nCounter Prep Station® and Digital Analyzer® (NanoString Technologies, Seatle, WA, USA) according to the manufacturer’s instructions. Reporter counts were collected with the nsolver analysis software version 2.6. Samples were considered not evaluable if the geometrical mean (geomean) of counts corresponding to the housekeeping genes was lower than 100. Counts from MET probes were normalized in two steps, as described [31], and subjected to a logarithmic transformation to obtain the so‐called log‐MET expression values. Two cutoff values were used for log‐MET results; (a) the mean plus standard deviation (SD) was used to define cases with moderately (mod.)‐elevated MET mRNA, (b) the mean plus two SD for very‐high MET mRNA levels. Regarding METΔex14 testing, log‐ratios were obtained dividing the normalized counts of the METΔex14 probe by the normalized counts for the MET‐wt probe. The cutoff for METΔex14 positivity was established as the average log‐ratio of the sample cohort plus 2 SD. Samples with no counts for the METΔex14 probe were directly considered negative.
2.6. Validation of nCounter for detection of MET alterations
Using frozen pellets from Hs746T or E98 cells, we found that 5000 cells and 25 ng of RNA were sufficient for successful detection of spliced transcripts or very‐high MET mRNA levels, respectively. In contrast, pellets containing 500 000 of PC9 cells (MET‐wt) tested negative. Next, using FFPE blocks prepared by spiking different numbers of MET‐dependent cells (Hs746T and E98) in a suspension of PC9 cells, we established that 1 mm2 of a 4‐µm section with a minimum of 10% of Hs746T cells was required for METΔex14 detection, whereas 30% of E98 cells were needed to detect high levels of MET mRNA expression by nCounter. In similar experiments, RT–PCR detected METΔex14 mRNA in mixtures with 0.1% mutant tumor cells. Finally, we performed repeatability studies using FFPE tumors from advanced NSCLC patients. In the case of METΔex14 detection by nCounter, four positive and 20 negative samples were analyzed in two independent experiments showing a 100% concordance. Regarding MET mRNA expression, 29 samples run in two independent experiments revealed concordant results in the classification for 28 of them (96.6%, CI = 82.8–99.4).
3. Results
3.1. Clinical samples
A total of 474 FFPE NSCLC tumor samples were profiled using nCounter. Among them, 52 (11%) had geomean of housekeeping gene counts below 100 and were excluded from the study. The remaining 422 evaluable samples, corresponding to 405 patients, were mostly stage IIIB/IV adenocarcinomas (Table S4, Table 1). Four additional techniques were used in different subsets of samples to validate the MET status determined by nCounter. Copy number alterations were analyzed by FISH and/or NGS, METΔex14 transcripts by RT–PCR or DNA‐based NGS, and protein expression by IHC (Fig. 1).
Table 1.
Characteristics of all patients with valid results, patients positive for METΔex14 by nCounter, and patients with very‐high and moderately elevated MET mRNA levels, also by nCounter, N (%).
| Characteristics |
All patients N = 405 |
METΔex14 N = 13 |
MET mRNA very‐high N = 15 |
MET mRNA mod‐elevated N = 36 |
|---|---|---|---|---|
| Gender | ||||
| Male | 248 (61.2) | 4 (30.8) | 10 (66.7) | 19 (52.8) |
| Female | 146 (36.1) | 9 (69.2) | 5 (33.3) | 16 (44.4) |
| Unknown | 11 (2.7) | 0 (0) | 0 (0) | 1 (2.8) |
| Age at diagnosis | ||||
| Median | 63 | 70 | 58 | 64 |
| Range | 31–89 | 57–84 | 55–61 | 31–84 |
| Smoking status | ||||
| Never | 77 (19.0) | 5 (38.5) | 1 (6.7) | 15 (41.7) |
| Former | 134 (33.1) | 2 (15.4) | 6 (40.0) | 7 (19.4) |
| Current | 115 (28.4) | 0 (0) | 6 (40.0) | 9 (25.0) |
| Unknown | 79 (19.5) | 6 (46.1) | 2 (13.3) | 5 (13.9) |
| Sample collection time | ||||
| No data | 62 (15.3) | 3 (23.1) | 2 (13.3) | 4 (11.1) |
| Baseline | 294 (72.6) | 10 (76.9) | 9 (60.0) | 27 (75.0) |
| Baseline and progression | 7 (1.7) | 0 | 0 | 0 |
| Progression only | 42 (10.4) | 0 | 4 (27.8) | 5 (13.9) |
Fig. 1.
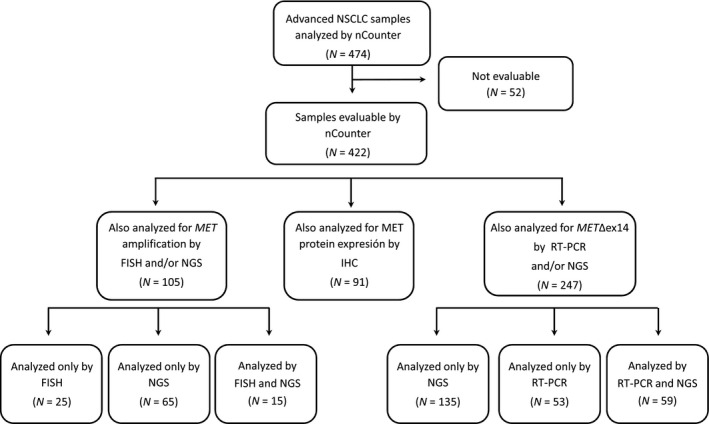
Flowchart of the study. FISH, fluorescence in situ hybridization; IHC, immunohistochemistry; NGS, next‐generation sequencing; NSCLC, non‐small‐cell lung cancer; RT–PCR, reverse transcription polymerase chain reaction.
3.2. Detection of MET∆ex14 mRNA by nCounter in clinical samples
For each of the 422 samples evaluable, we calculated the log‐ratio of the normalized nCounter counts corresponding to the METΔex14 vs. the MET‐wt probes. A sample was considered positive if the log‐ratio was above a threshold value, established as the mean plus two times the SD of all samples analyzed (Fig. 2A). The METΔex14/ MET‐wt log‐ratios in our cohort showed a bimodal distribution with the cutoff value separating the two populations (Fig. 2B). A total of 13 METΔex14‐positive patients (3%) were identified, with a majority of nonsmoking females and a median age of 70 years (Table 1). Of them, five were treated with MET‐TKIs and showed partial responses (N = 4) or stabilization of the disease (N = 1) by RECIST criteria (Fig. 2C).
Fig. 2.
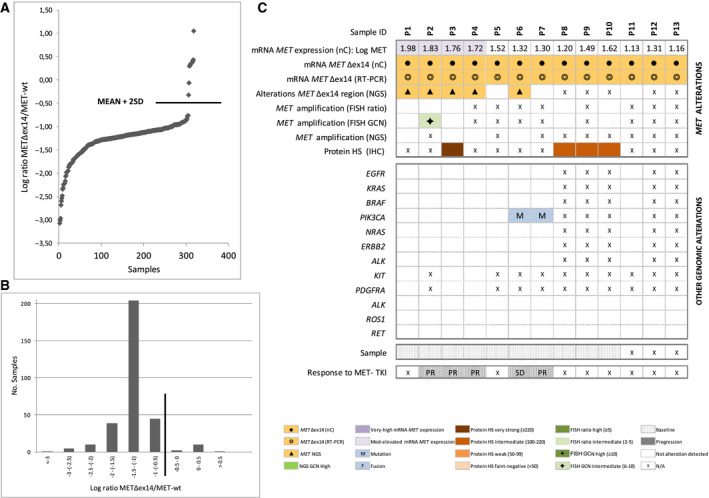
Detection of METΔex14 by nCounter. (A) METΔex14/MET‐wt normalized counts obtained by nCounter, expressed as log‐ratios. Only samples with detectable counts for METΔex14 are plotted. The line indicates the cutoff for positivity (mean + 2SD). (B) Plot showing the bimodal distribution of METΔex14/MET‐wt nCounter log‐ratios in the cohort. The line indicates the cutoff for positivity (mean + 2SD). (C) Heatmap displaying METΔex14‐positive samples by nCounter (N = 13) and correlative results for RT–PCR, mRNA expression (nC), MET mutations (NGS), copy number alterations (FISH or NGS), immunohistochemistry (IHC), and other co‐occurring driver alterations. Patient numbers are shown in the top row. FISH, fluorescence in situ hybridization; HS, histoscore; IHC, immunohistochemistry; Mod, moderately; N/A nonavailable data; nC, nCounter; NGS, next‐generation sequencing; PR, partial response; RT–PCR, reverse transcription polymerase chain reaction; SD, stable disease. [Correction added on 9 December 2020, after first online publication: Missing details in the figure were amended.]
Eight of the 13 METΔex14‐positive cases could be submitted to DNA‐based NGS. Mutations affecting exon 14 splicing sites were detected in five of them (62.5%), mainly deletions in the acceptor splice‐site region (Table S5). Regarding other alterations, two patients showed PIK3CA mutations while concomitant MET amplification by GCN (6–10) was identified in only one sample (20%). However, this case was negative (< 2) by MET/CEP7 ratio. Sufficient tissue to perform MET IHC was available for four of the 13 patients; MET staining was intermediate in three cases and strong in one (Fig. 2C).
3.3. Quantification of MET mRNA expression levels by nCounter in clinical samples
The raw counts of the MET probes for each sample were transformed into logarithmic normalized data (log‐MET). According to our classification algorithm (see Section 2), 15/422 samples (3.5%) presented very‐high MET mRNA levels (Fig. 3) and 36/422 samples (8.5%) mod‐elevated MET mRNA levels by nCounter (Fig. 4). In contrast to the log‐ratio, the distribution of the log‐MET values was unimodal, although a Kolmogorov–Smirnov test revealed a significant deviation from normality (P = 0.001; Fig. 3A,B). Most of the 15 patients with very‐high MET mRNA levels were males, former or current smokers with a median age of 58 years (Table 1). They invariably showed very strong IHC staining (≥ 220), tested negative for METΔex14 by nCounter and 92% (11/12) had MET amplification by FISH or NGS (Fig. 3C). Finally, among the 9 baseline patients with very‐high MET, no other driver was detected in seven (77.8%). Five patients with very‐high MET mRNA were treated with MET‐TKIs, all of them showed partial responses by RECIST criteria. Interestingly, one was negative by FISH (Fig. 3C).
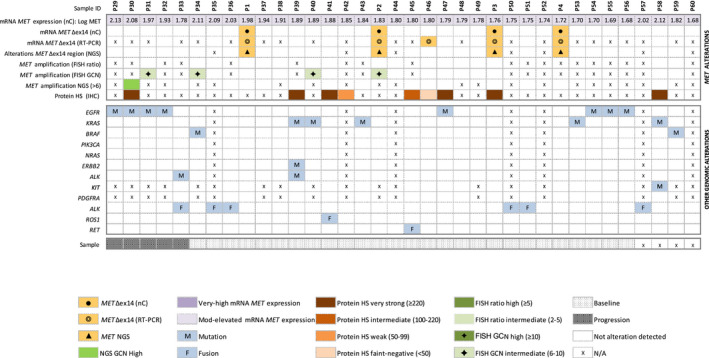
Fig. 3.
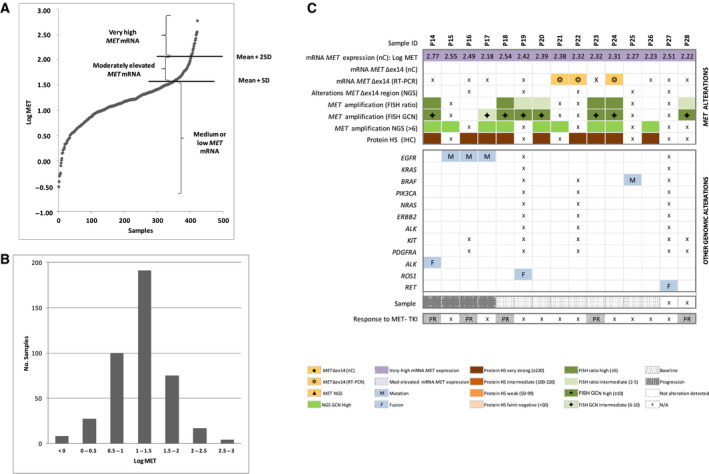
Quantification of MET mRNA expression levels by nCounter. (A) MET normalized counts obtained by nCounter, expressed as log‐MET. The cutoff values for moderately elevated MET mRNA expression (mean + SD) and very‐high MET mRNA expression (mean + 2SD) are indicated with lines. (B) Plot showing the unimodal distribution of log‐MET in the sample cohort. (C) Heatmap displaying samples with very‐high levels of MET mRNA expression by nCounter (N = 15) and corresponding results for METΔex14 (nC), RT–PCR, MET mutations (NGS), copy number alterations (FISH or NGS), immunohistochemistry (IHC), and other co‐occurring driver alterations. Patient numbers are shown in the top row. FISH, fluorescence in situ hybridization; GCN, gene copy number; HS, histoscore; IHC, immunohistochemistry; Mod, moderately; N/A nonavailable data; nC, nCounter; NGS, next‐generation sequencing; PR, partial response; RT–PCR, reverse transcription polymerase chain reaction; SD, stable disease
Fig. 4.
Heatmap displaying samples with mod‐elevated levels of MET mRNA expression by nCounter (n = 36). Corresponding results for METΔex14 (nC) RT–PCR, MET mutations (NGS), copy number alterations (FISH or NGS), immunohistochemistry (IHC), and other co‐occurring driver alterations are also shown. Patient numbers are shown in the top row. FISH, fluorescence in situ hybridization; GCN, gene copy number; HS, histoscore; IHC, immunohistochemistry; Mod, moderate; N/A nonavailable data; nC, nCounter; NGS, next‐generation sequencing; RT–PCR, reverse transcription polymerase chain reaction.
Regarding the 36 cases with mod‐elevated MET mRNA levels, we found comparable numbers of males and females, smokers, and never smokers with median age of 64 years (Table 1). The majority (19/27) of baseline samples with mod‐elevated MET and genotyping data available harbored concurrent genetic alterations, being mutations in KRAS proto‐oncogene GTPase (KRAS) and epidermal growth factor receptor (EGFR), fusions in ALK receptor tyrosine kinase (ALK), and METΔex14 the most prevalent (N = 4 each; Fig. 4).
3.4. Comparison of METΔex14 nCounter results with RT–PCR and DNA‐based NGS in clinical samples
The concordance of nCounter with RT–PCR and DNA‐based NGS for the detection of METΔex14 is shown in Table S6, together with the corresponding values of specificity, sensitivity, and Cohen’s kappa. We observed a substantial agreement when comparing nCounter vs. DNA‐based NGS, with a 98.5% concordance rate (CI = 95.6–99.5, Cohen’s kappa 0.76) and only three discordant samples, all of them positive by nCounter and negative by DNA‐based NGS. Regarding nCounter and RT–PCR, there was a fair agreement (90.2%, CI = 83.3–94.4, Cohen’s kappa 0.65) and all the discordant cases (N = 11) were negative by nCounter and positive by RT–PCR. Six of those discordant samples had been analyzed by DNA‐based NGS; mutations associated with METΔex14 were not detected in any case (Fig. S1). Five of them with remaining material were further investigated by an orthogonal RNA‐based NGS and all tested negative for METΔex14 skipping transcripts. Finally, we systematically sequenced the 106 bp cDNA band, corresponding to the METΔex14 mRNA, obtained in RT–PCR‐positive samples. No differences were observed between concordant and discordant samples, being the base sequence of the exon 13–exon 15 junction identical in all cases to the sequence described in the literature [9].
3.5. Comparison of MET expression levels by nCounter with MET amplification by FISH and NGS in clinical samples
A total of 40 samples had evaluable data by FISH and nCounter. Three different criteria for MET positivity were used for FISH evaluation (see Section 2). A moderate to substantial agreement was observed if the nCounter very‐high cutoff was employed, with the highest agreement for the FISH ratio MET/CEP7 ≥ 2 (concordance rate 92.5%, Cohen’s kappa 0.778; Table S7). The only three discordant samples were positive by nCounter and negative by FISH. Two of them had remaining material available and were submitted to RNA‐based NGS, testing negative for known MET gene fusions. If the nCounter mod‐elevated cutoff was selected, the agreement was only fair with any of the three FISH amplification criteria, with concordance rates of 50%‐70% and Cohen’s kappa 0.185–0.410 (Table S8).
DNA‐based NGS with the GeneRead platform, which can detect amplifications in several genes, was performed in 80 samples with nCounter data. MET amplification by DNA‐based NGS showed an almost perfect agreement with very‐high MET mRNA levels, with a Cohen’s kappa of 0.886 and a 97.5% concordance rate (Table S7). The only two discordant samples were MET amplified by NGS but did not show very‐high MET mRNA expression levels by nCounter. In contrast, if mod‐elevated MET mRNA levels were employed, the agreement with MET amplification by NGS was significantly worse (Cohen’s kappa 0.494) and the 14 discordant cases had moderately elevated MET mRNA but did not show copy number gains (Table S8).
3.6. Comparison of MET expression levels by nCounter and IHC in clinical samples
Ninety‐one samples were used to perform a comparative study of IHC vs. nCounter for the quantification of MET expression levels. Among these 91 samples, 34 showed very strong MET by IHC (HS ≥ 220), 19 intermediate (HS 100–220), 21 weak (HS 50–99), and 17 were very weak‐negative (HS < 50). In general, a fair agreement was observed between IHC and nCounter expression levels, with IHC positivity observed among cases with both mod‐elevated and very‐high mRNA levels (Tables S7 and S8).
3.7. Expression levels of MET mRNA in clinical samples with driver alterations
Finally, we compared MET mRNA levels by nCounter in patients harboring different drivers (Fig. S2). Baseline MET expression by nCounter was found to be significantly increased in samples with MET amplification, METΔex14, and BRAF mutations (P < 0.05 in a Mann–Whitney U test), but not in cases with EGFR and KRAS mutations or ALK rearrangements. Next, we compared MET mRNA expression in samples at baseline vs. progression. Overall, there were no significant differences in log‐MET values between the 306 basal and the 52 progression samples included in the study. When classified by drivers, we did observe a significant increase in MET mRNA levels in tumors at progression vs. baseline only in EGFR‐mutant samples. However, a subpopulation of samples at progression with high MET mRNA expression was apparent not only in EGFR mutant, but also in ALK‐positive rebiopsies.
4. Discussion
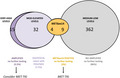
In this study, we comprehensively characterized the biologically relevant MET alterations—amplification and exon 14 skipping—in a large cohort of 474 NSCLC samples using of a RNA‐based technology (nCounter; Fig. 5) and we systematically compared the results with other currently available methods for MET testing. We also propose an algorithm for the selection of patients to be considered for MET‐TKI treatment, based on the RNA‐based results.
Fig. 5.
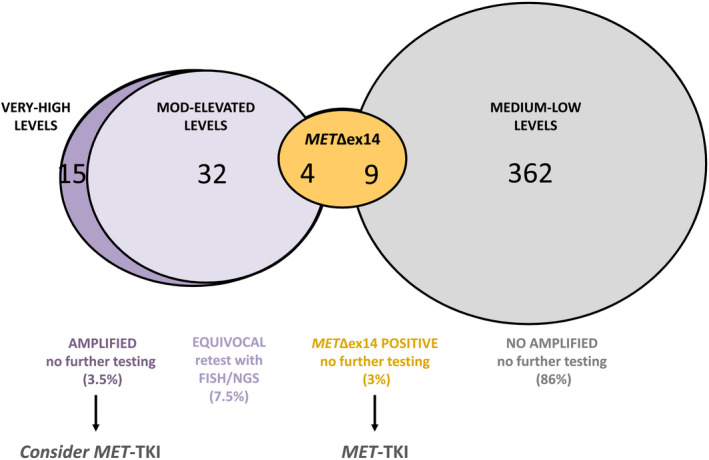
Graphical summary of the results obtained with nCounter. The numbers and percentages of evaluable samples with different MET mRNA expression are represented (N = 422). FISH, fluorescence in situ hybridization; MET∆ex14, MET exon 14 skipping mutation; Mod, moderately; TKI, tyrosine kinase inhibitor.
Our prevalence of METΔex14 by nCounter (3%) is in line with the literature [6, 7], particularly when other RNA‐based techniques such as RNA sequencing or quantitative RT–PCR were used [32, 33]. In our series, all cases positive for METΔex14 transcripts by nCounter (N = 13) were also detected by RT–PCR; however, a large subset of samples positive by RT–PCR (N = 11) tested negative by nCounter. Five of these discordant samples could be submitted to an orthogonal RNA‐based NGS, which confirmed them as negative. In addition, most of them were found to harbor known drivers, particularly KRAS. Although RT–PCR is used in some laboratories to identify MET∆ex14 transcripts, these results suggest that it might not be the most adequate technique for this purpose. Low level of METΔex14 transcripts can emerge by splicing ‘mistakes’ in the cell without translating in any genomic alteration with oncogenic relevance [34, 35, 36]. These splicing ‘mistakes’ would test positive by mRNA amplification (RT–PCR), but not by nCounter, DNA‐, or RNA‐based NGS.
DNA‐based NGS using commercially available panels is also employed to determine MET∆ex14. However, this technique has been reported to detect only 63% of literature‐described splicing mutations associated with METΔex14 [37], and reanalysis of 232 pan‐negative samples by DNA‐based NGS using RNA sequencing revealed six (2.5%) METΔex14‐positive cases previously missed [33]. In our cohort, among the eight tumors with METΔex14 by nCounter that were submitted to DNA‐based NGS, three (37.5%) tested negative for mutations associated with METΔex14 splicing sites. One of these discordant patients was treated with a MET‐TKI and derived clinical benefit (Patient 7, Fig. 2C). It is probable that at least some of these cases involved large genomic deletions that are difficult to detect on DNA‐based NGS assays [32]. Therefore, our results confirm that DNA‐based techniques might underestimate the detection of METΔex14 alterations.
Consistent with other studies [6, 7, 13, 14, 15, 38], most of the MET ∆ex14 patients detected by nCounter were elderly females, with a considerable proportion of never smokers (38%; Table 1). In addition, as previously reported, MET∆ex14 rarely coexisted with other drivers and was associated with moderate but not high MET expression by IHC [6, 38]. Finally, we only detected MET amplification by FISH or NGS in one (14%) of the MET∆ex14‐positive cases, compared to the 8–30% reported in the literature using different detection techniques and thresholds [6, 7, 13, 15, 17]. The significance of MET amplification in the context of MET∆ex14 alterations is unclear, but recent data from a prospective trial [15, 16, 17] indicate that it does affect response to MET‐TKIs, endorsing MET∆ex14 as a truly separate driver in NSCLC. Indeed, all MET∆ex14 patients in our cohort treated with MET‐TKIs derived clinical benefit, regardless of MET amplification status (Patients 2, 3, 4, 6, 7; Fig. 2C).
In addition to the presence of MET∆ex14 transcripts, we analyzed wt MET mRNA and could identify different clusters of patients according to MET expression levels. The group with very‐high MET mRNA (3.5%) comprised a majority of males, former, or current smokers with a median age of 58 years. Interestingly, very‐high MET mRNA expression closely correlated with MET gene amplification by NGS or FISH and was mutually exclusive with METΔex14. Therefore, it is not surprising that the phenotype of the patients with very‐high MET mRNA agrees with the characteristics previously reported in patients with high MET amplification (defined as FISH gene copy number, GCN ≥ 6 or ≥ 10) [16, 17, 39, 40]. Furthermore, all the five very‐high MET mRNA cases treated with MET inhibitors achieved partial responses; the majority of case baseline (7/9) did not harbor any detectable driver. In contrast, the cohort of patients with mod‐elevated MET mRNA expression did not correlate with any specific phenotype, being distributed independently of gender and smoking habits, and known drivers were detected in most cases. Although the biological oncogenic significance of MET amplification in NSCLC has been controversial [3, 41], our results endorse the concept of MET being a true driver in patients with very‐high expression mRNA levels. In contrast, we believe that MET is unlikely to play a clinically relevant role in tumors with mod‐elevated expression levels.
Several trials have recently evaluated the efficacy of MET‐TKIs in MET∆ex14‐positive NSCLC. Overall response rates of 32% have been reported for crizotinib, a nonselective inhibitor, compared to 46–68% and 40–55% in first or subsequent lines for the selective inhibitors capmatinib, tepotinib, and savolitinib [11, 13, 14]. In contrast, the results obtained so far in trials enrolling MET‐amplified patients are significantly worse, with overall response rate (ORR) 20–47% [16, 17, 20, 39, 40, 42]. It is unclear whether the variety of responses observed in trials of MET‐TKIs may partly underlie a heterogeneous disease population with distinct sensitivities to MET‐TKIs and/or be a consequence of the different thresholds, methodologies, and scoring systems (MET/CEP7 ratios or GCN) that have been used as eligibility criteria.
Our study can shed some light on this relevant issue, and the characterization of MET expression levels in NSCLC here presented provides a unique opportunity to advance in the understanding of the processes underlying MET biology. For instance, our RNA‐based assessment allowed the identification of amplification‐negative tumors with very‐high MET expression levels and also the relatively infrequent cases with gene amplification that did not express MET mRNA. Remarkably, one of the patients with very‐high MET mRNA levels but negative by FISH (using the two usual cutoff values) was treated with a MET inhibitor achieving a partial response. These observations suggest that FISH positivity might be capturing a heterogeneous group regarding dependence on aberrant MET signaling and that RNA‐based techniques could improve the performance of FISH for patient selection. This, in turn, may help to explain the inferior response rates observed with MET‐TKIs in FISH‐amplified tumors. In order to improve outcomes to MET inhibition in this setting, it would be important to further investigate the efficacy of MET‐TKI in those tumors with gene amplification that do not express MET mRNA, and the real clinical value of high expression levels in amplification‐negative tumors where MET inhibition therapy could be considered.
Regarding METΔex14, recent studies have suggested that MET protein expression is required for clinical benefit from MET‐TKIs [43]. Interestingly, the only METΔex14 patient in our cohort who exhibited stable disease to MET‐targeted therapy had low levels of mRNA by nCounter, whereas all treated patients with mod‐elevated levels had partial responses. Whether mRNA expression levels can assist to predict outcome in patients with METΔex14 is currently unknown but also merits further investigation. One of the limitations of our study derives from the fact that MET is known to be expressed not only in tumor cells but also in normal epithelial [44], dendritic, and other immune cells [45]. In consequence, particularly in cases with important stroma and/or inflammatory component, the mRNA expression levels obtained by nCounter might reflect the level of MET expression in the whole tumor rather than only in cancer cells. However, the good agreement observed between MET mRNA levels by nCounter and MET IHC staining in tumor cells indicated that, in most samples, the contribution of noncancer components to the nCounter results was not significant.
5. Conclusions
We have comprehensively characterized MET in a large cohort of advanced NSCLC and have validated the use of nCounter to identify METΔex14 in this malignancy. Our work also provides useful insights into the biology of MET as a driver in NSCLC, supporting MET very‐high mRNA expression as a surrogate of amplification, and suggesting the relevance of MET mRNA levels in patients responding to MET‐TKIs. Our results support the use of mRNA‐based techniques for multiplex, accurate, and reliable assessment of MET alterations in order to select patients for MET‐targeted therapies.
Conflict of interest
CT has received fees for consultancy/advisory roles from Pfizer, Novartis, MSD, Roche, AstraZeneca, and Takeda, and research funding from Pfizer and Novartis. CC has received travel grants from MSD, Pierre‐Fabre Oncology, fees for consultancy/advisory from Boehringer Ingelheim, Roche, Pfizer, and Boehringer Ingelheim. LLV has received fees for consultancy/advisory roles from AstraZeneca and Roche. SV has received fees for consultancy/advisory roles from Bristol‐Myers Squibb, Roche, MSD, Abbvie, Ose Pharma, and Merck. AAH has received fees for consultancy/advisory roles from Bristol‐Myers Squibb, Roche, MSD, and Lilly. MGC has received fees for consultancy/advisory roles from Bristol‐Myers Squibb, Roche, AstraZeneca, and Pierre‐Fabre Oncology, and research funding from AstraZeneca. AP has received fees for consultancy/advisory roles from Pfizer, Lully, Nanostring Technologies, Amgen, Oncolytics Biotech, Daiichi Sankyo, PUMA, Bristol‐Myers Squibb, Novartis, and Daiichi Sankyo, and research funding from Pfizer, Amgen, Roche, Novartis, and Daiichi Sankyo. NR has received fees for consultancy/advisory roles from MSD, BMS and Pfizer, and research funding from Pfizer, Novartis, and Ministry of Health, Instituto de Salud Carlos III, Spain. CA, RR, RRe, AGC, EM, NV, SC, SM, AA, IS, EA, SR, APR, IM, AFC, RP, CS, MMG, MDL, AMB, EG, WPJL, RR, LMM, and MAMV have declared no conflicts of interest.
Author contributions
CA, CT, RR, RRe, AGC, EM, MAMV, and NR conceived and designed the study. CA, CT, RR, RRe, AGC, EM, SM, AA, EA, SR, MAMV, and NR conducted the experiments, acquired, and analyzed data. CC, NV, SC, SM, LLV, IS, IM, SV, AFC, RP, CS, MMG, MDL, AAH, AMB, MGC, EG, WPJL, RRo, LMM, and AP provided clinical samples and collected clinical information. NR, CT, CA, and MAMV wrote the manuscript. All authors reviewed and/or revised the manuscript.
Peer Review
The peer review history for this article is available at https://publons.com/publon/10.1002/1878‐0261.12861.
Supporting information
Fig. S1. Heatmap displaying the molecular and clinical characteristics samples with METΔex14 discordant results between RT‐PCR and nCounter.
Fig. S2. MET mRNA expression levels by nCounter in samples harboring different driver alterations.
Table S1. MET amplification criteria used in clinical trials of MET inhibitors.
Table S2. Description of the NGS panels used in the study.
Table S3. Description of the nCounter codeset used in the study and probes design for MET wild type and METΔex14.
Table S4. Characteristics of the samples with valid results, N (%). Fusions were determined by nCounter, mutations by NGS.
Table S5. Results for MET exon 14 alteration splice‐site regions and mutation types.
Table S6. Concordance of nCounter with RT‐PCR and NGS for METexΔ14 status.
Table S7. Concordance of the nCounter categorization using the cut‐off for very high MET levels with IHC, FISH and NGS.
Table S8. Concordance of the nCounter categorization using the cut‐off for moderately elevated MET levels with IHC, FISH and NGS.
Acknowledgements
This study has received research funding from Pfizer, Novartis, and the Ministry of Health, Instituto de Salud Carlos III, Spain (FIS PI16/00890), to NR; and from the European Union Eurostars program (EUS‐20159616). Additionally, the participation of CIMA has been founded by LMM, FIS PI19/00098, and AECC grant (GCB14‐2170).
Cristina Aguado, Cristina Teixido and Ruth Román share first authorship
Miguel A. Molina‐Vila and Noemi Reguart share last authorship
Data accessibility
All data generated or analyzed during this study are included in this manuscript and its supplementary information files or are available from the authors upon reasonable request.
References
- 1. Guo R, Luo J, Chang J, Rekhtman N, Arcila M & Drilon A (2020) MET‐dependent solid tumours ‐ molecular diagnosis and targeted therapy. Nat Rev Clin Oncol 17, 569–587. [DOI] [PMC free article] [PubMed] [Google Scholar]
- 2. Drilon F, Cappuzzo SI & Ou DR (2017) Camidge, targeting MET in lung cancer: will expectations finally be MET? J Thorac Oncol 12, 15–26. [DOI] [PMC free article] [PubMed] [Google Scholar]
- 3. Duplaquet L, Kherrouche Z, Baldacci S, Jamme P, Cortot AB, Copin MC & Tulasne D (2018) The multiple paths towards MET receptor addiction in cancer. Oncogene 37, 3200–3215. [DOI] [PubMed] [Google Scholar]
- 4. Recondo G, Che J, Janne PA & Awad MM (2020) Targeting MET dysregulation in cancer. Cancer Discov 10, 922–934. [DOI] [PMC free article] [PubMed] [Google Scholar]
- 5. Wang Q, Yang S, Wang K & Sun SY (2019) MET inhibitors for targeted therapy of EGFR TKI‐resistant lung cancer. J Hematol Oncol 12, 63. [DOI] [PMC free article] [PubMed] [Google Scholar]
- 6. Awad MM, Oxnard GR, Jackman DM, Savukoski DO, Hall D, Shivdasani P, Heng JC, Dahlberg SE, Janne PA, Verma S et al (2016) MET exon 14 mutations in non‐small‐cell lung cancer are associated with advanced age and stage‐dependent MET genomic amplification and c‐Met overexpression. J Clin Oncol 34, 721–730. [DOI] [PubMed] [Google Scholar]
- 7. Schrock AB, Frampton GM, Suh J, Chalmers ZR, Rosenzweig M, Erlich RL, Halmos B, Goldman J, Forde P, Leuenberger K et al (2016) Characterization of 298 patients with lung cancer harboring MET exon 14 skipping alterations. J Thorac Oncol 11, 1493–1502. [DOI] [PubMed] [Google Scholar]
- 8. Tong JH, Yeung SF, Chan AW, Chung LY, Chau SL, Lung RW, Tong CY, Chow C, Tin EK, Yu YH et al (2016) MET amplification and exon 14 splice site mutation define unique molecular subgroups of non‐small cell lung carcinoma with poor prognosis. Clin Cancer Res 22, 3048–3056. [DOI] [PubMed] [Google Scholar]
- 9. Kong‐Beltran M, Seshagiri S, Zha J, Zhu W, Bhawe K, Mendoza N, Holcomb T, Pujara K, Stinson J, Fu L et al (2006) Somatic mutations lead to an oncogenic deletion of met in lung cancer. Cancer Res 66, 283–289. [DOI] [PubMed] [Google Scholar]
- 10. Zhao X, Weir BA, LaFramboise T, Lin M, Beroukhim R, Garraway L, Beheshti J, Lee JC, Naoki K, Richards WG et al (2005) Homozygous deletions and chromosome amplifications in human lung carcinomas revealed by single nucleotide polymorphism array analysis. Cancer Res 65, 5561–5570. [DOI] [PubMed] [Google Scholar]
- 11. Paik PK, Drilon A, Fan PD, Yu H, Rekhtman N, Ginsberg MS, Borsu L, Schultz N, Berger MF, Rudin CM et al (2015) Response to MET inhibitors in patients with stage IV lung adenocarcinomas harboring MET mutations causing exon 14 skipping. Cancer Discov 5, 842–849. [DOI] [PMC free article] [PubMed] [Google Scholar]
- 12. Frampton GM, Ali SM, Rosenzweig M, Chmielecki J, Lu X, Bauer TM, Akimov M, Bufill JA, Lee C, Jentz D et al (2015) Activation of MET via diverse exon 14 splicing alterations occurs in multiple tumor types and confers clinical sensitivity to MET inhibitors. Cancer Discov 5, 850–859. [DOI] [PubMed] [Google Scholar]
- 13. Paik PK, Felip E, Veillon R, Sakai H, Cortot AB, Garassino MC, Mazieres J, Viteri S, Senellart H, Van Meerbeeck J et al (2020) Tepotinib in non‐small‐cell lung cancer with MET exon 14 skipping mutations. N Engl J Med 383, 931–943. [DOI] [PMC free article] [PubMed] [Google Scholar]
- 14. Drilon JW, Clark J, Weiss SI, Ou DR, Camidge BJ, Solomon GA, Otterson LC, Villaruz GJ, Riely RS, Heist MM et al (2020) Paik, antitumor activity of crizotinib in lung cancers harboring a MET exon 14 alteration. Nat Med 26, 47–51. [DOI] [PMC free article] [PubMed] [Google Scholar]
- 15. Wolf J, Seto T, Han J‐Y, Reguart N, Garon EB, Groen HJM, Tan DS‐W, Hida T, Jonge MJD, Orlov SV et al (2019) Capmatinib (INC280) in METΔex14‐mutated advanced non‐small cell lung cancer (NSCLC): efficacy data from the phase II GEOMETRY mono‐1 study. J Clin Oncol 37, 9004. [Google Scholar]
- 16. Wolf J, Overbeck TR, Han J‐Y, Hochmair M, Marinis FD, Ohashi K, Smit EF, Power D, Garon EB, Groen HJM et al (2020) Capmatinib in patients with high‐level MET‐amplified advanced non–small cell lung cancer (NSCLC): results from the phase 2 GEOMETRY mono‐1 study. J Clin Oncol 38, 9509. [Google Scholar]
- 17. Wolf J, Seto T, Han JY, Reguart N, Garon EB, Groen HJM, Tan DSW, Hida T, de Jonge M, Orlov SV et al (2020) Investigators, capmatinib in MET exon 14‐mutated or MET‐amplified non‐small‐cell lung cancer. N Engl J Med 383, 944–957. [DOI] [PubMed] [Google Scholar]
- 18. Dhillon S (2020) Capmatinib: first approval. Drugs 80, 1125–1131. [DOI] [PubMed] [Google Scholar]
- 19. Recondo G, Bahcall M, Spurr LF, Che J, Ricciuti B, Leonardi GC, Lo YC, Li YY, Lamberti G, Nguyen T et al (2020) Molecular mechanisms of acquired resistance to MET tyrosine kinase inhibitors in patients with MET exon 14‐mutant NSCLC. Clin Cancer Res 26, 2615–2625. [DOI] [PubMed] [Google Scholar]
- 20. Sequist LV, Han JY, Ahn MJ, Cho BC, Yu H, Kim SW, Yang JC, Lee JS, Su WC, Kowalski D et al (2020) Osimertinib plus savolitinib in patients with EGFR mutation‐positive, MET‐amplified, non‐small‐cell lung cancer after progression on EGFR tyrosine kinase inhibitors: interim results from a multicentre, open‐label, phase 1b study. Lancet Oncol 21, 373–386. [DOI] [PubMed] [Google Scholar]
- 21. Wang Y, Li L, Han R, Jiao L, Zheng J & He Y (2018) Clinical analysis by next‐generation sequencing for NSCLC patients with MET amplification resistant to osimertinib. Lung Cancer 118, 105–110. [DOI] [PubMed] [Google Scholar]
- 22. Bubendorf L, Dafni U, Schobel M, Finn SP, Tischler V, Sejda A, Marchetti A, Thunnissen E, Verbeken EK, Warth A et al (2017) Prevalence and clinical association of MET gene overexpression and amplification in patients with NSCLC: results from the European Thoracic Oncology Platform (ETOP) Lungscape project. Lung Cancer 111, 143–149. [DOI] [PubMed] [Google Scholar]
- 23. Noonan SA, Berry L, Lu X, Gao D, Baron AE, Chesnut P, Sheren J, Aisner DL, Merrick D, Doebele RC et al (2016) Identifying the appropriate FISH criteria for defining MET copy number‐driven lung adenocarcinoma through oncogene overlap analysis. J Thorac Oncol 11, 1293–1304. [DOI] [PMC free article] [PubMed] [Google Scholar]
- 24. Schildhaus HU, Schultheis AM, Ruschoff J, Binot E, Merkelbach‐Bruse S, Fassunke J, Schulte W, Ko YD, Schlesinger A, Bos M et al (2015) MET amplification status in therapy‐naive adeno‐ and squamous cell carcinomas of the lung. Clin Cancer Res 21, 907–915. [DOI] [PubMed] [Google Scholar]
- 25. Guo R, Luo J, Chang J, Rekhtman N, Arcila M & Drilon A (2020) MET‐dependent solid tumours – molecular diagnosis and targeted therapy. Nat Rev Clin Oncol 17, 569–587. [DOI] [PMC free article] [PubMed] [Google Scholar]
- 26. Warren S (2018) Simultaneous, multiplexed detection of RNA and protein on the NanoString((R)) nCounter((R)) platform. Methods Mol Biol 1783, 105–120. [DOI] [PubMed] [Google Scholar]
- 27. Marin E, Teixido C, Carmona‐Rocha E, Reyes R, Arcocha A, Vinolas N, Rodriguez‐Mues M, Cabrera C, Sanchez M, Vollmer I et al (2020) Usefulness of two independent DNA and RNA tissue‐based multiplex assays for the routine care of advanced NSCLC patients. Cancers (Basel) 12, 1124. [DOI] [PMC free article] [PubMed] [Google Scholar]
- 28. Park K, Choi MK, Jung HH, Do IG, Lee KH, Ahn T, Kil WH, Kim SW, Lee JE, Nam SJ et al (2015) Molecular characterization of patients with pathologic complete response or early failure after neoadjuvant chemotherapy for locally advanced breast cancer using next generation sequencing and nCounter assay. Oncotarget 6, 24499–24510. [DOI] [PMC free article] [PubMed] [Google Scholar]
- 29. Kim ST, Do IG, Lee J, Sohn I, Kim KM & Kang WK (2015) The NanoString‐based multigene assay as a novel platform to screen EGFR, HER2, and MET in patients with advanced gastric cancer. Clin Transl Oncol 17, 462–468. [DOI] [PubMed] [Google Scholar]
- 30. Lee J, Ou SH, Lee JM, Kim HC, Hong M, Kim SY, Jang J, Ahn S, Kang SY, Lee S et al (2015) Gastrointestinal malignancies harbor actionable MET exon 14 deletions. Oncotarget 6, 28211–28222. [DOI] [PMC free article] [PubMed] [Google Scholar]
- 31. Reguart N, Teixido C, Gimenez‐Capitan A, Pare L, Galvan P, Viteri S, Rodriguez S, Peg V, Aldeguer E, Vinolas N et al (2017) Identification of ALK, ROS1, and RET fusions by a multiplexed mRNA‐based assay in formalin‐fixed, paraffin‐embedded samples from advanced non‐small‐cell lung cancer patients. Clin Chem 63, 751–760. [DOI] [PubMed] [Google Scholar]
- 32. Davies KD, Lomboy A, Lawrence CA, Yourshaw M, Bocsi GT, Camidge DR & Aisner DL (2019) DNA‐based versus RNA‐based detection of MET exon 14 skipping events in lung cancer. J Thorac Oncol 14, 737–741. [DOI] [PubMed] [Google Scholar]
- 33. Benayed R, Offin M, Mullaney K, Sukhadia P, Rios K, Desmeules P, Ptashkin R, Won H, Chang J, Halpenny D et al (2019) High yield of RNA sequencing for targetable kinase fusions in lung adenocarcinomas with no mitogenic driver alteration detected by DNA sequencing and low tumor mutation burden. Clin Cancer Res 25, 4712–4722. [DOI] [PMC free article] [PubMed] [Google Scholar]
- 34. Pineda JMB & Bradley RK (2018) Most human introns are recognized via multiple and tissue‐specific branchpoints. Genes Dev 32, 577–591. [DOI] [PMC free article] [PubMed] [Google Scholar]
- 35. Egecioglu DE & Chanfreau G (2011) Proofreading and spellchecking: a two‐tier strategy for pre‐mRNA splicing quality control. RNA 17, 383–389. [DOI] [PMC free article] [PubMed] [Google Scholar]
- 36. Kurosaki T & Maquat LE (2016) Nonsense‐mediated mRNA decay in humans at a glance. J Cell Sci 129, 461–467. [DOI] [PMC free article] [PubMed] [Google Scholar]
- 37. Poirot B, Doucet L, Benhenda S, Champ J, Meignin V & Lehmann‐Che J (2017) MET exon 14 alterations and new resistance mutations to tyrosine kinase inhibitors: risk of inadequate detection with current amplicon‐based NGS panels. J Thorac Oncol 12, 1582–1587. [DOI] [PubMed] [Google Scholar]
- 38. Baldacci S, Figeac M, Antoine M, Descarpentries C, Kherrouche Z, Jamme P, Copin MC, Tulasne D, Nanni I, Beau‐Faller M et al (2020) High MET overexpression does not predict the presence of MET exon 14 splice mutations in NSCLC: results From the IFCT PREDICT.amm study. J Thorac Oncol 15, 120–124. [DOI] [PubMed] [Google Scholar]
- 39. Bang YJ, Su WC, Schuler M, Nam DH, Lim WT, Bauer TM, Azaro A, Poon RTP, Hong D, Lin CC et al (2020) Phase 1 study of capmatinib in MET‐positive solid tumor patients: dose escalation and expansion of selected cohorts. Cancer Sci 111, 536–547. [DOI] [PMC free article] [PubMed] [Google Scholar]
- 40. Schuler M, Berardi R, Lim WT, de Jonge M, Bauer TM, Azaro A, Gottfried M, Han JY, Lee DH, Wollner M et al (2020) Molecular correlates of response to capmatinib in advanced non‐small‐cell lung cancer: clinical and biomarker results from a phase I trial. Ann Oncol 31, 789–797. [DOI] [PMC free article] [PubMed] [Google Scholar]
- 41. Castiglione R, Alidousty C, Holz B, Wagener S, Baar T, Heydt C, Binot E, Zupp S, Kron A, Wolf J et al (2019) Comparison of the genomic background of MET‐altered carcinomas of the lung: biological differences and analogies. Mod Pathol 32, 627–638. [DOI] [PMC free article] [PubMed] [Google Scholar]
- 42. Wu YL, Cheng Y, Zhou J, Lu S, Zhang Y, Zhao J, Kim DW, Soo RA, Kim SW, Pan H et al (2020) Tepotinib plus gefitinib in patients with EGFR‐mutant non‐small‐cell lung cancer with MET overexpression or MET amplification and acquired resistance to previous EGFR inhibitor (INSIGHT study): an open‐label, phase 1b/2, multicentre, randomised trial. Lancet Respir Med 8, 1132–1143. [DOI] [PubMed] [Google Scholar]
- 43. Guo R, Offin M, Rose‐Brannon A, Chow A & Drilon AE (2019) MET inhibitor resistance in patients with MET exon 14‐altered lung cancers. J Clin Oncol 37, 1.30422740 [Google Scholar]
- 44. Di Renzo MF, Narsimhan RP, Olivero M, Bretti S, Giordano S, Medico E, Gaglia P, Zara P & Comoglio PM (1991) Expression of the Met/HGF receptor in normal and neoplastic human tissues. Oncogene 6, 1997–2003. [PubMed] [Google Scholar]
- 45. Kurz SM, Diebold SS, Hieronymus T, Gust TC, Bartunek P, Sachs M, Birchmeier W & Zenke M (2002) The impact of c‐met/scatter factor receptor on dendritic cell migration. Eur J Immunol 32, 1832–1838. [DOI] [PubMed] [Google Scholar]
Associated Data
This section collects any data citations, data availability statements, or supplementary materials included in this article.
Supplementary Materials
Fig. S1. Heatmap displaying the molecular and clinical characteristics samples with METΔex14 discordant results between RT‐PCR and nCounter.
Fig. S2. MET mRNA expression levels by nCounter in samples harboring different driver alterations.
Table S1. MET amplification criteria used in clinical trials of MET inhibitors.
Table S2. Description of the NGS panels used in the study.
Table S3. Description of the nCounter codeset used in the study and probes design for MET wild type and METΔex14.
Table S4. Characteristics of the samples with valid results, N (%). Fusions were determined by nCounter, mutations by NGS.
Table S5. Results for MET exon 14 alteration splice‐site regions and mutation types.
Table S6. Concordance of nCounter with RT‐PCR and NGS for METexΔ14 status.
Table S7. Concordance of the nCounter categorization using the cut‐off for very high MET levels with IHC, FISH and NGS.
Table S8. Concordance of the nCounter categorization using the cut‐off for moderately elevated MET levels with IHC, FISH and NGS.
Data Availability Statement
All data generated or analyzed during this study are included in this manuscript and its supplementary information files or are available from the authors upon reasonable request.