Abstract
Aims/Introduction
Microribonucleic acid‐155 (microRNA155) and microRNA29 are reported to inhibit glucose metabolism in some cell and animal models, but no evidence from susceptible populations that examines the relationship between microRNA155 or microRNA29 and type 2 diabetes mellitus currently exists. Furthermore, target genes regulated by microRNA155 and microRNA29 that affect glucose and lipid metabolism remain unknown.
Materials and Methods
Human participants were divided into normal weight (n = 72), obesity (n = 120) and type 2 diabetes (n = 59) groups. The contents of microRNA155 and microRNA29 abundance in serum were measured, and candidate genes potentially related to glucose and lipid metabolism targeted by either microRNA155 or microRNA29 were screened. Overexpression of microRNA155 and microRNA29 in HepG2 cells was used to verify candidate gene expression, and measure the effects on glucose and lipid metabolism.
Results
Serum levels of microRNA155 and microRNA29 show a significant increase in individuals with obesity and type 2 diabetes compared with normal weight individuals. Identified target genes for microRNA155 were MAPK14, MAP3K10, DUSP14 and PRKAR2B. Identified target genes for microRNA29 were PEX11A and FADS1. Overexpression of microRNA155 or microRNA29 in HepG2 cells was found to downregulate the expression of identified target genes, and result in inhibition of triglyceride synthesis and glucose incorporation.
Conclusions
MicroRNA155 and microRNA29 were significantly higher in type 2 diabetes patients compared with the control patients, their levels were also positively correlated with fasting plasma glucose levels, and over‐expression of microRNA155 or microRNA29 were found to downregulate glucose and lipid metabolism target genes, and reduce lipid synthesis and glucose incorporation in HepG2 cells.
Keywords: Microribonucleic acid, Obesity, Type 2 diabetes mellitus
We found that microribonucleic acid‐155 and microribonucleic acid‐29 promote the development of type 2 diabetes mellitus. In addition, we screened and validated its downstream target genes in vitro.
INTRODUCTION
The worldwide incidence of type 2 diabetes mellitus has increased year over year in the recent past, becoming the fifth leading cause of death worldwide. According to the World Health Organization, the number of diabetes patients will reach 300 million by 2025, of which 230 million will be in developing countries 1 . Ning et al. 2 showed that the prevalence of type 2 diabetes mellitus among Chinese adults is 11.6%, and 50.1% of people within the adult population is prediabetic. Type 2 diabetes mellitus is characterized by target tissue resistance to insulin (i.e., insulin resistance) and hyperglycemia 3 . Obesity is an important risk factor for insulin resistance and type 2 diabetes mellitus, and recent studies have determined that the obesity rate among men in China increased from 0.33 in 1980 to 5.02% in 2015 and, over the same period, from 0.9 to 5.51% in Chinese women 4 , 5 .
Adipose tissue is not only used as an energy reserve organ, but also serves an endocrine function 6 . In obese individuals, the morphology, size and endocrine function of adipocytes is altered. Microribonucleic acids (microRNAs) are non‐coding RNA transcripts that are highly conserved from nematodes to humans that have been shown to mediate many metabolic activities. Commonly, the activity of microRNAs is manifested through their ability to bind to the 3′ untranslated sequence (3′UTR) of targeted messenger RNA (mRNA) transcripts and often results in repression of targeted genes. MicroRNAs participate in regulation of metabolism, proliferation, differentiation and apoptosis 7 . Many studies determined that most exosomal microRNAs originate from adipose tissue and reach target tissues through blood circulation 8 . This allows microRNAs to affect expression of key genes and influence metabolic processes throughout the body. These targeted pathways potentially include glucose and lipid metabolism, leading to fatty liver, atherosclerosis, cancer, diabetes and other diseases 9 , 10 , 11 , 12 . It has been reported that adipose tissue macrophage‐derived microRNA155 can promote obesity‐induced insulin resistance, suppress nuclear factor‐κB activity and attenuate release of pro‐inflammatory cytokines from microglia 13 , 14 . Furthermore, microRNA155 regulates the phosphoinositide 3‐kinase–protein kinase B–mammalian target of rapamycin signaling pathway underscoring a potentially important role for microRNA155 in modulating metabolism. It has also been reported that overexpression of microRNA29 in adipocytes inhibits insulin‐stimulated glucose uptake and reduces insulin sensitivity in skeletal muscle 15 , 16 . Overexpression of microRNA29 can reduce phosphoinositide 3‐kinase phosphorylation, attenuate oxidative stress, and promote hepatocyte inflammation, autophagy and fibrosis 17 . Despite these findings, no studies to date have examined a potential relationship between microRNA155 and/or microRNA29 expression and individuals with type 2 diabetes mellitus. Furthermore, genes targeted by microRNA155 and microRNA29 are currently unknown.
In the present work, we studied individuals with normal bodyweight, obesity and type 2 diabetes mellitus to determine the association of microRNA155 or microRNA29 with type 2 diabetes mellitus. We subsequently used a bioinformatics approach to predict the target genes of microRNA155 and microRNA29. Alterations in glucose and lipid metabolism were studied in the human hepatocellular carcinoma cell line HepG2 after ectopic expression of microRNA155 or microRNA29. Additionally, microRNA155 and microRNA29 target genes were identified and verified. The goal of this study was to clarify the roles of microRNA155 and microRNA29 in the pathobiology of type 2 diabetes mellitus, and uncover specific molecular mechanisms impacted by microRNA155 and microRNA29 that regulate glucose and lipid metabolism.
METHODS
Participants
Serum samples of 251 individuals were collected from 2016 to 2018 in the Xinjiang Uyghur Autonomous region of China. These samples included 72 samples from the first affiliated Hospital of Shihezi University, Shihezi, Xinjiang, China, 83 samples from Manas County of Xinjiang, and 96 samples from the 51st regiment of the Xinjiang Production and Construction Corps. The following information was collected from all patients: weight, waist circumference, hip circumference, waist‐to‐hip ratio and body mass index. Metabolic indices were quantified using an automated biochemistry analyzer (Mindray, Shenzhen, China) and these included fasting plasma glucose, plasma levels of triglycerides (TG), cholesterol, and high‐density (HDL) and low‐density lipoproteins.
Participants were divided into three groups: normal weight group (n = 72, 18.5 kg/m2 ≤ body mass index ≤ 24 kg/m2), obese group (n = 120, body mass index ≥28 kg/m2) and type 2 diabetes group (n = 59, fasting plasma glucose ≥7.0 mmol/L, 2‐h plasma glucose ≥11.1 mmol/L). The normal weight group was non‐obese and non‐type 2 diabetes mellitus patients. Diagnosis of type 2 diabetes mellitus was made in accordance with the World Health Organization diagnostic criteria issued in 1999. Exclusion criteria included individuals with type 1 diabetes mellitus, patients with tumors, acute inflammation, kidney disease, and the recent use of drugs known to interfere with glucose and lipid metabolism.
Serum samples
A total of 3 mL of venous blood was collected and serum separated by centrifugation at 1,788 g for 5 min. The upper serum layer was collected and frozen in an ultra‐low temperature freezer before RNA extraction.
Expression analysis of microRNA155 and microRNA29
Total RNA in serum samples was extracted using the miRcute serum/plasma microRNA isolation kit (cat# DP503; TianGen, Beijing, China). MicroRNA155 and microRNA29 complementary deoxyribonucleic acid were synthesized from total microRNA using the miRcute Plus microRNA first strand cDNA kit (cat# KR211; TianGen). Relative gene expression was quantified using the miRcute plus microRNA SYBR Green qPCR Kit (cat# FP401; TianGen).
Real‐time quantitative polymerase chain reaction (qPCR) was carried out using an ABI7500 Fast instrument (Applied Biosystems, Shanghai, China). Relative gene expression levels were calculated as the ratio of the target gene to an internal reference (U6 transcript). Detailed thermocycling conditions can be found in Tables S1 and S2.
RNA isolation and quantitative real‐time PCR
Total RNA was isolated from HepG2 cells using TRIZOL reagent (cat# 15596‐026; Life Technologies, Camarillo, CA, USA). Reverse transcription and complementary deoxyribonucleic acid synthesis reactions were carried out as previously indicated 18 . PCR reactions were carried out in 10 μL volumes, and the detailed PCR reaction system and thermocycling conditions are outlined in Tables S3 and S4. Relative gene expression levels were calculated as the ratio of the target gene to an internal reference (glyceraldehyde 3‐phosphate dehydrogenase). PCR primers and the length of amplified fragments are provided in Table S5.
Cell culture and transfection
HepG2 cells were cultured in Dulbecco’s modified Eagle’s medium (Gibco, Grand Island, NY, USA), containing 25 mmol/L glucose, and further supplemented with 10% fetal bovine serum and 1% penicillin/streptomycin (100 µg/mL). Cells were cultured at 37°C in a 5% CO2 atmosphere. The microRNA155, microRNA29 mimics and a negative control RNA were synthesized by GenePharma, Shanghai, China. The constructs were added to HepG2 cells after mixing with Lipofectamine 2000 (cat# 11668‐019; Invitrogen, Waltham, MA, USA), according to the manufacturer’s instructions. RNA samples were extracted for analysis 24 h after transfection.
Glucose metabolism assay
HepG2 cells were grown in six‐well plates and transfected with mimics (50 nmol/L). After 24 h (empirically determined optimal time for mimic expression), culture medium was collected for measurement of glucose concentration using the glucose oxidase method (cat# F006; Nanjing Jiancheng Biological Engineering Research Institute, Nanjing, China).
In vitro cell model of lipid accumulation
Palmitic acid (PA) powder (cat# P0500; Sigma‐Aldrich, Shanghai, China) was dissolved in 0.01 mol/L NaOH to make a stock solution. The PA stock solution was diluted by mixing culture medium with 40% bovine serum albumin (BAH66‐0050; Equitech‐Bio, Wuhan, China) to make a PA solution. Oleic acid (O1008; Sigma, Shanghai, China) was dissolved in 0.01 mol/L NaOH to the indicated concentration. For Oil Red O staining and the detection of internal TG levels in HepG2 cells, PA and oleic acid stock solutions with 40% bovine serum albumin were mixed and diluted with medium to final concentrations of 1.5 mmol/L. Cells were then stained with Oil Red O to examine the level of internal lipid accumulation, and the cells of the Oil Red O dyed with isopropanol were subjected to elution and quantification. Intracellular TG levels of HepG2 were measured using GPO‐PAP method (cat# A110‐1; Nanjing Jiancheng Biological Engineering Research Institute) according to the manufacturer’s protocol.
Target gene prediction
Using a bioinformatics database for microRNA target gene prediction, such as miRbase, Targetscan, MiRanda, miRwalk and StarBase, a list of downstream target genes for microRNA155 and microRNA29 was obtained. The first 100 target genes in each database were selected and screened with cumulative weighted values predicted by the aforementioned three databases to expand the number of valid genes predicted. We subsequently carried out signal pathway analysis and gene function analysis on identified genes and, from this list, selected target genes for verification. Finally, we used StarBase to analyze the selected target genes for microRNAs and their interaction sites, and further determined which microRNA155 and microRNA29 target genes might affect glucose and lipid metabolism. The research flow chart is shown in Figure S1.
Luciferase assay
HEK‐293T cells were transfected with plasmids encoding the MAPK14 or FADS1 3′UTR, Renilla luciferase pRL‐TK vector (Promega, Madison, WI, USA), and microRNA155 or microRNA29 and microRNA control mimics using lipofectamine 2000 reagent (Invitrogen). After 24 h, luminescence was determined using the Dual‐Luciferase Reporter Assay System (REF E2920; Promega). Luminescence results were normalized to the Renilla luminescent signal.
Statistical analysis
The SPSS statistical package (version 20.0; SPSS Inc., Chicago, IL, USA) was used for statistical data analyses. Data are expressed as the mean ± 1.0 standard deviation. For data fitting a normal distribution, statistical differences between groups were determined using an unpaired Student’s t‐test. Statistical analysis of data with more than two groups was evaluated by one‐way analysis of variance (anova). For data not conforming to a normal distribution, a rank sum test was carried out. The relationships between microRNA155, microRNA29 expression and correlated clinical metrics were tested by Spearman’s correlation analysis. P < 0.05 was defined as statistically significant.
Informed consent and study ethics
All participants provided informed and voluntary consent before enrollment in this study. This consent included an understanding that clinical information and biological samples would be used for research. The consent form and ethical approval were provided by the Medical Ethics Committee at First Affiliated Hospital, Shihezi University School of Medicine (reference number 2015‐054‐01).
RESULTS
The relative expression levels in serum of microRNA155 and microRNA29 are increased in obese and type 2 diabetes mellitus patients when compared with normal weight individuals
Compared with the normal weight group, microRNA155 was found to be significantly increased in the serum of obese and type 2 diabetes mellitus patients (Figure 1a). We next explored the correlation between microRNA155 expression and general patient data, the general data are shown in Table S6. As shown, elevated expression of microRNA155 is significantly associated with increased glucose, TG and HDL (Table 1). There is also a significant increase in expression of microRNA29 in the serum of patients in the type 2 diabetes mellitus and obese groups, compared with the normal weight group (Figure 1b). Furthermore, we also found that increased expression of microRNA29 was significantly correlated with TG, cholesterol and HDL (Table 2).
Figure 1.
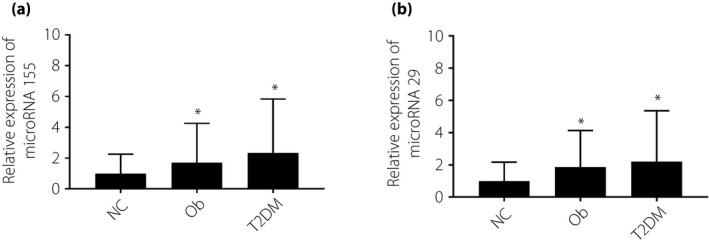
(a,b) The expression of microribonucleic acid‐155 (microRNA155) and microRNA29 in human serum samples. Assays were carried out on normal weight (NC; n = 72), obese (Ob; n = 120) and type 2 diabetes (T2DM; n = 59) patients. Non‐parametric rank‐sum test, *P < 0.05, compared with NC, # P < 0.05, compared with Ob, the difference was statistically significant.
Table 1.
Correlation analysis between microribonucleic acid‐155 and general data of patients
| r‐value | P‐value | |
|---|---|---|
| BMI | 0.036 | 0.638 |
| GLU | 0.236 | 0.002* |
| TG | 0.176 | 0.019* |
| TC | 0.129 | 0.089 |
| LDL | 0.103 | 0.193 |
| HDL | 0.206 | 0.008* |
Spearman’s correlation coefficient, n = 251.
BMI, body mass index; GLU, glucose; HDL, high‐density lipoprotein; LDL, low‐density lipoprotein; TC, total cholesterol; TG, triglyceride.
P < 0.05.
Table 2.
Correlation analysis between microribonucleic acid‐29 and general data of patients
| r‐value | P‐value | |
|---|---|---|
| BMI | 0.129 | 0.110 |
| GLU | 0.073 | 0.333 |
| TG | 0.241 | 0.001* |
| TC | 0.161 | 0.032* |
| LDL | 0.110 | 0.159 |
| HDL | 0.154 | 0.048* |
Spearman’s correlation coefficient, n = 251.
BMI, body mass index; GLU, glucose; HDL, high‐density lipoprotein; LDL, low‐density lipoprotein; TC, total cholesterol; TG, triglyceride.
P < 0.05.
MicroRNA155 and microRNA29 target genes might regulate glucose and lipid metabolism
According to bioinformatic predictions and data analysis (Figure S1), microRNA15 possibly regulates expression of the MAPK14, SLC25A36, APPL1, MAP3K10, DUSP14, PRKAR2B and IAPP genes (Figure 2a). Similarly deduced target genes of microRNA29 were PEX11A, FADS1, GFOD2, PGRMC1, GANC and PIK3C2G (Figure 2b). When signal pathway analysis was used, these target genes of microRNA155 and microRNA29 were found to impact glucose and lipid metabolism.
Figure 2.
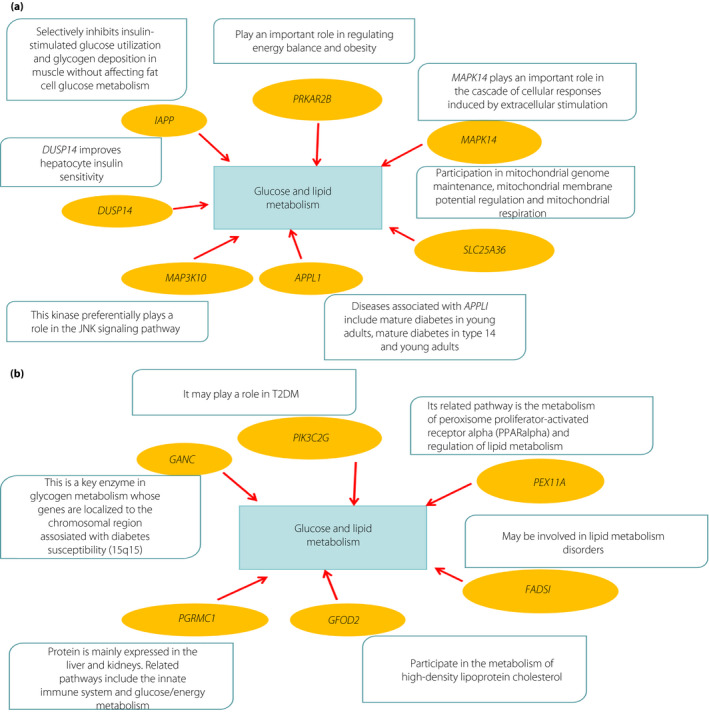
(a,b) Using bioinformatic microribonucleic acid (microRNA) target gene prediction tools, target genes of microRNA155 and microRNA29 were deduced, and the top 100 scoring target genes in each database were selected. Candidate target genes related to glucose and lipid metabolism were subsequently determined. PPAR, peroxisome proliferator‐activated receptor; T2DM, type 2 diabetes.
MicroRNA155 and microRNA29 can inhibit lipid synthesis and glucose incorporation by downregulating target genes
The expression of microRNA155 was upregulated by transfecting a mimic into HepG2 cells. Results showed that the overexpression of microRNA155 could significantly reduce the mRNA expression levels of MAPK14, MAP3K10, DUSP14 and PRKAR2B (Figure 3a–e). The 24 h post mimic‐microRNA155 transfection, Oil Red O staining and the level of intracellular TG suggested that microRNA155 could significantly inhibit lipid synthesis within cells (Figure 4a–c). Furthermore, a net glucose incorporation assay suggested that microRNA155 upregulation can significantly inhibit glucose incorporation in HepG2 cells (Figure 4d).
Figure 3.
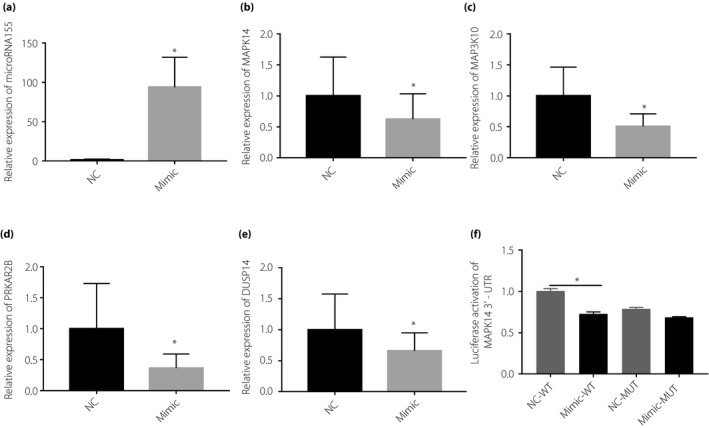
Messenger ribonucleic acid (mRNA) expression levels of indicated target genes were measured in HepG2 cells 24 h after transfection with microribonucleic acid‐155 (microRNA155) mimic. (a) MicroRNA155 expression was measured; (b) MAPK14 mRNA expression; (c) MAP3K10 mRNA expression; (d) PRKA2R mRNA expression; (e) DUSP14 mRNA expression. (f) The luciferase reporter using the MAPK14 3′ untranslated sequence (3′UTR) and tested the luciferase activity in HEK‐293T cells expressing microRNA155. A non‐parametric rank‐sum test was used, *P < 0.05, compared with normal weight patients (NC). MUT, mutant‐type; WT, wild‐type.
Figure 4.
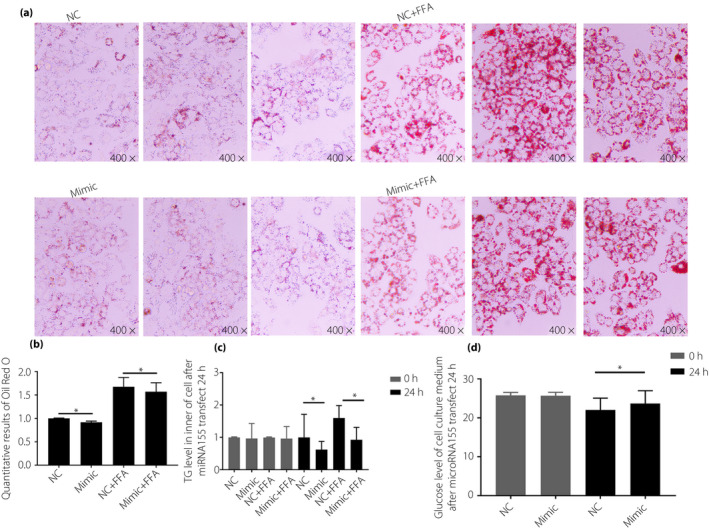
HepG2 cells were transfected with indicated mimic microRNAs for 24 h. Lipid synthesis and glucose incorporation in HepG2 cells ectopically expressing microribonucleic acid‐155 (microRNA155) cells was measured. (a) Results of Oil Red O stain; (b) quantitative results of cell solubilization with isopropanol after Oil Red O staining; (c) intracellular triglyceride (TG) levels were measured; and (d) glucose measurements in cell culture medium. Non‐parametric rank sum test was used, *P < 0.05, compared with normal weight patients (NC). FFA, free fatty acids.
Expression of microRNA29 was similarly upregulated by mimic transfection into HepG2 cells. The mRNA expression levels of several genes involved in lipid metabolism, including FADS1 and PEX11A, was found to be significantly downregulated when microRNA29 was overexpressed (Figure 5a–c). The microRNA29‐mimic transfected HepG2 cells also assayed by Oil Red O staining and TG analysis showed that, when compared with control mimic‐transfected cells, overexpression of microRNA29 suggested inhibited lipid synthesis (Figure 6a–c). Additionally, microRNA29 overexpression was found to inhibit glucose incorporation in HepG2 cells (Figure 6d).
Figure 5.
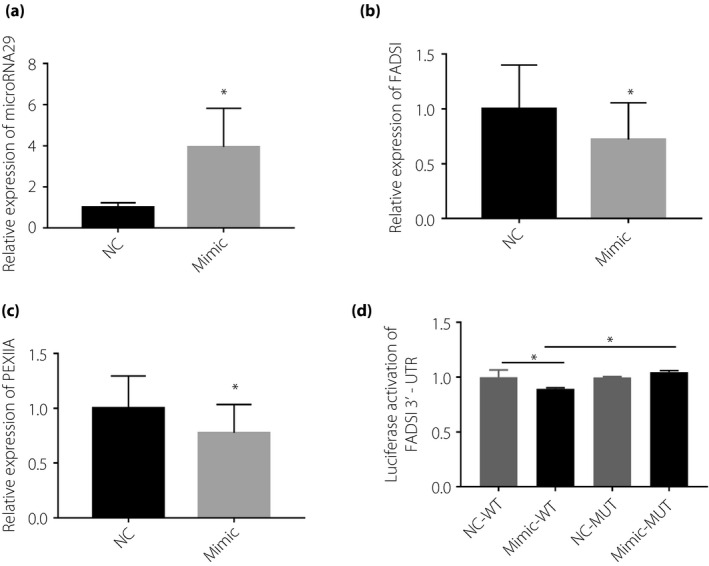
Messenger ribonucleic acid (mRNA) expression levels in HepG2 cells were measured 24 h after transfection with microribonucleic acid‐29 (microRNA29) mimic. (a) Measurement of microRNA29 expression; (b) FADS1 mRNA expressions; (c) PEX11A mRNA expression; and (d) a luciferase reporter using the FADS1 3′ untranslated sequence (3′UTR) and tested the luciferase activity in HEK‐293T cells expressing microRNA29. Non‐parametric rank‐sum test was used, *P < 0.05, compared with normal weight patients (NC).
Figure 6.
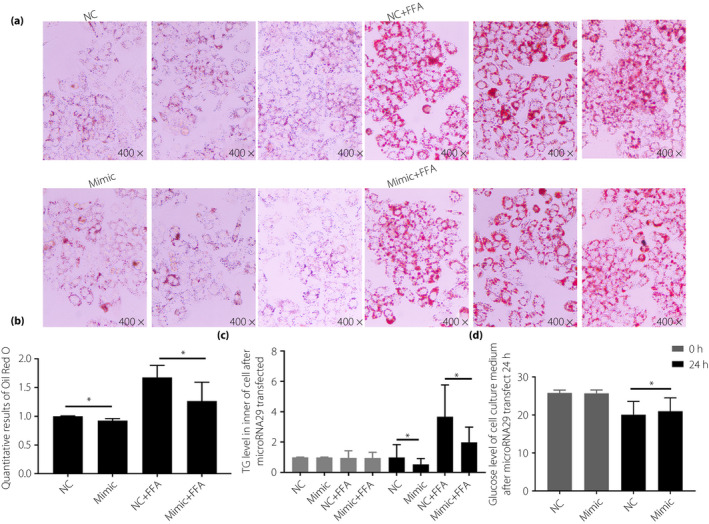
HepG2 cells were transfected with the microribonucleic acid‐29 (microRNA29) mimic for 24 h, and lipid synthesis and glucose incorporation ability were subsequently detected. (a) Oil Red O staining of HepG2; (b) quantitative results of solubilization of Oil Red O stained cells with isopropanol; (c) intracellular triglyceride (TG) levels were measured; and (d) glucose concentrations cell culture medium were measured. Non‐parametric rank‐sum test was used, *P < 0.05, compared with normal weight patients (NC). FFA, free fatty acids.
To verify target gene identification, we chose MAPK14 as a target for microRNA155 and FADS1 as a target for microRNA29, and verified specific microRNA effects on gene expression using a luciferase reporter. We constructed a luciferase reporter using the MAPK14 3′UTR, and tested the luciferase activity in HEK‐293T cells expressing microRNA155. As shown in Figure 3e, microRNA155 repressed luciferase activity in the MAPK14 3′UTR, whereas it failed to regain the luciferase activity in a mutant form of the MAPK14 3′UTR, showing that there might be other sequences in MAPK14 3′UTR that can combine the microRNA155. Similarly, FADS1 3′UTR was tested for luciferase activity in 293T cells during overexpressing microRNA29. As the results show, microRNA29 significantly inhibited wild‐type FADS1 3′UTR luciferase activity when compared with cells expressing mutant FADS1 3′UTR (Figure 5d). These findings support our microRNA155 and microRNA29 target gene predictions, and that microRNA155 targets the MAPK14 3′UTR and microRNA29 targets the FADS1 3′UTR, leading to mRNA repression.
DISCUSSION
Consistent with its endocrine function, adipose tissue not only secretes adipokines (such as leptin, adiponectin etc.), but also releases microRNAs that participate in physiological and pathological processes in the body through regulation of target gene expression. With the changes in composition and morphology of adipose tissue observed in obese patients, the endocrine function of adipose tissue is also likely to be affected. Accordingly, reports showed that adipose tissue‐derived microRNAs are associated with various obesity‐related diseases 8 . Thus, microRNAs have great potential as therapeutic targets for the treatment of obesity and related chronic diseases 19 .
It is evident from human and animal studies that obesity alters microRNA expression in metabolically important organs, and that microRNAs are involved in changes to normal physiology, acting as mediators of disease 6 . For example, microRNAs play important roles in cardiovascular diseases. As shown in the Fichtlscherer et al. 20 study, microRNA17 was significantly lower in the plasma of patients with coronary artery disease. Similarly, Heneghan et al. 21 confirmed reduced expression of microRNA17 in human omental adipose tissue taken from obese patients. Conversely, overexpression of certain microRNA can improve disease symptoms. As shown by Zhao et al. 22 , 23 , microRNA155 can alleviate PA‐induced vascular endothelial cell injury in human umbilical vein endothelial cells by negatively regulating the Wnt signaling pathway, and microRNA155 might be considered as a potential therapeutic target for the treatment of atherosclerosis. Apart from cardiovascular diseases, microRNAs are also associated with obesity‐associated tumorigenesis. Upregulation of microRNA665 expression independently predicts poor lung cancer prognosis, and promotes tumor cell proliferation, migration and invasion 24 . Wu et al. 25 found that microRNA143 can suppress the proliferation and metastasis of human gastric cancer cells by modulating signal transducer and activator of transcription 3 expression. The sponging microRNA‐329‐3p can accelerate cell proliferation and invasion, and inhibit cell apoptosis by repressing radiosensitivity of glioma by enhancing CREB1 expression 26 . Therefore, microRNAs can be critical factors in diseases associated with obesity.
It has been reported that regulatory functions have been ascribed to microRNAs in tissues directly targeted by insulin, such as the liver, adipose tissue and skeletal muscle 27 , 28 , 29 . It has been reported that patients with type 2 diabetes mellitus show increased circulatory levels of microRNA‐128 30 . Furthermore, Poy et al. 31 , 32 showed that microRNA375 interferes with insulin secretion, and microRNA96 is upregulated in pancreatic β‐cells in type 2 diabetes mellitus. Xiao et al. 33 found that microRNA17 levels were negatively associated with glucose transporter type 4 expression. Additionally, loss and gain‐of‐function analyses showed that overexpression of microRNA17 impaired glucose metabolism in L6 rat skeletal muscle cell line. In addition to negatively regulating glucose metabolism, microRNAs can positively impact glucose metabolism. For example, Xu et al. 34 confirmed that microRNA125a‐5p should be considered a regulator of glycolipid metabolism in type 2 diabetes mellitus, because this microRNA can inhibit hepatic lipogenesis, gluconeogenesis, and elevate glycogen synthesis by targeting signal transducer and activator of transcription 3 expression. Thus, microRNAs show promise in the diagnosis and treatment of type 2 diabetes mellitus.
Ying et al. 35 found that microRNA155 injected intravenously into normal weight mice fed with a normal diet altered expression of key genes involved in glucose and lipid metabolism in various target tissues, such as skeletal muscle, adipose tissue and the liver. This resulted in a decrease in glucose and lipid metabolism, and led to abnormal glucose tolerance and insulin resistance. On the contrary, microRNA155 improves glucose tolerance and insulin resistance in obese mice. Furthermore, it has been reported that microRNA29 influences glucose and lipid metabolism in skeletal muscle cells 36 . Accordingly, microRNA155 and microRNA29 can potentially play an important role in type 2 diabetes mellitus, but there is no current evidence linking microRNA155 and microRNA29 to type 2 diabetes mellitus.
In the present study, we observed that expression of microRNA155 was significantly increased in the serum of obese and type 2 diabetes mellitus individuals. Furthermore, we also found a positive correlation between the expression level of microRNA155 and glucose, TG and HDL. As described earlier, microRNA155 is expressed by adipose tissue, thus, differences in body fat distribution are potentially the reason for heightened expression of microRNA155 in these individuals.
According to the study published by Roderburg et al., 37 the expression level of microRNA29 was significantly lower in individuals with abnormal liver function when compared with normal individuals, suggesting that microRNA29 is expressed by the liver. At present, no evidence shows that liver function or liver metabolism differ in obese or type 2 diabetes mellitus patients. Furthermore, in the present study, expression of microRNA29 was found to be significantly higher in the serum of obese and type 2 diabetes mellitus patients when compared with normal weight individuals. Additionally, the expression level of microRNA29 in the serum of obese and type 2 diabetes mellitus patients is positively correlated with TG, cholesterol and HDL. These findings suggest that microRNA29 is a possible risk factor in type 2 diabetes mellitus patients, but the specific molecular mechanism responsible for elevated microRNA29 expression in type 2 diabetes mellitus patients requires further elucidation.
We used target prediction software to predict microRNA155 and microRNA29 target genes. These efforts identified several microRNA155 (MAPK14, MAP3K10, PRKAR2B and DUSP14) and microRNA29 (FADS1 and PEX11A) target genes that function in glucose and/or lipid metabolism. Ectopic expression of microRNA155 or microRNA29 mimics in HepG2 cells resulted in decreased expression of each target gene. Similarly, glucose incorporation was impaired and lipid synthesis was decreased by overexpression of microRNA155 and microRNA29 in HepG2 cells. These findings suggest that microRNA155 inhibits expression of MAPK14, MAP3K10, PRKAR2B and/or DUSP14, and, likewise, microRNA29 negatively regulates FADS1 and PEX11A. These molecular events, in turn, negatively impact glucose and lipid metabolism in type 2 diabetes mellitus patients.
In conclusion, we discovered that microRNA155 and microRNA29 levels are elevated in the serum of type 2 diabetes mellitus patients. Furthermore, we identified and verified relevant microRNA155 and microRNA29 target genes that impact glucose and lipid metabolism, and determined that overexpression of microRNA155 and microRNA29 in HepG2 cells negatively impacts glucose and lipid metabolism. The present study provides new evidence for a molecular mechanism underlying type 2 diabetes mellitus pathology in humans.
DISCLOSURE
The authors declare no conflict of interest.
Supporting information
Table S1 | Refer to the instructions of the microribonucleic acid fluorescence quantitative kit for reaction system in Tiangen.
Table S2 | Please refer to the instruction manual of the microribonucleic acid fluorescence quantitative kit for the amplification program in Tiangen.
Table S3 | Refer to the instructions of the messenger ribonucleic acid fluorescence quantitative kit for reaction system in Qiagen.
Table S4 | Please refer to the instruction manual of the microribonucleic acid fluorescence quantitative kit for the amplification program in Qiagen.
Table S5 | All the primers used in real‐time polymerase chain reaction of the target gene.
Table S6 | Comparison of patient metrics and biochemical parameters among the three study groups.
Figure S1 | Bioinformatics prediction flow chart.
ACKNOWLEDGMENTS
This work was supported by the Natural Science Foundation of China (nos. 81960152, 81660137 and 81900707), the Projects of Shihezi University (ZZZC201701A), Scientific and Technological Projects of the Xinjiang Production and Construction Corps (2018AB018), and Innovation Team in Key Areas of the Xinjiang Production and Construction Corps (2018CB002).
J Diabetes Investig 2021; 12: 165–175
References
- 1. Alberti KG. Screening and diagnosis of prediabetes: where are we headed? Diabetes Obes Metab 2007; 1: 12–16. [DOI] [PubMed] [Google Scholar]
- 2. Xu Y, Wang L, He J, et al Prevalence and control of diabetes in Chinese adults. JAMA 2013; 310: 948–959. [DOI] [PubMed] [Google Scholar]
- 3. Ferré P. Insulin signaling and insulin resistance. Therapie 2007; 62: 277–284. [DOI] [PubMed] [Google Scholar]
- 4. Fonseca‐Alaniz MH, Takada J, Alonso‐Vale MI, et al Adipose tissue as an endocrine organ: from theory to practice. J Pediatr (Rio J) 2007; 23: 83. [DOI] [PubMed] [Google Scholar]
- 5. The GBD 2015 Obesity Collaborators . Health effects of overweight and obesity in 195 countries over 25 years. N Engl J Med 2017; 377: 13–27. [DOI] [PMC free article] [PubMed] [Google Scholar]
- 6. Steppan CM, Bailey ST, Bhat S, et al The hormone resistin links obesity to diabetes. Nature 2001; 409: 307–312. [DOI] [PubMed] [Google Scholar]
- 7. Chen X, Ba Y, Ma L, et al Characterization of microRNAs in serum: a novel class of biomarkers for diagnosis of cancer and other diseases. Cell Res 2008; 18: 997–1006. [DOI] [PubMed] [Google Scholar]
- 8. Thomou T, Mori MA, Dreyfuss JM, et al Adipose‐derived circulating microRNAs regulate gene expression in other tissues. Nature 2017; 542: 450–455. [DOI] [PMC free article] [PubMed] [Google Scholar]
- 9. Fichtlscherer S, Zeiher AM, Dimmeler S. Circulating microRNAs: biomarkers or mediators of cardiovascular diseases? Arterioscler Thromb Vasc Biol 2011; 31: 2383–2390. [DOI] [PubMed] [Google Scholar]
- 10. Mendell JT. MicroRNAs: critical regulators of development, cellular physiology and malignancy. Cell Cycle 2005; 4: 1179–1184. [DOI] [PubMed] [Google Scholar]
- 11. Ortega FJ, Mercader JM, Catalan V, et al Targeting the circulating microRNA signature of obesity. Clin Chem 2013; 59: 781–792. [DOI] [PubMed] [Google Scholar]
- 12. Wu H, Zhou J, Mei S, et al Circulating exosomal microRNA‐96 promotes cell proliferation, migration and drug resistance by targeting LMO7. J Cell Mol Med 2017; 21: 1228–1236. [DOI] [PMC free article] [PubMed] [Google Scholar]
- 13. Ying W, Riopel M, Bandyopadhyay G, et al Adipose tissue macrophage‐derived exosomal microRNAs can modulate in vivo and in vitro insulin sensitivity. Cell 2017; 171: 372–384. [DOI] [PubMed] [Google Scholar]
- 14. Feng Y, Zheng C, Zhang Y, et al Triptolide inhibits preformed fibril‐induced microglial activation by targeting the MicroRNA155‐5p/SHIP1 pathway. Oxid Med Cell Longev 2019; 2019: 1–13. [DOI] [PMC free article] [PubMed] [Google Scholar]
- 15. Duan W, Chen Y, Wang XR, et al MicroRNA‐155 contributes to the occurrence of epilepsy through the PI3K/Akt/mTOR signaling pathway. Int J Mol Med 2018; 42: 1577–1584. [DOI] [PubMed] [Google Scholar]
- 16. Massart J, Sjögren RJO, Lundell LS, et al Altered microRNA‐29 expression in type 2 diabetes influences glucose and lipid metabolism in skeletal muscle. Diabetes 2017; 66: 1807–1818. [DOI] [PubMed] [Google Scholar]
- 17. Estep JM, Goodman Z, Sharma H, et al Adipocytokine expression associated with miRNA regulation and diagnosis of NASH in obese patients with NAFLD. Liver Int Off J Int Assoc Study Liver 2015; 35: 1367–1372. [DOI] [PubMed] [Google Scholar]
- 18. Zhang J, Wang C, Ha X, et al DNA methylation of tumor necrosis factor‐α, monocyte chemoattractant protein‐1, and adiponectin genes in visceral adipose tissue is related to type 2 diabetes in the Xinjiang Uygur population. J Diabet 2017; 9: 699–706. [DOI] [PubMed] [Google Scholar]
- 19. Gao X, Salomon C, Freeman DJ. Extracellular vesicles from adipose tissue—a potential role in obesity and type 2 diabetes? Front Endocrinol 2017; 8: 202. [DOI] [PMC free article] [PubMed] [Google Scholar]
- 20. Fichtlscherer S, De Rosa S, Fox H, et al Circulating microRNAs in patients with coronary artery disease. Circ Res 2010; 107: 677–684. [DOI] [PubMed] [Google Scholar]
- 21. Heneghan HM, Miller N, McAnena OJ, et al Differential miRNA expression in omental adipose tissue and in the circulation of obese patients identifies novel metabolic biomarkers. J Clin Endocrinol Metab 2011; 96: E846–E850. [DOI] [PubMed] [Google Scholar]
- 22. Zhao Y, Rao W, Wan Y, et al Overexpression of microRNA‐155 alleviates palmitate‐induced vascular endothelial cell injury in human umbilical vein endothelial cells by negatively regulating the Wnt signaling pathway. Mol Med Rep 2019; 20: 3527–3534. [DOI] [PMC free article] [PubMed] [Google Scholar] [Retracted]
- 23. Yin S, Yang S, Pan X, et al MicroRNA‐155 promotes ox‐LDL‐induced autophagy in human umbilical vein endothelial cells by targeting the PI3K/Akt/mTOR pathway. Mol Med Rep 2018; 18: 2798–2806. [DOI] [PMC free article] [PubMed] [Google Scholar]
- 24. Xia J, Li D, Zhu X, et al Upregulated miR‑665 expression independently predicts poor prognosis of lung cancer and facilitates tumor cell proliferation, migration and invasion. Oncol Lett 2020; 19: 3578–3586. [DOI] [PMC free article] [PubMed] [Google Scholar]
- 25. Wu Y, Wan X, Zhao X, et al MicroRNA‐143 suppresses the proliferation and metastasis of human gastric cancer cells via modulation of STAT3 expression. Am J Transl Res. 2020;12: 867. [PMC free article] [PubMed] [Google Scholar] [Retracted]
- 26. Wang YP, Li HQ, Chen JX, et al Overexpression of XIST facilitates cell proliferation, invasion and suppresses cell apoptosis by reducing radio‐sensitivity of glioma cells via miR‐329‐3p/CREB1 axis. Eur Rev Med Pharmacol Sci 2020; 24: 3190–3203. [DOI] [PubMed] [Google Scholar]
- 27. Zhang P, Jingjing D, Wang L, et al MicroRNA‐143a‐3p modulates preadipocyte proliferation and differentiation by targeting MAPK7. Biomed Pharmacother 2018; 108: 531–539. [DOI] [PubMed] [Google Scholar]
- 28. Jordan SD, Krüger M, Willmes DM, et al Obesity‐induced overexpression of microRNA‐143 inhibits insulin‐stimulated AKT activation and impairs glucose metabolism. Nat. Cell Biol 2011; 13: 434–446. [DOI] [PubMed] [Google Scholar]
- 29. Zhou T, Meng X, Che H, et al Regulation of insulin resistance by multiple microRNAs via targeting the GLUT4 signalling pathway. Cell. Physiol Biochem 2016; 38: 2063–2078. [DOI] [PubMed] [Google Scholar]
- 30. Prabu P, Poongothai S, Shanthirani CS, et al Altered circulatory levels of miR‐128, BDNF, cortisol and shortened telomeres in patients with type 2 diabetes and depression. Acta Diabetol 2020; 57: 799–807. [DOI] [PubMed] [Google Scholar]
- 31. Poy MN, Eliasson L, Krutzfeldt J, et al A pancreatic islet‐specific microRNA regulates insulin secretion. Nature 2004; 432: 226–230. [DOI] [PubMed] [Google Scholar]
- 32. Qi H, Yao L, Liu Q. MicroRNA‐96 regulates pancreatic β cell function under the pathological condition of diabetes mellitus through targeting Foxo1 and Sox6. Biochem Biophys Res Commun 2019; 519: 294–301. [DOI] [PubMed] [Google Scholar]
- 33. Xiao D, Zhou T, Fu Y, et al MicroRNA‐17 impairs glucose metabolism in insulin‐resistant skeletal muscle via repressing glucose transporter 4 expression. Eur J Pharmacol 2018; 838: 170–176. [DOI] [PubMed] [Google Scholar]
- 34. Xu L, Li Y, Yin L, et al Peng J.miR‐125a‐5p ameliorates hepatic glycolipid metabolism disorder in type 2 diabetes mellitus through targeting of STAT3. Theranostics 2018; 8: 5593–5609. [DOI] [PMC free article] [PubMed] [Google Scholar]
- 35. Yan W, Yang X, Zheng Y, et al The metabolic syndrome in Uygur and Kazak populations. Diabetes Care 2005; 10: 2554–2555. [DOI] [PubMed] [Google Scholar]
- 36. Zhang J, Zhang Z, Ding Y, et al Adipose tissues characteristics of normal, obesity, and type 2 diabetes in Uygurs population. J Diabet Res 2015; 2015: 905042. [DOI] [PMC free article] [PubMed] [Google Scholar]
- 37. Roderburg C, Urban G‐W, Bettermann K, et al Micro‐RNA profiling reveals a role for miR‐29 in human and murine liver fibrosis. Hepatology 2011; 53: 209–218. [DOI] [PubMed] [Google Scholar]
Associated Data
This section collects any data citations, data availability statements, or supplementary materials included in this article.
Supplementary Materials
Table S1 | Refer to the instructions of the microribonucleic acid fluorescence quantitative kit for reaction system in Tiangen.
Table S2 | Please refer to the instruction manual of the microribonucleic acid fluorescence quantitative kit for the amplification program in Tiangen.
Table S3 | Refer to the instructions of the messenger ribonucleic acid fluorescence quantitative kit for reaction system in Qiagen.
Table S4 | Please refer to the instruction manual of the microribonucleic acid fluorescence quantitative kit for the amplification program in Qiagen.
Table S5 | All the primers used in real‐time polymerase chain reaction of the target gene.
Table S6 | Comparison of patient metrics and biochemical parameters among the three study groups.
Figure S1 | Bioinformatics prediction flow chart.


