

Abstract
Objective
Elevated CV reactivity to, and reduced recovery from, challenging events may increase the risk of CVD and exercise training may reduce this reactivity. However, in a randomized controlled trial of aerobic vs. strength training in sedentary, healthy young adults, we found no training group differences in reactivity or recovery. Because strength training also may have a reactivity-reducing effect, we conducted a secondary analysis of data from another trial, this time with a wait-list control condition.
Methods
119 healthy, young, sedentary adults were randomized to a 12-week aerobic training program or wait-list control. Before (T1) and after (T2) training and after 4 weeks of sedentary deconditioning (T3), we measured heart rate (HR), heart rate variability (HRV), and blood pressure (BP) at rest and in response to and recovery from psychological and orthostatic challenge. Data were analyzed using a group (aerobic vs. waitlist) by session (T1, T2, and deconditioning), by period (baseline, psychological challenge, recovery, standing) 3-way ANOVA with prespecified contrasts.
Results
Aerobic capacity significantly increased at T2 and decreased at T3 only in the aerobic training group. The groups did not differ on HR, HRV, or BP reactivity to or recovery from challenge. Without baseline adjustment, there were no significant treatment differences in response to challenges. With baseline adjustment, there were significant treatment by session effects for HR (Cohen’s d=0.54, p=.002), SBP (d=0.44, p=.014), DBP (d=0.74, p=.002), and rMSSD (d=0.48, p=.006) reactivity from T1 to T2 only for orthostatic challenge: at T2, reactivity in the aerobic group was nonsignificantly reduced, compared to T1. In the waitlist group, reactivity significantly increased after T1.
Conclusions
This study raises further doubt about attenuation of CV reactivity or enhancement of recovery as a cardioprotective mechanism of aerobic exercise training.
Clinical Trial Registration—
ClinicalTrials.gov Unique identifier: NCT01335737
Keywords: Exercise, heart rate, autonomic nervous system, reactivity, randomized controlled trial
INTRODUCTION
Considerable, but not unequivocal, evidence demonstrates that cardiovascular (CV) reactivity to challenge predicts the development of coronary atherosclerosis. For example, blood pressure (BP) reactivity to a videogame but not a star tracing challenge predicted coronary artery calcification after 13-year follow-up in 2816 participants in the CARDIA study (1). In 756 men in the Kuopio Ischemic Heart Disease (KIHD) study, greater systolic BP but not HR reactivity to mental challenge prospectively predicted IMT at 7-year follow-up (2). Reviews of the literature conclude that there is reasonable evidence that CV reactivity predicts subclinical and clinical CVD (3, 4). However, recent examination of the reactivity hypothesis has suggested that it is reduced rather than exaggerated reactivity that elevates risk and some evidence supports this position (5). For example, heart rate (HR), respiratory sinus arrhythmia (RSA), and pre-ejection period (PEP) reactivity to mental arithmetic and a public speaking task, reflecting increased parasympathetic and decreased sympathetic reactivity, predicted lower carotid intima-medial thickness (IMT) after 2-year follow-up in 66 healthy young adults in the Cardiovascular Risk in Young Finns study (6).
However, other studies fail to show these relationships. In 1470 adults from the Nova Scotia Heart Health survey, BP reactivity to an anger provocation did not predict 10-year incident cardiovascular disease (7). In 158 healthy adolescents, HR and SBP and DBP reactivity to laboratory stress was unrelated to carotid intima-medial thickness (IMT) (8) but increases in DBP reactivity over the preceding 3 years were associated with IMT.
If CV reactivity to challenge, psychological and otherwise, is a mechanism of the pathogenesis of CVD, then interventions to reduce this reactivity may have therapeutic potential. One such intervention appears to be aerobic exercise training. Observational studies generally support this conclusion. In a cross-sectional comparison of endurance trained, resistance trained, and untrained men, the HR increase in response to the Trier Social Stress Task (TSST) was greatest in the untrained men with the two trained groups not differing from each other (9). Aerobically trained men had lower HR responses to the TSST compared to untrained men (10). In contrast, higher fit 30–50 year-old women had a greater HR response to the TSST than low fit women (11).
12 weeks of aerobic exercise training resulted in reduced HR reactivity to the TSST compared to relaxation training or a wait list condition (12). On the other hand, there was no effect of aerobic exercise training on PEP or low frequency BP variability compared to a strength training condition (13). Some (14, 15) but not all (16) meta-analyses support this hypothesis. Most studies addressing this matter are either cross-sectional or naturalistic follow-up studies rather than randomized controlled trials.
We previously reported that aerobic training sufficient to improve cardiorespiratory fitness did not attenuate HR, heart rate variability (HRV), or blood pressure (BP) reactivity to or recovery from psychological and orthostatic challenge compared to a strength training control group (17). Strength training was chosen as a control condition designed to match participant involvement but without eliciting improvements in aerobic capacity. Some evidence suggests, however, that strength training (18, 19) also may influence reactivity to challenge and as such, may have masked the reactivity-attenuating effect of aerobic training.
To address the possibility that the selection of a strength training control condition may have masked an aerobic training-induced reduction in CV reactivity to challenge, we conducted another randomized trial of aerobic conditioning, this time comparing it to a wait-list control condition. In addition, in the current study we explored the possibility that in our previous study, we did not adjust measures of reactivity for baseline levels of HR, HRV, and BP which also may have concealed treatment effects. We tested whether exercise would have any meaningful effect on reactivity or recovery.
METHODS
Study Design
The study protocol is depicted in the Consort Diagram (see Figure 1). The study was a randomized controlled trial of aerobic training compared to a wait-list control condition on HR, BP, and HRV at rest and in response to challenge. All participants provided informed consent. The Institutional Review Board of the New York State Psychiatric Institute approved this study, which was registered on at ClinicalTrials.Gov: NCT01335737. Findings reported here are the result of a secondary analysis of data from this trial, whose main findings have previously been published (20).
Figure 1.

CONSORT Diagram
In overview, after initial eligibility screening and consent, participants completed a two-week run-in period, followed by initial (time 1 (T1) mood and physiological assessments including cardiopulmonary exercise testing (CPET). (The run-in period and assessment procedures are described below.) Participants who completed these steps then were randomized to wait-list or exercise groups. Mood and physiological assessments including CPET were repeated at the end of 12 weeks (time 2 (T2)) and again after 4 weeks of sedentary deconditioning (time 3(T3)). Assessment of all outcome variables was conducted by study staff blinded to group assignment.
Study Participants
We sought healthy, sedentary young adults, 18–45 years of age. Participants were recruited from the Columbia University Medical Center/New York Presbyterian Hospital community by posted flyers. Potential participants completed a phone screening including the Baecke Physical Activity assessment (21) to exclude regular exercisers, defined as a score of ≥ 10 on this scale (range 3–15 points). Qualifying participants provided informed consent, then were further screened for medical conditions that contraindicated exercise training, use of hormonal birth control, and BMI >33 or <18 kg/m2. After a maximal cardiopulmonary exercise test (CPET), those who qualified as no better than average fitness by American Heart Association standards (VO2peak < 43 ml/kg/min for men, < 37 ml/kg/min for women) were eligible to continue to the two-week run-in period described below.
Randomization
Randomization to either the 12-week aerobic training program or a waitlist control condition employed random block assignment stratified by sex. Participants were randomized in a 1:1 allocation ratio.
Mood and Physiological Assessments
At each of the three measurement sessions, participants provided a fasting blood sample, then ate a light breakfast, then completed several mood inventories and participated in a psychophysiology stress challenge described below. Women were scheduled for testing during their mid-luteal menstrual phase to control for effects of menstrual cycle variation on cardiac autonomic control, as described below (22).
Physical activity outside of the training sessions was monitored using a pedometer (Omron HJ-710ITTFFP) to assess potential changes in daily levels of physical activity. All participants in both the training and wait list groups were required to wear the step counter throughout the 16 weeks of training and deconditioning to determine that they did not change their regular level of physical activity. Participants randomized to the aerobic training program were instructed to not wear their pedometers during exercise sessions.
Compensation
Participants received up to $210 compensation for the various testing sessions in the study. To encourage adherence, those who completed 85% of their training sessions received 2 months of bonus gym membership. Waitlist participants received 5 months of gym membership after their final measurement session.
Determination of Aerobic Fitness
Maximum aerobic fitness (VO2peak) was measured by a graded exercise test on an Ergoline 800S electronic-braked cycle ergometer (SensorMedics Corp., Anaheim, CA). Each subject had their peak ventilatory capacity (Maximum Voluntary Ventilation (MVV) determined before the exercise test via a Vmax Encore System (Sensormedics, Yorba Linda, Ca). An individualized ramping protocol (10, 15, or 20 watts each two minutes) was selected according to each participant’s perceived exercise capacity (ascertained by an exercise physiologist based on the participant’s age, prior exercise history, and familiarity with cycling) to yield a test duration of approximately 10 minutes. Each subject began the test with a 3-minute warm-up against no resistance, and the work rate was then linearly increased at the individualized ramp rate until volitional fatigue. Peak exercise capacity was determined by having all participants achieve at least 2 of the following: greater than 85% peak predicted heart rate (220-age), maximal exertion with limitation due to dyspnea, maximum exertion with muscle fatigue, respiratory exchange ratio greater than 1.10, or a plateau in the slope of the VO2-work-rate relationship (23). Minute ventilation, expired oxygen (O2), and carbon dioxide (CO2) were measured using Vmax Encore Metabolic system (Sensormedics, Inc, Loma Linda, Ca). The flow sensor and the gas analyzer were calibrated against known medical grade gases before each test. VO2peak values were derived by applying a 15-breath moving average to breath-by-breath VO2 value files to smooth the VO2 measured breath-by-breath so that the true peak oxygen consumption could be identified (24). The presence of outliers in VO2 values led us then to decide on using the 15-breath moving median and also limiting the location of the VO2peak to the last minute of exercise. Anaerobic threshold was determined for each subject using the V-slope technique (25). Identical test procedures were carried out at the end of the training and deconditioning phases of the trial. Initial cutoffs for VO2peak were set at (60-(0.55*Age)) for men and (48-(0.37*Age)) for women (26). To account for normal variation of VO2peak scores in the below average fitness population, we added 30% to each score and the resultant sum defined the cutoff for a sedentary lifestyle. Participants qualifying as below average fitness by American Heart Association standards (VO2peak < 43 ml/kg/min for men, < 37 mg/kg/min for women) proceeded to the 2-week run-in stretching period.
Run-in Stretching Period
During this two-week period, participants came to the Fitness Center four times/week for 30 minutes of stretching. Each participant was assigned a research assistant “coach” who provided detailed instruction on stretches, consisting of arm circles, neck rotations, toe reach, gluteal stretches, lateral leg swings, Achilles stretch and ankle rolls. All participants wore Polar heart rate monitors during the stretching sessions. Coaches monitored participants’ adherence to the stretching protocol via gym attendance records and HR monitor data. This run-in period was used to screen out participants who were likely to be unable to adhere to the training program. Only those participants who attended at least 7 sessions were permitted to continue in the study.
Aerobic Training Program
For 12 weeks, participants randomized to aerobic training group came to the Fitness Center for 4 sessions/week according to a schedule they determined. Their coaches provided them with guidelines specifying their training goals to assure that they exercised at the appropriate level of intensity.
All training sessions consisted of 10–15 minutes of warm-up and cool down and 30–40 minutes of workout. Exercise participants trained at 55–65%, 65–75%, and at 80% of maximum heart rate based on study entry CPET in weeks 1–2, 3–4, and the remaining weeks, respectively.
To exercise at their target HR, participants wore a Polar Electro model RS400 heart rate monitor during each training session. This monitor provided a digital display of HR and recorded HR throughout the training session. At the end of each session, participants downloaded the data from the monitor into a computer located in the Fitness Center. Coaches instructed participants on the use of the monitors and on how to download data. These data were used to verify that they trained as prescribed.
Adherence to the training programs were documented by weekly logs, computerized attendance records at the facility, and data from HR monitors used during each training session. Participants were contacted on a weekly basis by their coaches to monitor their progress. If the performance of participants in the aerobic training condition fell out of range (described below), they were contacted more frequently until they returned to prescribed training levels.
Sedentary Deconditioning
After completion of pre-training and post-training testing, aerobic training group participants refrained from any type of exercise for a 4-week period. During this time, they were contacted by their coaches on a weekly basis to encourage adherence to this deconditioning phase of the study. This deconditioning phase was added to examine whether the effects of aerobic exercise training were reversible.
Waitlist Control Condition
Participants randomized to the waitlist group maintained their inactive lifestyle after their qualifying testing session for 12 weeks plus the 4-week period corresponding to the deconditioning period for a total of 16 weeks.
Psychophysiology Testing Sessions
After the run-in period, qualifying participants arrived at the Behavioral Medicine Laboratory at 8 am after an overnight fast. 45 ml of venous whole blood was drawn for cytokine and hormone analysis (20). After the blood draw, they received a light breakfast with no caffeinated beverages. Waist circumference was measured with a Gulick anthropometric tape. Height was measured using the Seca 214 Portable Height Rod (Seca Corp., Hamburg, Germany). Weight and body composition were measured using a Tanita BF-350 monitor (Tanita UK Ltd., Middlesex, UK). Participants completed the Block Brief 2000 FFQ (NutritionQuest, Berkeley CA) to assess diet, followed by questionnaires to measure anxiety (27), hostility (28), depression (Beck Depression Inventory), and anger (29).
After completing the questionnaires, ECG electrodes were placed on the right shoulder, on the left anterior axillary line at the 10th intercostal space and in the right lower quadrant. Stretch bands were placed around the subject’s chest and abdomen for measurement of respiration (see below). A Nexfin blood pressure cuff was placed on the middle finger of the non-dominant hand to measure beat-to-beat blood pressure. Participants were tested at three different time points: before training (baseline), after training (post-training), and after deconditioning (post-deconditioning).
After instrumentation, the subject rested quietly in a comfortable chair during an 11 min baseline period followed by a 6-min mental arithmetic task and a 6-min Stroop color word matching task in counterbalanced order, each followed by a 6-min recovery period. Then to test the effect of exercise training on responses to orthostatic challenge, the subject was moved to the standing position, monitoring instruments were recalibrated, and data were collected for 6 min. A numeric keypad for responding to the arithmetic and Stroop tasks was secured in a comfortable position relative to the dominant hand. Participants were instructed to remain silent throughout the procedures.
Psychological Stressors
Mental Arithmetic
In this task, participants were presented with a four digit number on the computer monitor and were instructed to subtract serially by 7’s starting with this number, which disappeared after the first answer was entered. At one min intervals, participants received verbal prompts, e.g., “please subtract faster.” This task was not paced by the computer but participants were instructed to subtract as quickly and accurately as possible.
Stroop Color-Word Task
In this version of the Stroop task, the computer monitor presented color name words (blue, green, yellow, red) in a color which was either congruent or incongruent with the name. The task was to press a key on the keypad corresponding to the color of the letters, not the color name. The task was paced by the computer and an incorrect response or failure to respond rapidly enough resulted in a message indicating “incorrect” on the screen; pacing was automatically adjusted to enable participants to achieve a 67% correct response rate.
Measurement of Cardiac Autonomic Modulation
Analog ECG signals were digitized at 500 Hz by a National Instruments 16 bit A/D conversion board and passed to a microcomputer. The ECG waveform was submitted to an R-wave detection routine implemented by custom-written software, resulting in an RR interval series. Errors in marking of R-waves were corrected by visual inspection. Ectopic beats were corrected by interpolation.
Heart Rate Variability
Mean HR and the standard deviation of the RR interval (SDRR), the root mean squared successive difference (rMSSD), and spectral power in the low (0.04–0.15 Hz (LF)) and high (0.15–0.40 Hz (HF)) frequency bands were computed. Spectra were calculated on 300 second epochs using an interval method for computing Fourier transforms similar to that described by DeBoer, Karamaker, and Strackee (30). Prior to computing Fourier transforms, the mean of the RR interval series was subtracted from each value in the series and the series then was filtered using a Hanning window (31) and the power, i.e., variance (in msec2), over the LF and HF bands was summed. Estimates of spectral power were adjusted to account for attenuation produced by this filter (31).
Measurement of Blood Pressure
Blood pressure was measured on a beat-to-beat basis by a Nexfin Model 1 monitor. Except for the last 30 sec of each period of data acquisition, the servo self-adjust mechanism was disabled. The analog pressure waveform was digitized at 500 Hz and collected by the microcomputer. A series of systolic and diastolic values were produced by another peak detection program. Errors in marking systole and diastole were corrected interactively using this program. Files of SBP and DBP then were created.
Computation of Reactivity and Recovery
For each variable, reactivity to each task was computed as the difference between the mean value during the task and the mean of the preceding baseline. For each baseline, the two 300 sec epochs were averaged to yield a single value. To increase response stability, data from the arithmetic and Stroop tasks were averaged, as were the recovery periods that followed them (32). To allow for complete equilibration to the upright position, data from the first 5 min epoch after standing were excluded from analysis. No recovery data were collected after standing.
Statistical Analysis
In this secondary analysis, pre-training (T1) demographics were described for each treatment group, using frequencies and proportions for categorical variables, means and standard deviations for normally-distributed continuous variables, and medians and interquartile ranges for continuous variables with skewed distributions. All variables were examined for distribution and outliers prior to analysis.
Reactivity to psychological challenge, recovery from psychological challenge, and reactivity to orthostatic challenge were computed for each of the seven outcomes: HR, SBP, DBP, ln HF HRV, ln LF HRV, ln SDRR, and ln rMSSD. Indices of HRV were log-transformed in the analyses to account for the right-skewed nature of the outcomes. For each outcome, a 3-way ANOVA was preformed between treatment group (aerobic training vs waitlist), session (T1: pre-training, T2: post-training, and T3: deconditioning), and period (Baseline, Math/Stroop, Recovery, and Standing). The models were fit to each outcome using generalized estimating equations with an autoregressive covariance structure to account for within subject correlation. Each model contained pre-specified contrasts to assess reactivity and recovery between the periods of interest. The pre-specified contrasts for reactivity to psychological challenge assessed the differences in outcome value from Baseline period to Math/Stroop period between aerobic training group compared to waitlist from T1 to T2 (Contrast 1) and from T2 to T3 (Contrast 2). Recovery from psychological challenge contrasts assessed the differences in outcome value from Recovery to Math/Stroop between the aerobic training group compared to waitlist from T1 to T2 (Contrast 3), and from T2 to T3 (Contrast 4). Finally, reactivity to orthostatic challenge assessed the differences in outcome value from Baseline period to Standing between the aerobic training group compared to waitlist from T1 to T2 (Contrast 5) and from T2 to T3 (Contrast 6). Cohen’s d effect sizes were computed for all pre-specified contrasts with a value of 0.2 representing a small effect, 0.5 representing a moderate effect, and 0.8 representing a large effect. Partial F-tests were run to test the joint significance among reactivity contrasts and among recovery contrasts.
Additionally, the analyses described above were run using a more modern, complex approach that allows adjustment of baseline period values of the outcomes within each session. These models were similar to those described above except that the within-session baseline period values were included as a covariate (to account for different within-session baselines between participants) as opposed to a dependent variable. The same reactivity and recovery pre-specified contrasts as above were then computed using baseline grand mean centering where both the outcome and the within-session baseline period covariate were centered at the grand within-session mean for the baseline period (20).
All analyses were run in SAS ® 9.4. Analyses were done on the intention-to-treat (ITT) sample, and all statistical tests were two-sided with significance level of 5%.
RESULTS
Sample Recruitment and Adherence
We screened 991 potential participants, of whom 119 were recruited and randomized (63 women, 56 men). Of the 60 participants randomized to the aerobic training condition, 16 dropped out during the training and before T2 testing. An additional 5 participants dropped out during the sedentary deconditioning phase. Only 1 participant in the waitlist condition dropped out, between T1 and T2 testing. In the aerobic exercise group, mean (SD) adherence to training session attendance was 33.5 (17.4)/48 (70%), and among T2 completers, 45 participants attended a mean (S.D.) of 39.8 (13.6) of the scheduled 48 training sessions (83%). Among the 40 participants who completed training and all 3 testing sessions, the attendance rate was 90%.
In the aerobic exercise group for the ITT sample (n=60), the median number of days between the last completed exercise training session and post-training (T2) CPET was 4 days (IQR: 2–6 days).
Adverse Events
There were no protocol-related adverse events.
Demographics and Baseline Physiology
Time 1 demographic characteristics as well as measures of aerobic fitness and inflammation are presented for each group in Table 1. There were no significant differences between the aerobic training and waitlist groups in any of the T1 measures. The mean (S.D.) age of participants in both groups was 31 (6) years, and the mean BMI was 25 (4) kg/m2. Participants were 33.6% White, 27.7% Asian, 17.6% Black or African American, 0.8% Native Hawaiian or Pacific Islander, and 20.2% other races. Baseline physiology is also described in Table 1, for each treatment group, and for each of the three timepoints.
Table 1.
Demographic and T1 characteristics of the participants randomized to exercise and waitlist group (N=119)
| Waitlist (n=59) |
Aerobic Training (n=60) |
|||
|---|---|---|---|---|
| N | Mean (SD) Median (IQR) or n (%) |
N | Mean (SD) Median (IQR) or n (%) |
|
| Age (years) | 59 | 31.4 (6.2) | 60 | 31.2 (5.7) |
| Gender | 59 | 60 | ||
| Male | 28 (47.5%) | 28 (46.7%) | ||
| Female | 31 (52.5%) | 32 (53.3%) | ||
| BMI (kg/m2) | 59 | 24.9 (3.8) | 59 | 24.9 (3.8) |
| Body Fat % | 56 | 25.0 (9.5) | 58 | 25.9 (9.7) |
| Race | 59 | 60 | ||
| Asian | 18 (30.5%) | 15 (25.0%) | ||
| Native Hawaiian or Pacific Islander | 0 (0.0%) | 1 (1.7%) | ||
| Black or African American | 11 (18.6%) | 10 (16.7%) | ||
| White | 20 (33.9%) | 20 (33.3%) | ||
| Other | 10 (16.9%) | 14 (23.3%) | ||
| Ethnicity | 59 | 60 | ||
| Hispanic | 12 (20.3%) | 19 (31.7%) | ||
| Not Hispanic | 47 (79.7%) | 41 (68.3%) | ||
| T1 Baseline Physiology Measures | ||||
| Heart Rate (bpm) | 57 | 67.17 (9.21) | 60 | 65.29 (7.79) |
| Diastolic Blood Pressure (mmHg) | 50 | 63.48 (8.18) | 51 | 64.44 (8.13) |
| Systolic Blood Pressure (mmHg) | 50 | 113.48 (15.86) | 51 | 114.4 (15.09) |
| High Frequency Heart Rate Variability* | 57 | 612.42 (319.13–1214.87) | 60 | 843.69 (390.04–1467.26) |
| Low Frequency Heart Rate Variability* | 57 | 695.92 (455.18–1519.53) | 60 | 835.99 (447.64–1504.62) |
| Standard Deviation of RR Intervals* | 57 | 59.11 (41.68–71.4) | 60 | 58.95 (47.51–74.52) |
| Root Mean Squared Successive Difference* | 57 | 38.75 (27.84–55.14) | 60 | 46.41 (32.76–64.75) |
| T2 Baseline Physiology Measures | ||||
| Heart Rate (bpm) | 53 | 66.28 (8.61) | 44 | 64.28 (9.42) |
| Diastolic Blood Pressure (mmHg) | 54 | 64.21 (12.99) | 40 | 62.55 (11.08) |
| Systolic Blood Pressure (mmHg) | 54 | 114.5 (15.1) | 40 | 114.31 (15.69) |
| High Frequency Heart Rate Variability* | 53 | 648.7 (283.45–1270.54) | 44 | 850.7 (371.01–1616.32) |
| Low Frequency Heart Rate Variability* | 53 | 773.35 (359.83–1130.94) | 44 | 992.13 (460.5–1439.27) |
| Standard Deviation of RR Intervals* | 53 | 55.49 (42.68–67.15) | 44 | 58.3 (45.34–77.13) |
| Root Mean Squared Successive Difference* | 53 | 39.82 (28.97–59.22) | 44 | 47.23 (32.14–63.21) |
| T3 Baseline Physiology Measures | ||||
| Heart Rate (bpm) | 56 | 65.29 (7.69) | 40 | 64.43 (9.08) |
| Diastolic Blood Pressure (mmHg) | 55 | 61.49 (8.95) | 34 | 57.5 (9.33) |
| Systolic Blood Pressure (mmHg) | 55 | 112.14 (12.04) | 34 | 108.9 (15.51) |
| High Frequency Heart Rate Variability* | 56 | 694.88 (424.1–1284.21) | 40 | 813.93 (413.34–1862.06) |
| Low Frequency Heart Rate Variability* | 56 | 809.95 (514.42–1375.32) | 40 | 1050.52 (455.2–1476.16) |
| Standard Deviation of RR Intervals* | 56 | 59.86 (47.05–72.4) | 40 | 62.98 (48.98–74.43) |
| Root Mean Squared Successive Difference* | 56 | 46.38 (33.31–57.63) | 40 | 45.23 (33.88–72.09) |
Median and IQR are presented for outcomes that had skewed distribution
Effect of Training on Aerobic Capacity
Full results for the effect of training on aerobic capacity are reported elsewhere (20). In brief, from T1 to T2, VO2peak increased on average by 4.13 (SE=0.52) ml/kg/min in the aerobic training group (p<.001) and did not significantly change in the wait list group (p = .08). There was a significant effect of group assignment on the change in VO2peak from T1 to T2 (mean (SE) difference of differences, 5.00 (0.72) ml/kg/min, (p<.001). Controlling for T1 values, the 2-way interaction between treatment group and time (T2 vs T3) was not significant, indicating that treatment differences at T2 and T3 are not significantly different (p=.19). After additionally adjusting for age, sex, and T1 body fat percentage, the adjusted model results were similar to the unadjusted model results except for a reduction in VO2peak by 1.00 ml/kg/min from T1 to T2 in the waitlist group that reached statistical significance (p=.045).
Effect of Training on Reactivity and Recovery from Challenge without Baseline Adjustment
Figures 2 and 3 present the model estimated means and 95% confidence intervals with observed means of within-sesson baseline period adjustment for the waitlist group (left panel) and in the aerobic training group (right panel) for all HR, BP, and HRV outcomes by period and session. The tasks behaved as expected. From Baseline, mean HR, SBP, and DBP increased in response to the Math/Stroop tasks (reactivity to psychological challenge), decreased during Recovery, and then increased in response to Standing (reactivity to orthostatic challenge). HRV outcomes also behaved as expected, with decreases in response to psychological and orthostatic challenge, and an increase during recovery from psychological challenge.
Figure 2.
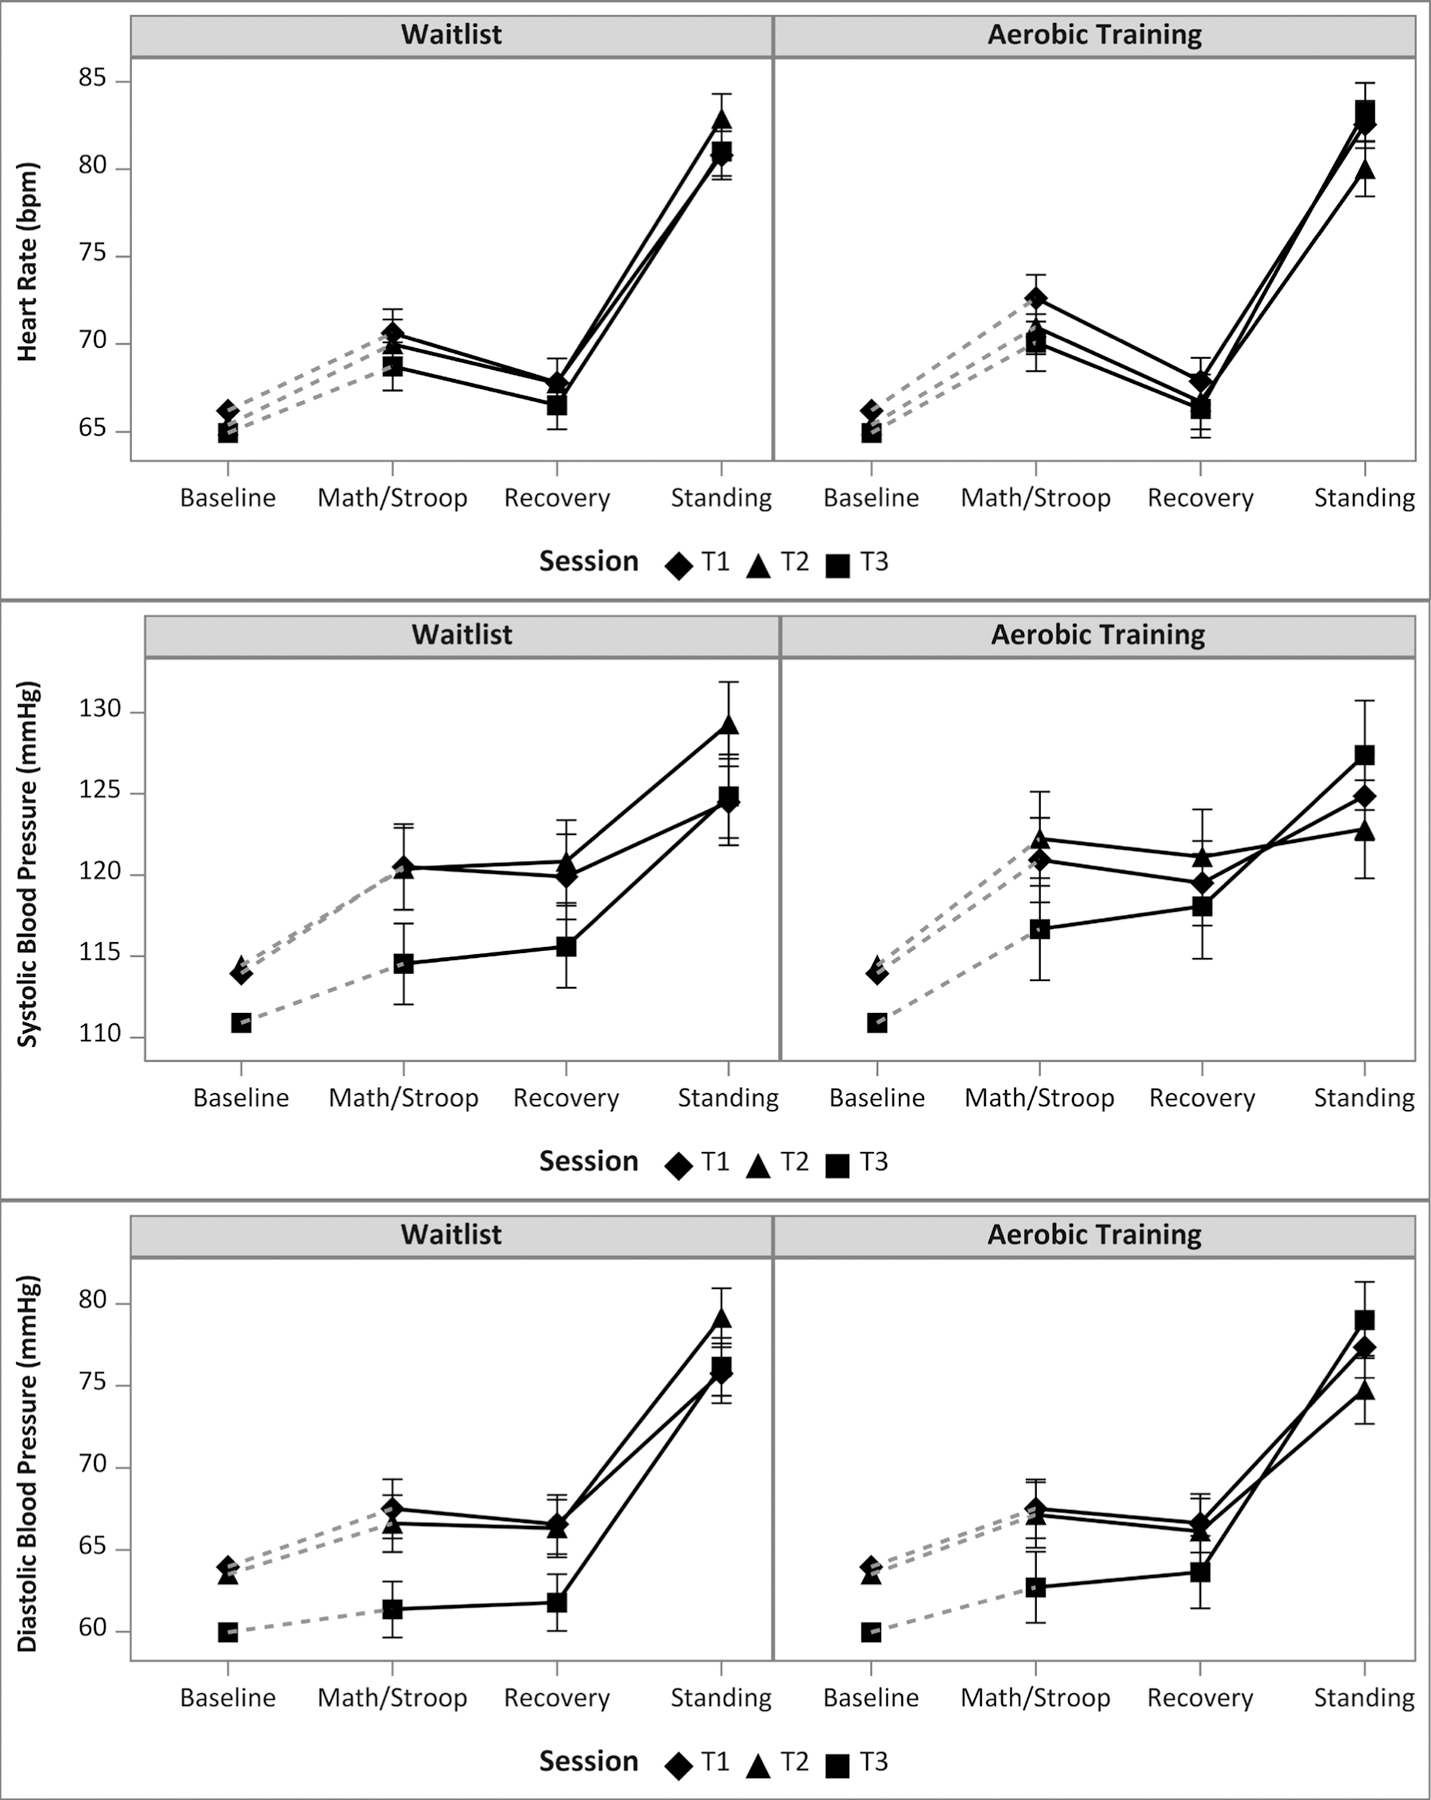
Observed within-session baseline period mean values plotted with model estimated mean values and corresponding 95% confidence intervals by training group, period and session for (a) Heart Rate, (b) Systolic Blood Pressure, and (c) Diastolic Blood Pressure. Dashed lines represent the within-session change from observed baseline period mean and model estimated math/Stroop mean. Solid lines represent the model estimated within-session change between math/Stroop, recovery, and standing.
Figure 3.

Observed within-session baseline period mean values plotted with model estimated mean values and corresponding 95% confidence intervals by training group, period and session for (a) ln HF HRV, (b) ln LF HRV, (c) ln SDRR, (d) ln RMSSD. Dashed lines represent the within-session change from observed baseline period mean and model estimated math/Stroop mean. Solid lines represent the model estimated within-session change between math/Stroop, recovery, and standing.
Table 2 presents the Type III tests of fixed effects for all ANOVA models without baseline adjustment. There were no significant partial F-tests for reactivity and recovery to psychological or orthostatic challenge in any of the HR, BP, or HRV outcomes, suggesting no treatment differences in reactivity or recovery from challenge throughout the study. Model estimates of the pre-specified contrasts comparing reactivity and recovery between groups across time are displayed in Supplemental Table 1.
Table 2.
Effects of aerobic exercise training versus waitlist control on physiological responses to psychological and orthostatic challenge without baseline adjustment
| HR | ln HF HRV | ln LF HRV | SBP | DBP | ln SD | ln RMSSD | ||||||||||
|---|---|---|---|---|---|---|---|---|---|---|---|---|---|---|---|---|
| F | DF a | p | F | p | F | p | F | DF b | p | F | p | F | p | F | p | |
| Full F-tests | ||||||||||||||||
| Session | 0.95 | (2, 191) | .388 | 1.41 | .248 | 0.56 | .574 | 2.36 | (2, 186) | .098 | 5.65 | .004 | 0.56 | .574 | 0.87 | .420 |
| Group | 0.73 | (1, 116) | .394 | 1.68 | .198 | 2.13 | .148 | 0.34 | (1, 116) | .56 | 1.51 | .222 | 2.13 | .148 | 1.66 | .200 |
| Period | 771.13 | (3, 348) | <.001 | 306.44 | <.001 | 102.68 | <.001 | 83.25 | (3, 345) | <.001 | 281.85 | <.001 | 102.68 | <.001 | 232.16 | <.001 |
| Group*Session | 1.12 | (2, 191) | .328 | 0.15 | .858 | 0.26 | .771 | 0.14 | (2, 186) | .867 | 1.48 | .229 | 0.26 | .771 | 0.05 | .948 |
| Session*Period | 1.06 | (6, 563) | .387 | 0.35 | .910 | 2.95 | .008 | 1.65 | (6, 504) | .131 | 2.9 | .009 | 2.95 | .008 | 0.56 | .76 |
| Group*Period | 4.19 | (3, 348) | .006 | 3.18 | .024 | 0.6 | .614 | 0.83 | (3, 345) | .476 | 0.36 | .784 | 0.6 | .614 | 0.56 | .642 |
| Group*Session* Period | 0.91 | (6, 563) | .486 | 0.45 | .846 | 0.52 | .796 | 0.66 | (6, 504) | .679 | 0.64 | .697 | 0.52 | .796 | 1.06 | .385 |
|
Partial F-testsc | ||||||||||||||||
| Psychological Challenge | ||||||||||||||||
| Reactivity | 0.13 | (2, 563) | .877 | 0.02 | .976 | 0.71 | .493 | 0.17 | (2, 504) | .844 | 0.37 | .693 | 0.71 | .493 | 0.11 | .896 |
| Recovery | 0.02 | (2, 563) | .975 | 0.22 | .805 | 0.01 | .989 | 0.25 | (2, 504) | .776 | 0.23 | .798 | 0.01 | .989 | 1.15 | .317 |
| Orthostatic Challenge | ||||||||||||||||
| Reactivity | 1.46 | (2, 563) | .233 | 0.54 | .583 | 0.04 | .964 | 0.99 | (2, 504) | .373 | 1.25 | .289 | 0.04 | .964 | 0.14 | .867 |
HR = heart rate, ln = natural log transformation, HF = high frequency, LF = low frequency, SBP = systolic blood pressure, DBP = diastolic blood pressure, SD = standard deviation of RR intervals, RMSSD = root mean squared successive difference.
Period = period within the psychophysiological protocol (baseline, psychological challenge, recovery, orthostatic challenge)
Session = measurement session (T1 (before training), T2 (after training), T3 (after deconditioning)
Degrees of freedom are the same for HR, ln HF HRV, ln LF HRV, ln SD, and ln RMSSD outcomes.
Degrees of freedom are the same for SBP and DBP outcomes.
Partial F-tests are 2 degree of freedom discriminating tests of the 3-way interaction constrained to the periods of interest for reactivity to psychological challenge (Baseline and Math/Stroop), for recovery (Math/Stroop and Recovery), and for reactivity to orthostatic challenge (Baseline and Standing)
Effect of Training on Reactivity and Recovery from Challenge with Baseline Adjustment
Table 3 presents the Type III tests of fixed effects for models adjusting for within-session baseline period values. There were no significant partial F-tests for reactivity and recovery to psychological challenge for any of the outcomes; however, adjusting by the within-session baseline period demonstrated a significant partial F-test for treatment by session effect for reactivity to orthostatic challenge in HR (F(2, 370)=7.19, p=.001), SBP (F(2, 305)=5.41, p=.005), DBP (F(2, 305)=7.68, p=.001), and rMSSD (F(2, 370)=4.02, p=.019).
Table 3.
Effects of aerobic exercise training versus waitlist control on physiological responses to psychological and orthostatic challenge adjusted by within-session baseline period
| HR | ln HF HRV | ln LF HRV | SBP | DBP | ln SD | ln RMSSD | ||||||||||
|---|---|---|---|---|---|---|---|---|---|---|---|---|---|---|---|---|
| F | DF a | p | F | p | F | p | F | DF b | p | F | p | F | p | F | p | |
| Full F-tests | ||||||||||||||||
| Baseline | 1371.17 | (1, 789) | <.001 | 651.76 | <.001 | 350.51 | <.001 | 956.71 | (1, 694) | <.001 | 1038.25 | <.001 | 411.92 | <.001 | 755.54 | <.001 |
| Session | 0.11 | (2, 188) | .900 | 0.23 | .792 | 1.71 | .184 | 0.41 | (2, 164) | .665 | 1.91 | .152 | 0.04 | .966 | 0.32 | .725 |
| Group | 1.21 | (1, 116) | .274 | 0.09 | .771 | 0.32 | .572 | 0.16 | (1, 114) | .688 | 0.51 | .475 | 0.01 | .938 | 0.01 | .943 |
| Period | 839.26 | (2, 232) | <.001 | 249.15 | <.001 | 128.6 | <.001 | 57.42 | (2, 226) | <.001 | 365.22 | <.001 | 247.57 | <.001 | 404.83 | <.001 |
| Group*Session | 3.6 | (2, 188) | .029 | 0.53 | .591 | 0.59 | .557 | 2.02 | (2, 164) | .136 | 3.56 | .031 | 0.06 | .946 | 1.35 | .262 |
| Session*Period | 1.96 | (4, 370) | .101 | 0.3 | .876 | 2.86 | .023 | 3.51 | (4, 305) | .008 | 7.13 | <.001 | 0.68 | .607 | 0.58 | .679 |
| Group*Period | 3.22 | (2, 232) | .042 | 2.75 | .066 | 0.72 | .487 | 1.93 | (2, 226) | .147 | 0.22 | .802 | 0.57 | .565 | 3.37 | .036 |
| Group*Session* Period | 1.73 | (4, 370) | .143 | 0.84 | .502 | 0.51 | .726 | 1.86 | (4, 305) | .117 | 2.19 | .070 | 1.36 | .249 | 1.37 | .243 |
|
Partial F-testsc | ||||||||||||||||
| Psychological Challenge | ||||||||||||||||
| Reactivity | 0.25 | (2, 370) | .775 | 0.06 | .946 | 0.81 | .445 | 0.23 | (2, 305) | .795 | 0.25 | .780 | 0.09 | .914 | 0.07 | .935 |
| Recovery | 0.03 | (2, 370) | .968 | 0.18 | .832 | 0.02 | .982 | 0.17 | (2, 305) | .846 | 0.13 | .874 | 0.87 | .419 | 0.05 | .956 |
| Orthostatic Challenge | ||||||||||||||||
| Reactivity | 7.19 | (2, 370) | .001 | 2.01 | .135 | 0.23 | .798 | 5.41 | (2, 305) | .005 | 7.68 | .001 | 0.59 | .557 | 4.02 | .019 |
HR = heart rate, ln = natural log transformation, HF = high frequency, LF = low frequency, SBP = systolic blood pressure, DBP = diastolic blood pressure, SD = standard deviation of RR intervals, RMSSD = root mean squared successive difference.
Period = period within the psychophysiological protocol (baseline, psychological challenge, recovery, orthostatic challenge)
Session = measurement session (T1 (before training), T2 (after training), T3 (after deconditioning)
DF – degrees of freedom are the same for HR, ln HF HRV, ln LF HRV, ln SD, and ln RMSSD outcomes.
Degrees of freedom are the same for SBP and DBP outcomes.
Partial F-tests are 2 degree of freedom discriminating tests of the 3-way interaction constrained to the periods of interest for reactivity to psychological challenge (Baseline and Math/Stroop), for recovery (Math/Stroop and Recovery), and for reactivity to orthostatic challenge (Baseline and Standing)
There were also significant effects of group on the change from T1 to T2 in changes in HR, SBP, DBP, and RMMSD in response to orthostatic challenge (HR: Cohen’s d=0.54, p=.002; SBP: Cohen’s d=0.44, p=.014; DBP: Cohen’s d=0.74, p=.002; rMSSD: Cohen’s d=0.48, p=.006; see Table 4a and 4b). Examining the contrasts within each group (not shown in Table 4), after T2 training, reactivity to orthostatic challenge in the aerobic training group was attenuated but not significantly (unstandardized beta values (b); HR: b=−1.721, p=.101; SBP: b=−2.512, p=0.218; DBP: b=−2.145, p=.131; rMSSD: b=.108, p=.085) compared to T1. However, in the waitlist group, reactivity to orthostatic challenge significantly increased after T1 (HR: b=2.918, p=.004; SBP: b=4.318, p=.020; DBP: b=3.851, p=.003; rMSSD: b=−.131, p=.028).
Table 4.
Model estimates of pre-specified contrasts to assess reactivity and recovery for models adjusted by within session baseline period
| EX vs. WL Contrast | HR | ln HF HRV | ln LF HRV | SBP | DBP | ln SD | ln RMSSD | ||||||||||||||
|---|---|---|---|---|---|---|---|---|---|---|---|---|---|---|---|---|---|---|---|---|---|
| Est | SE | p | Est | SE | p | Est | SE | p | Est | SE | P | Est | SE | p | Est | SE | p | Est | SE | p | |
| Reactivity to Psychological Challengea | |||||||||||||||||||||
| T2-T1 | −1.01 | 1.44 | .484 | −0.02 | 0.19 | .938 | −0.24 | 0.19 | .215 | 1.43 | 2.67 | .591 | 0.52 | 1.85 | .778 | −0.01 | 0.07 | .948 | 0.02 | 0.09 | .853 |
| T3-T2 | 0.37 | 1.51 | .806 | −0.05 | 0.20 | .811 | 0.08 | 0.20 | .694 | 0.29 | 2.77 | .918 | 0.82 | 1.93 | .671 | −0.03 | 0.08 | .738 | −0.03 | 0.09 | .713 |
| Recovery to Psychological Challengeb | |||||||||||||||||||||
| T2-T1 | −0.13 | 1.80 | .941 | 0.03 | 0.23 | .884 | 0.02 | 0.24 | .925 | −0.76 | 3.18 | .812 | −0.78 | 2.30 | .734 | −0.09 | 0.08 | .258 | 0.00 | 0.10 | .999 |
| T3-T2 | 0.47 | 1.89 | .805 | 0.10 | 0.24 | .674 | −0.05 | 0.25 | .848 | 1.92 | 3.34 | .566 | 1.23 | 2.41 | .611 | 0.10 | 0.09 | .239 | 0.03 | 0.11 | .799 |
| Reactivity to Orthostatic Challengec | |||||||||||||||||||||
| T2-T1 | −4.64 | 1.45 | .002 | 0.37 | 0.19 | .05 | 0.10 | 0.19 | .601 | −6.83 | 2.75 | .014 | −6.00 | 1.91 | .002 | 0.07 | 0.07 | .347 | 0.24 | 0.09 | .006 |
| T3-T2 | 5.14 | 1.52 | .001 | −0.13 | 0.20 | .522 | −0.13 | 0.20 | .53 | 8.99 | 2.91 | .002 | 7.24 | 2.02 | <.001 | −0.07 | 0.08 | .355 | −0.17 | 0.09 | .058 |
Reactivity to Psychological Challenge is the contrast between the outcome during Math/Stroop compared to the outcome during Baseline.
Recovery to Psychological Challenge is the contrast between the outcome during recovery compared to the outcome during Math/Stroop.
Reactivity to Orthostatic Challenge is the contrast between the outcome during Standing compared to the outcome at Baseline
Table 4 also show differences in reactivity to orthostatic challenge from T2 to T3 were also significant for these outcomes (HR: Cohen’s d=0.60, p=.001; SBP: Cohen’s d=0.44, p=.002; DBP: Cohen’s d= 0.74, p<.001) but not significant for rMSSD (Cohen’s d=0.34, p=.058). After deconditioning (from T2 to T3), the aerobic training group significantly regained reactivity to orthostatic challenge (HR: b=3.707, p=.001; SBP: b=8.071, p<.001, DBP: b=7.787, p<.001), while the waitlist group improved from T2 to T3 but not significantly (HR: b=−1.432, p=.153; SBP: b=−0.918, p=.616; DBP: b=0.544, p=.668). For rMSSD, after deconditioning, reactivity to orthostatic challenge was trend-level restored in the aerobic training group (b=−0.132, p=.056), and largely unchanged in the waitlist group (b=0.042, p=.486).
DISCUSSION
In this paper, we report that 12 weeks of exercise training significantly increased aerobic capacity whereas there was no change in the waitlist group. Despite this difference, the two groups did not differ on HR, HRV, or BP reactivity to or recovery from laboratory challenge.
There is little dispute that exercise has cardioprotective effects and consensus panels regularly recommend it as a central component of a healthy lifestyle (33). The biological mechanisms responsible for this cardioprotection include reduced platelet adhesiveness and aggregability (34), reducted arterial stiffness and myocardial oxygen demand (35, 36), increased myocardial electrical stability (37), enhanced vagal and reduced sympathetic activity (38, 39), reduced insulin sensitivity, improved blood lipids levels, and weight loss (40–42), to name only a few.
In addition, some evidence has suggested that exercise training attenuates hemodynamic and autonomic responses to challenging events, a desirable effect inasmuch as elevated responsiveness has been shown to be longitudinally associated with poorer cardiovascular health (4). In a meta-analysis, fit individuals had reduced HR reactivity to and improved HR recovery from psychological challenge; however, fewer than half of the 33 studies cited were training studies, and of those, only seven showed an effect on HR reactivity, and the total number of healthy participants in these studies was only 90 (15). A cross-sectional comparison of elite and amateur sportsmen and untrained men showed that the former had reduced reactivity to psychological stress (43), consistent with previous findings from the same group (10). In contrast, Hamer et al. reported in another cross-sectional study that greater physical fitness was not associated with attenuated autonomic reactivity to stress (44).
Training studies offer a more rigorous evaluation of the effect of physical conditioning and reactivity to challenge. We reported that in 149 healthy but inactive young men and women, 12-weeks of aerobic training did not differ from strength training in their effects on reactivity to or recovery from psychological and orthostatic challenge (17). However, some evidence suggests that strength training may not be an appropriate control condition because it, too, may reduce reactivity and enhance recovery. Spalding et al. showed that aerobic and strength training both reduced BP reactivity to psychological challenge compared to a no-treatment control condition, but aerobic training was superior to strength training and to no treatment in lowering HR reactivity (19). A 10-week isometric handgrip training program reduced BP responses to a serial subtraction task (18, 45) but not to cold pressor (45). These studies suggest the possibility that strength training also may attenuate CV reactivity to challenge and if so, it may not be an appropriate control condition to assess the effect of aerobic training on reactivity.
The evidence is mixed, however. Cardiovascular responses to 2-min isometric handgrip or leg extension challenge did not change after 10 weeks of isometric resistance training (46). Reactivity to serial subtraction, isometric handgrip, and the cold pressor task were not reduced by resistance training in 24 men and women in the 18–40 year age range (47).
Here, we report findings from a RCT in which the effects of aerobic training on CV reactivity were contrasted to those of a different control condition, i.e., an inactive wait-list condition. Findings were consistent with those of the previous study. In comparison to the wait-list condition, aerobic exercise training did not reduce HR, HRV, or BP reactivity to psychological or orthostatic challenge. Training also failed to enhance recovery from psychological challenge, confirming our previous findings, and indicating that the failure to find such an effect in our previous study was not due simply to the use of a confounding comparison group. Together, these two studies suggest that improvements in aerobic fitness do not attenuate cardiovascular reactivity; these findings do not support the hypothesis that reduced activity to challenge play a role in the cardioprotective effect of aerobic exercise training.
Limitations
The conclusion that aerobic exercise training did not improve reactivity or recovery from challenge is limited to HR, BP, and HRV. As Jackson and Dishman demonstrated in a meta-analysis reviewing 73 studies, the relationship between fitness and reactivity and recovery has been examined on a wide range of dependent variables including but not limited to HR, BP, plasma catecholamines, vascular resistance, stroke volume, skin conductance, and muscle sympathetic nerve activity (16). They reported that fitness was associated with slightly greater reactivity to but better recovery from psychological challenge. The effects, however, were smallest in the better-controlled studies and of the 73 studies they reviewed, only 19 were RCTs. In these 19 studies, there was no improvement in reactivity after training. Thus, our finding of no effect of exercise training on HR, BP, or HRV reactivity or recovery is broadly consistent with those employing the most rigorous research designs.
Second, it is possible that the training program was insufficiently intense to beneficially influence reactivity and recovery. However, training elicited the expected improvement in aerobic capacity and even moderate improvements in exercise capacity are associated with cardioprotective effects (48, 49). Therefore, it seems unlikely that the failure to support the hypothesis was due to an insufficiently intensive training program.
Third, it also is possible that training participants failed to adhere sufficiently to the exercise protocol and as a result, failed to show improvements in reactivity and recovery. This, too, seems unlikely in light of the improvements in aerobic capacity in the training group but not in the control group. Finally, given this was a secondary analysis to the parent trial, the study was not powered for these specific aims. Thus, our study sample size was large enough to detect clinically meaningful moderate effect sizes to be significant, but was not powered for the very small effect sizes for the reactivity to and recovery from psychological challenge components.
Conclusion
In a randomized controlled trial, we found that aerobic training sufficient to significantly improve aerobic capacity did not improve HR, HRV, and BP reactivity to and recovery from psychological and orthostatic challenge, compared to a waitlist control condition. These findings suggest that the negative findings from our previous study, in which aerobic training was contrasted to strength training, were not due to the selection of an inappropriate control condition. Together, they challenge the view that one of the cardiovascular benefits of exercise training is its effect of CV reactivity and recovery.
Supplementary Material
Source of Funding
This study was supported by Grant R01 HL094423 from the National Heart, Lung, and Blood Institute (Sloan), Grant UL1 TR001873 from the NIH Center for Advancing Translational Sciences, and the Nathaniel Wharton Fund.
Abbreviations
- RCT
Randomized Controlled Trial
- RRV
RR Interval Variability
- BP
Blood Pressure
- CAD
Coronary Artery Disease
- HR
Heart Rate
- RQ
Respiratory Quotient
- ECG
Electrocardiogram
- SDRR
Standard Deviation of RR Intervals
- LF
Low Frequency
- HF
High Frequency
- AUC
Area Under the Curve
- rMSSD
Root Mean Squared Successive Difference
- BMI
Body Mass Index
- SNS
Sympathetic Nervous System
- ln
Natural log
Footnotes
Conflicts of Interest
None
References
- 1.Matthews KA, Zhu S, Tucker DC, Whooley MA. Blood Pressure Reactivity to Psychological Stress and Coronary Calcification in the Coronary Artery Risk Development in Young Adults Study. Hypertension. 2006;47:391–5. [DOI] [PubMed] [Google Scholar]
- 2.Jennings JR, Kamarck TW, Everson-Rose SA, Kaplan GA, Manuck SB, Salonen JT. Exaggerated Blood Pressure Responses During Mental Stress Are Prospectively Related to Enhanced Carotid Atherosclerosis in Middle-Aged Finnish Men. Circulation. 2004;110:2198–203. [DOI] [PubMed] [Google Scholar]
- 3.Treiber FA, Kamarck T, Schneiderman N, Sheffield D, Kapuku G, Taylor T. Cardiovascular reactivity and development of preclinical and clinical disease states. Psychosom Med 2003;65:46–62. [DOI] [PubMed] [Google Scholar]
- 4.Chida Y, Steptoe A. Greater Cardiovascular Responses to Laboratory Mental Stress Are Associated With Poor Subsequent Cardiovascular Risk Status: A Meta-Analysis of Prospective Evidence. Hypertension. 2010;55:1026–32. [DOI] [PubMed] [Google Scholar]
- 5.Phillips AC, Ginty AT, Hughes BM. The other side of the coin: blunted cardiovascular and cortisol reactivity are associated with negative health outcomes. Int J Psychophysiol 2013;90:1–7. [DOI] [PubMed] [Google Scholar]
- 6.Heponiemi T, Elovainio M, Pulkki L, Puttonen S, Raitakari O, Keltikangas-Jarvinen L. Cardiac autonomic reactivity and recovery in predicting carotid atherosclerosis: the cardiovascular risk in young Finns study. Health Psychol 2007;26:13–21. [DOI] [PubMed] [Google Scholar]
- 7.Shaffer JA, Wasson LT, Davidson KW, Schwartz JE, Kirkland S, Shimbo D. Blood Pressure Reactivity to an Anger Provocation Interview Does Not Predict Incident Cardiovascular Disease Events: The Canadian Nova Scotia Health Survey (NSHS95) Prospective Population Study. International journal of hypertension. 2012;2012:658128. [DOI] [PMC free article] [PubMed] [Google Scholar]
- 8.Low CA, Salomon K, Matthews KA. Chronic Life Stress, Cardiovascular Reactivity, and Subclinical Cardiovascular Disease in Adolescents. Psychosom Med 2009;71:927–31. [DOI] [PMC free article] [PubMed] [Google Scholar]
- 9.Gröpel P Endurance- and Resistance-Trained Men Exhibit Lower Cardiovascular Responses to Psychosocial Stress Than Untrained Men. Frontiers in psychology. 2018;9. [DOI] [PMC free article] [PubMed] [Google Scholar]
- 10.Rimmele U, Zellweger BC, Marti B, Seiler R, Mohiyeddini C, Ehlert U, Heinrichs M. Trained men show lower cortisol, heart rate and psychological responses to psychosocial stress compared with untrained men. Psychoneuroendocrinology. 2007;32:627–35. [DOI] [PubMed] [Google Scholar]
- 11.Jayasinghe SU, Torres SJ, Mais H, Fraser SF, Lambert GW. Fitter Women Did Not Have Attenuated Hemodynamic Responses to Psychological Stress Compared with Age-Matched Women with Lower Levels of Fitness. PloS one. 2017;12. [DOI] [PMC free article] [PubMed] [Google Scholar]
- 12.Klaperski S Effects of a 12-week endurance training program on the physiological response to psychosocial stress in men: a randomized controlled trial. Journal of behavioral medicine. 2014;37:1118–33. [DOI] [PubMed] [Google Scholar]
- 13.Lindgren M, Alex C, Shapiro PA, McKinley PS, Brondolo EN, Myers MM, Choi CJ, Lopez-Pintado S, Sloan RP. Effects of aerobic conditioning on cardiovascular sympathetic response to and recovery from challenge. Psychophysiology. 2013;50:963–73. [DOI] [PMC free article] [PubMed] [Google Scholar]
- 14.Crews DJ, Landers DM. A meta-analytic review of aerobic fitness and reactivity to psychosocial stressors. Med Sci Sports Exerc 1987;19:S114–20. [PubMed] [Google Scholar]
- 15.Forcier K, Stroud LR, Papandonatos GD, Hitsman B, Reiches M, Krishnamoorthy J, Niaura R. Links between physical fitness and cardiovascular reactivity and recovery to psychological stressors: A meta-analysis. Health Psychol 2006;25:723–39. [DOI] [PubMed] [Google Scholar]
- 16.Jackson EM, Dishman RK. Cardiorespiratory fitness and laboratory stress: a meta-regression analysis. Psychophysiology. 2006;43:57–72. [DOI] [PubMed] [Google Scholar]
- 17.Sloan RP, Shapiro PA, DeMeersman RE, Bagiella E, Brondolo EN, McKinley PS, Crowley O, Zhao Y, Schwartz JE, Myers MM. Impact of aerobic training on cardiovascular reactivity to and recovery from challenge. Psychosomatic Medicine. 2011;73:134–41. [DOI] [PMC free article] [PubMed] [Google Scholar]
- 18.Badrov MB, Horton S, Millar PJ, McGowan CL. Cardiovascular stress reactivity tasks successfully predict the hypotensive response of isometric handgrip training in hypertensives. Psychophysiology. 2013;50:407–14. [DOI] [PubMed] [Google Scholar]
- 19.Spalding TW, Lyon LA, Steel DH, Hatfield BD. Aerobic exercise training and cardiovascular reactivity to psychological stress in sedentary young normotensive men and women. Psychophysiology. 2004;41:552–62. [DOI] [PubMed] [Google Scholar]
- 20.Sloan RP, Shapiro PA, McKinley PS, Bartels M, Shimbo D, Lauriola V, Karmally W, Pavlicova M, Choi CJ, Choo TH, Scodes JM, Flood P, Tracey KJ. Aerobic Exercise Training and Inducible Inflammation: Results of a Randomized Controlled Trial in Healthy, Young Adults. Journal of the American Heart Association. 2018;7:e010201. [DOI] [PMC free article] [PubMed] [Google Scholar]
- 21.Baecke JA, Burema J, Frijters JE. A short questionarre for the measurement of habitual physical activity in epidemiologicalstudies. Am J Clin Nutr 1982;36:936–42. [DOI] [PubMed] [Google Scholar]
- 22.McKinley PS, King AR, Shapiro PA, Slavov I, Fang Y, Chen IS, Jamner LD, Sloan RP. The impact of menstrual cycle phase on cardiac autonomic regulation. Psychophysiology. 2009;46:904–11. [DOI] [PMC free article] [PubMed] [Google Scholar]
- 23.McZgee VE, Carleton WT. Piecewise Regression. Journal of the American Statistical Association. 1970;65:1109–24. [Google Scholar]
- 24.Robergs RA, Dwyer D, Astorino T. Recommendations for Improved Data Processing from Expired Gas Analysis Indirect Calorimetry. Sports Medicine. 2010;40:95–111. [DOI] [PubMed] [Google Scholar]
- 25.Beaver WL, Wasserman K, Whipp BJ. A new method for detecting anaerobic threshold by gas exchange. J Appl Physiol 1986;60:2020–7. [DOI] [PubMed] [Google Scholar]
- 26.Froelicher VF, Marcondes GD. Manual of exercise testing. Chicago: Year Book Medical Publishers; 1989. [Google Scholar]
- 27.Spielberger CD, Gorsuc R, Luschene R. Manual for the State-Trait Anxiety Inventory. Palo Alto: Consulting Psychologists Press; 1970. [Google Scholar]
- 28.Cook WW, Medley DM. Proposed hostility and Pharisaic-virtue scales for the MMPI. Journal of Applied Psychology. 1954;38:414–8. [Google Scholar]
- 29.Spielberger CD. State-Trait Anger Expression Inventory. Tampa: Psychological Assessment Resources; 1988. [Google Scholar]
- 30.DeBoer RW, Karemaker JM, Strackee J. Comparing spectra of a series of point events particularly for heart rate variability data. IEEE transactions on bio-medical engineering. 1984;31:384–7. [DOI] [PubMed] [Google Scholar]
- 31.Harris FJ. On the use of windows for harmonic analysis with the discrete Fourier transform. Proceedings of the IEEE 1978;66:51–83. [Google Scholar]
- 32.Kamarck TW, Jennings JR, Debski TT, Glickman-Weiss E, Johnson PS, Eddy JJ, Manuck SB. Reliable measures of behaviorally-evoked cardiovascular reactivity from a PC-based test battery: Results from student and community samples. Psychophysiology. 1992;29:17–28. [DOI] [PubMed] [Google Scholar]
- 33.Kraus WE, Bittner V, Appel L, Blair SN, Church T, Després J-P, Franklin BA, Miller TD, Pate RR, Taylor-Piliae RE, Vafiadis DK, Whitsel L. The National Physical Activity Plan: A Call to Action From the American Heart Association: A Science Advisory From the American Heart Association. Circulation. 2015;131:1932–40. [DOI] [PubMed] [Google Scholar]
- 34.Wang J-S, Li Y-S, Chen J-C, Chen Y-W. Effects of Exercise Training and Deconditioning on Platelet Aggregation Induced by Alternating Shear Stress in Men. Arteriosclerosis, Thrombosis, and Vascular Biology. 2005;25:454–60. [DOI] [PubMed] [Google Scholar]
- 35.Scheuer J, Tipton CM. Cardiovascular adaptations to physical training. Annual Review of Physiology. 1977;39:221–51. [DOI] [PubMed] [Google Scholar]
- 36.Beck DT, Martin JS, Casey DP, Braith RW. Exercise Training Reduces Peripheral Arterial Stiffness and Myocardial Oxygen Demand in Young Prehypertensive Subjects. American Journal of Hypertension. 2013;26:1093–102. [DOI] [PMC free article] [PubMed] [Google Scholar]
- 37.Billman GE. Cardiac autonomic neural remodeling and susceptibility to sudden cardiac death: effect of endurance exercise training. Am J Physiol Heart Circ Physiol 2009;297:H1171–93. [DOI] [PubMed] [Google Scholar]
- 38.Sloan RP, Shapiro PA, DeMeersman RE, Bagiella E, Brondolo EN, McKinley PS, Slavov I, Fang Y, Myers MM. The Effect of Aerobic Training and Cardiac Autonomic Regulation in Young Adults. American Journal of Public Health. 2009;99:921–8. [DOI] [PMC free article] [PubMed] [Google Scholar]
- 39.Farquhar WB, Greaney JL. Autonomic exercise physiology in health and disease. Auton Neurosci 2015;188:1–2. [DOI] [PubMed] [Google Scholar]
- 40.Wilson P Physical Activity and Dietary Determinants of Weight Loss Success in the US General Population. American Journal of Public Health. 2015;106:321–6. [DOI] [PMC free article] [PubMed] [Google Scholar]
- 41.Swift DL, Johannsen NM, Lavie CJ, Earnest CP, Church TS. The Role of Exercise and Physical Activity in Weight Loss and Maintenance. Progress in Cardiovascular Diseases. 2014;56:441–7. [DOI] [PMC free article] [PubMed] [Google Scholar]
- 42.Swift DL, Houmard JA, Slentz CA, Kraus WE. Effects of aerobic training with and without weight loss on insulin sensitivity and lipids. PLoS One. 2018;13:e0196637. [DOI] [PMC free article] [PubMed] [Google Scholar]
- 43.Rimmele U, Seiler R, Marti B, Wirtz PH, Ehlert U, Heinrichs M. The level of physical activity affects adrenal and cardiovascular reactivity to psychosocial stress. Psychoneuroendocrinology. 2009;34:190–8. [DOI] [PubMed] [Google Scholar]
- 44.Hamer M, Steptoe A. Association Between Physical Fitness, Parasympathetic Control, and Proinflammatory Responses to Mental Stress. Psychosom Med 2007;69:660–6. [DOI] [PubMed] [Google Scholar]
- 45.Millar P,R Bray S, Macdonald M, McCartney N. Cardiovascular reactivity to psychophysiological stressors: Association with hypotensive effects of isometric handgrip training. Blood Pressure Monitoring. 2009;14:190–5. [DOI] [PubMed] [Google Scholar]
- 46.Somani YB, Baross AW, Brook RD, Milne KJ, McGowan CL, Swaine IL. Acute Response to a 2-Minute Isometric Exercise Test Predicts the Blood Pressure-Lowering Efficacy of Isometric Resistance Training in Young Adults. American Journal of Hypertension. 2018;31:362–8. [DOI] [PubMed] [Google Scholar]
- 47.Somani Y, Baross A, Levy P, Zinszer K, Milne K, Swaine I, McGowan C. Reductions in ambulatory blood pressure in young normotensive men and women after isometric resistance training and its relationship with cardiovascular reactivity. Blood Press Monit 2017;22:1–7. [DOI] [PubMed] [Google Scholar]
- 48.Pearson TA, Bazzarre TL, Daniels SR, Fair JM, Fortmann SP, Franklin BA, Goldstein LB, Hong Y, Mensah GA, Sallis JF Jr, Smith S Jr, Stone NJ, Taubert KA. American Heart Association Guide for Improving Cardiovascular Health at the Community Level: A Statement for Public Health Practitioners, Healthcare Providers, and Health Policy Makers From the American Heart Association Expert Panel on Population and Prevention Science. Circulation. 2003;107:645–51. [DOI] [PubMed] [Google Scholar]
- 49.Pearson TA, Blair SN, Daniels SR, Eckel RH, Fair JM, Fortmann SP, Franklin BA, Goldstein LB, Greenland P, Grundy SM, Hong Y, Houston Miller N, Lauer RM, Ockene IS, Sacco RL, Sallis JF Jr, Smith SC Jr, Stone NJ, Taubert KA. AHA Guidelines for Primary Prevention of Cardiovascular Disease and Stroke: 2002 Update: Consensus Panel Guide to Comprehensive Risk Reduction for Adult Patients Without Coronary or Other Atherosclerotic Vascular Diseases. Circulation. 2002;106:388–91. [DOI] [PubMed] [Google Scholar]
Associated Data
This section collects any data citations, data availability statements, or supplementary materials included in this article.