Abstract
Google searches create a window into population-wide thoughts and plans not just of individuals, but populations at large. Since the outbreak of COVID-19 and the non-pharmaceutical interventions introduced to contain it, searches for socially distanced activities have trended. We hypothesize that trends in the volume of search queries related to activities associated with COVID-19 transmission correlate with subsequent COVID-19 caseloads. We present a preliminary analytics framework that examines the relationship between Google search queries and the number of newly confirmed COVID-19 cases in the United States. We designed an experimental tool with search volume indices to track interest in queries related to two themes: isolation and mobility. Our goal was to capture the underlying social dynamics of an unprecedented pandemic using alternative data sources that are new to epidemiology. Our results indicate that the net movement index we defined correlates with COVID-19 weekly new case growth rate with a lag of between 10 and 14 days for the United States at-large, as well as at the state level for 42 out of 50 states with the exception of 8 states (DE, IA, KS, NE, ND, SD, WV, WY) from March to June 2020. In addition, an increasing caseload was seen over the summer in some southern US states. A sharp rise in mobility indices was followed by a sharp increase, respectively, in the case growth data, as seen in our case study of Arizona, California, Florida, and Texas. A sharp decline in mobility indices is often followed by a sharp decline, respectively, in the case growth data, as seen in our case study of Arizona, California, Florida, Texas, and New York. The digital epidemiology framework presented here aims to discover predictors of the pandemic’s curve, which could supplement traditional predictive models and inform early warning systems and public health policies.
Keywords: COVID-19, Alternative data sources, Predictive analytics, Digital epidemiology
Introduction
Human interactions fuel epidemics. Complex networks of social contacts underlie communicable disease epidemic dynamics. Such human interactions alter epidemics, but at the same time epidemics alter the very same human interactions (Funk et al. 2014, 2018; Yan et al. 2018; Chowell et al. 2016). As such, early predictions or mechanistic models may not identify the various perturbations in epidemics caused by reactive behaviour change. Epidemics may, instead, have multiple peaks or waves tied due to changes in behavior. It may be difficult to recognize these behaviors in real time to feed into predictive models. Official laws and regulations do not fully capture the on-the-ground changes in human activities during an epidemic; behavior changes may also occur independently, reflecting reasoned avoidance of observed or suspected dangers—or may conversely be due to a distinct denial of risk. Predictive analytics and digital epidemiology provide a new means of exploring these changes in human interactions and adjusting epidemic predictions in real-time (Hayward et al. 2020; Moran et al. 2016). Moreover, alternative data sources can identify more than just contacts and movement but can also capture the heterogeneity of risk due to more than simply human contacts, but which vary depending on the specificities of these interactions; specific types of activities, whether involving travel, large groups, poorly ventilated indoors, vocalization or exertion, ormask-less activities, which will create different transmission landscapes (Hamner et al. 2020).
“Let’s google it” has become a universal refrain. Google searches can be a window into thoughts, translating private lives into quantitative insights. Searches can anticipate patterns of movement and activities that fuel outbreak transmission. Such an approach could provide insight into population-wide activities and the outbreaks that follow, during a time of unprecedented social distancing measures and behavior change to contain COVID-19.
The COVID-19 pandemic has spurred interest in many scientific fields, including Artificial Intelligence (AI), where alternative data have been used to extract insights. Jiang, Coffee, Bari, et al. used AI capabilities to examine medical data, identifying severe COVID-19 cases early in the disease course (Jiang et al. 2020). Other work has examined epidemiology using satellite imagery from Wuhan, China (Patel 2019) to demonstrate reduced human movement with the outbreak. Additionally, research focused on Google’s newly-released Community Mobility Report Dataset (Google 2020) and Apple’s COVID-19 Mobility Trends (Apple 2020) aggregated cellular devices’ geo-coordinate trails through search and navigation requests to quantify mobility at a regional level and to measure social distancing.
Applying Predictive Analytics to alternative data sources can often help discover hidden relationships between seemingly unrelated ideas. For instance, Moraes and Bari reported a link between restaurant inspections and NYC Real Estate markets (Moraes et al. 2019), and similarly, tweets have forecasted stock price changes. Hidden relationships can be deduced with predictive algorithms, including bird flocking algorithms (Bellaachia and Bari 2012) and recurrent neural networks (Moraes et al. 2019). Furthermore, Google search data have been used to predict changes in technology stock returns (Rui 2015) and US unemployment rates (D’Amuri and Marcucci 2012).
Digital Epidemiology has used alternative data to detect disease footprints. Prior alternative data work in epidemics has focused on predicting disease patterns (incidence, prevalence, geographic distributions) from search terms directly related to the illness (fever, cough, cold medicine). Most notably, Google Flu Trends used search volumes to predict localized changes in influenza activity; however, this program failed to sustain accurate predictions (Lazer and Kennedy 2015), when it missed the peak volume in 2013 by significant margins, in part, as Lazer et al. argued, due to overfitting to unrelated seasonal terms (Lazer et al. 2014). Other work on alternative data in epidemiology has focused on spatial spread, e.g., by using cellphones as a stand-in for population movement. This method has shown promise from cholera in Haiti to Ebola in West Africa, but, at the same time, phones do not inherently correspond to individuals, nor do they represent the full risk of mobility and interactions that result in disease spread (Bengtsson et al. 2011; Feng et al. 2018; Bengtsson et al. 2015).
In this study, we propose an analytics tool that relies on Google trends to supplement standard COVID-19 data sources in order to better predict the future number of COVID-19 cases, by accounting for a key element: behavior change. There have been many tools developed to track the epidemic, from real-time case reporting to compilations of key metrics; this tool would add to tracking how behavior changes in real time (Institute for Health Metrics and Evaluation 2020; The COVID Tracking Project, 2020; Our World in Data 2020). Mechanistic model predictions of epidemics based on human interactions, such as from the standard Susceptible–Infected–Recovered (SIR) models, may predict single epidemic peaks or seasonal waves, whereas human behavior in an epidemic often varies throughout. There may be periods of higher levels of fear prompting protective behaviors, followed by periods with increased risk taking or with different types of behavior restrictions, resulting in varied and staggered peaks as risk behavior fluctuates. To start to better quantify these behavior changes in real-time, this tool is designed to begin to quantify expected behavior changes by quantifying interest in at-risk activities. This framework provides insights into isolation and mobility, which within the larger context of public health measures and other risk mitigations, can add to predictions of the wavering ascents and descents of epidemic caseloads.
Our research is motivated by the following main questions: Can alternative data sources help us explore isolation and mobility trends? Is there a correlation and predictive causality between the number of isolation and mobility search queries and the coronavirus curve? Can Artificial Intelligence fueled by alternative data sources predict major changes in the numbers of cases?
Methods
An experimental early-alert COVID-19 tool
In this study, we designed an experimental data analytics tool to search for the underlying mechanisms affecting disease spread, in particular isolation and mobility as captured by Google search terms. We suggest that new alternative data sources such as online search queries can provide insights to better understand the impact of COVID-19 on a population’s activities and to predict significant changes in growth rates. In 2020, many people are increasingly dependent on online search engines for information, and so statistically significant changes in search patterns may reflect changes in behavior. Insights can also be collected from search queries into public well-being, especially as health systems are stressed by COVID-19. Some queries may relate to fear of the disease (“will I die of coronavirus?”, “coronavirus deaths,” “symptoms of coronavirus,” and more), while others are linked to mental health (such as “depression symptoms” and “acute anxiety”) (Ayers et al. 2020). These search queries are anonymized and aggregated directly by Google, where the vast number of queries mitigates privacy concerns.
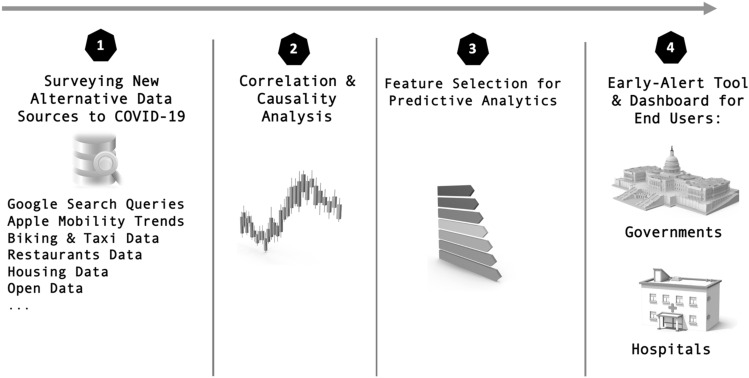
Figure 1 illustrates an overview of the main phases of the design of this tool. We first surveyed various data sources—including Google trends, as well as biking, taxi, restaurant and other data—and narrowed our scope to Google trends as a first step in our ongoing study, due to its relevance to COVID-19. The second phase involved studying relationships of the selected data sources in comparison with the number of cases. Phase three involved selecting predictive features for building forecasting models. The goal will be in the future to expand this work with other data sources to discover more predictors of the pandemic’s curve to supplement traditional predictive models and inform early-alert tools and public health decision making.
Fig. 1.
An early-alert experimental framework using alternative data sources at a glance
Alternative data sources
In this study, we rely on alternative data sources to epidemiology to understand human behavior vis-à-vis a pandemic. In Bari et al. (2019), the authors define “Alternative Data Sources” as “data collected from non-traditional data sources that can provide new perspectives on an entity or the event in question.” Such data are an alternative to traditional data sources—like cases reported to public health departments and hospital admissions. Alternative data have been used in finance to generate data-driven investments, such as using satellite images of cars in parking lots to predict businesses earnings. It has also been used in past epidemics, e.g., cell phone data have been used to track population movement and disease spread (Waltz 2020). Currently with COVID-19, data have been pulled from satellite imagery (Nsoesie et al. 2020), travel data (National Security Research Division 2020), market data (Federal Reserve Bank of St. Louis 2020), and open data (The Atlantic 2020a, b).
Data source: daily confirmed COVID-19 cases
The first data source used in this study is the number of COVID-19 cases, gathered from data from The New York Times, based on reports from state and local health agencies. For our initial experiments, we collected data from January 29 to June 30, 2020. The metric used was the log of the compound weekly growth rate. This metric accounts for the exponential nature of disease spread as well as weekly variations in data released. In Eq. (1) we denote by N(t) the number of new COVID-19 cases confirmed in a given region on day t. We can then define its smoothed (k-day moving average) number of new COVID-19 cases Ns(t) as follows:
| 1 |
Since this approach seeks to identify and predict sudden changes in new COVID-19 case statistics, we sought not to treat sudden case spikes as noise. We found that taking k = 3 for a 3-day average created a more responsive model, given responses often spiked over one or a few given days during the constantly changing epidemic. In place of using k = 7 and smoothing sudden spikes, we then controlled for weekly effects as well as the exponential nature of virus growth by defining G(t) as the logarithm of the compound weekly growth rate:
| 2 |
Data source: Google search volume data
The second data source adopted in this study is the volume of search queries from Google Trends. The Google data collection process involves counting how many times a search was made for a query qi at a time tj in a given geographical region R, then dividing the search count by the total count of all Google search queries at any given time (to account for changes in the total number of Google searches), and then normalizing over the entire requested time period [t0, tn−1] so that the search volume for any term has a fixed maximum of 100 over the requested period. The search index thus defined is designed to peak at 100, with every other value representing a fraction of this peak interest, thus accounting for different search volumes at different times.
Expressed in mathematical notation, our Search Volume Index V(q, t, R) adopted from Rui (2015) and Waltz (2020)—for a query q, time t, and region R—is defined as follows: First, we denote by C(qi, tj, R) the raw count of the number of Google searches that included query qi at time tj in the geographical region R. We then define an intermediate search index S(qi, tj, R) as
| 3 |
where the denominator is the region’s total search volume at time tj. Finally, we now normalize over the given time period to define our final search volume index V(qi, tj, R) as
| 4 |
In the following sections, we outline the data experiments we conducted, and later the empirical results of the study.
Search indices
The framework we present consists of search volume indices that were designed to gauge changes in social dynamics. The experiments we conducted were from January 29 to June 30, 2020. Each index corresponds to a set of queries Q, defined separately for each region R, i.e., we examine differences across states, so the set {R} is the set of states, as detailed later on. Using the search volume definition V(q,t,R) provided by Google Trends, the following details how we construct a single index I(Q,t,R) over time for a chosen set of queries Q and a region R. Let us denote our query list as a class Q, consisting of all searches related to the key phrases {q0 ,…, qn}. For instance, if one of the words is “recipe,” the search index accounts for all searches that have included it, such as “banana bread recipe” or “what is the recipe for apple pie” over the time interval [t0, tn].
First, the index Iu(Q,t,R) is defined as the (unsmoothed) average over all the search volumes for the various queries
| 5 |
We then smooth our index by taking a k-day moving average, giving us a smoothed index Is(Q,t,R):
| 6 |
Note that as a result we are losing data points for the first k − 1 days. We chose k = 3 to maintain responsiveness while reducing noise: We do not wish to smooth out weekend effects since they are vital indicators of relative mobility. Finally, since the search levels V had been normalized to have a maximum of 100, the magnitude of Is only has meaning when compared between different points in time; we therefore normalize these values Is as well (without losing any information) so that they take the value 1 at the starting time t0. In other words, we define our final search index as
| 7 |
This allows us to move past Google’s relatively arbitrary initial search volume levels (which are not comparable across terms unless normalized) and produce more insightful graphs that allow us to easily spot and quantify changes in searching behavior. For instance, an index with value of 0.6 on day 30 means that the aggregated search volume for these terms has fallen by 40% over the past month.
The next sections will detail the indices that we designed to track isolation, mobility, and also prevention measures (masks).
Isolation index
In March and April of 2020, stay-at-home orders were instituted across the United States to stop COVID-19 transmission that were heterogeneous, i.e., they were instituted by different states at different times—sometimes acting together as a region, but not as a country. The specific limitations also differed: Restrictions often initially limited gathering sizes and recommended at-risk groups to stay-at-home, were then followed by school closings, and finally only essential businesses were allowed to be open, and stay-at-home orders were issued. Some states also instituted quarantines and checks for out-of-state visitors.
These orders, coupled with concerns over COVID-19, have been associated with significant behavioral changes. With internet access widespread (about 70–90% in the various states), internet users nationwide took to Google to answer their questions. Many searches included terms that either might not have had much search volume before (for instance, terms that are semantically related to “How do I cut my own hair?” and many other queries just involving “own hair”), while others were popular before COVID-19 and increased in popularity as lifestyle changes were introduced by COVID-19 (searches relevant to “[food] delivery,” “home yoga,” and “push-ups” saw this effect). Some terms in this index included all “recipe”-related searches, as well as “[food and alcohol] delivery” requests. Fundamentally, the isolation index aims to measure the interest in searches that refer to activities performed at home.
Mobility index
Conversely, changes in search volumes for other terms were expected to decrease as a result of introducing social distancing measures. Some of the most widely-discussed effects of social distancing pertained to significant decreases in demand for travel, restaurant dining, and movie theaters. Of course, these are only a few of many activity changes that followed stay-at-home orders. The Mobility Index seeks to observe these changes by constituting not only transport-related queries (such as searches involving “gas stations” and” flight tickets”), but also general demand for localized geographical questions (including, for example, “theaters near me,” “dentists,” and “hair [and/or nail] salons”). Crucially, the expectation that a decrease in search volumes for these terms (denoted by the Mobility Index that we calculate) would correspond to an increase in people sheltering in place likely implies that the converse is also true, i.e., that an increase in our Mobility Index would reflect a change in behavior that implies a reduction of people sheltering in place.
The choice of search keywords was informed by a recent survey of 6730 people at the end of April by UCLA Nationscape and the Democracy fund that tracked activities individuals reported they would prioritize attending if “restrictions were lifted on the advice of public health officials regarding activities” (Democracy Fund and UCLA Nationscape 2020). The most popular results included “going to a stadium/concert,” “going to the movies,” and “attending a sports event.” Most importantly, though, many expressed their willingness to “eat dinner at a friend,” “get a haircut,” “go to church,” “eat at a restaurant,” or “attend a funeral.” Our index tracked search volume for many of these words so as to examine changes people may have with regard to even the thought of (realistically) going out. Other search terms included all kinds of queries of the form “Is [a specific place] open?” or just any searches including the words “near me.”
Net movement index
Since both these indices act in opposite directions, we can define a composite index called Net Movement Index as the difference between the isolation index and the mobility index.
This Net Movement Index serves as an overall indicator of social mobility, and the extent to which people are sheltering in place or practicing social distancing. We theoretically expect that a sudden decline in Net Movement (i.e., more people staying home) would correspond to a reduction in COVID-19 spread with a lag equivalent to the incubation period of COVID-19 (i.e., 2–14 days from exposure to first illness and a further 5–8 days until more severe illness), with backlogs in testing potentially creating further lag.
Mask index
Masks have been increasingly used to prevent transmission, and counteract increased mobility. The index tracked searches that are semantically related to “mask,” such as “how do I make my own mask?” This index could help derive insights at key points in the pandemic, though as mask use becomes normalized or supplies obtained, there may be a drop-off in mask searches.
Following the CDC recommendation on April 3, 2020, for the use of masks by the general public, state and local recommendations increasingly included directives on mask use, which differed between states and small regions (Laestadius et al. 2020).
Some states issued guidance and orders to use masks in public. Like lockdowns, these were staggered in implementation and heterogenous, beginning in April. By June 20, over 20 states and the District of Columbia had instituted different mask use orders. These varied from requiring specific populations (certain counties, or limited to government or essential workers), certain ages (exempting children of certain ages), and locations (public transportation, indoor, essential businesses).
Results
We conducted several experiments to investigate the search volume and its relationship to COVID-19 numbers. The goal was to extract predictive features that could be combined later with other features, to predict human behavior and eventually subsequent changes in the pandemic’s curve.
Preliminary descriptive analytics: comparison of search volume from 2019 before and 2020 during lockdown phase for some pandemic-related queries
Since the outbreak of COVID-19 and social distancing measures to contain it, searches for socially distanced activities semantically related to “online yoga,” “alcohol delivery,” “how do I cut my own hair?”, “how do I make coffee,” “open parks near me,” “campsites near me,” or “bike path” have trended. In fact, since the pandemic, Google searches have flocked around multiple themes, many specifically about COVID-19. Search terms included “number of cases,” “symptoms of coronavirus,” and “is there a vaccine yet?”; others searched for things to do at home, such as “online yoga,” “cutting my own hair,” “push-ups,” “recipes,” or “how to make pizza?” There are others whose searches pointed to mobility during lockdown, such searches for “bike path,” “park near me,” “open wine stores,” “hair salon,” “drive-by birthday party,” and “drive-by baby shower.” Preliminary descriptive analytics conducted on searches over several queries from the United States from March 2020 to early June 2020 indicate some interesting changes in people’s behavior during the lockdown compared with the same time in 2019:
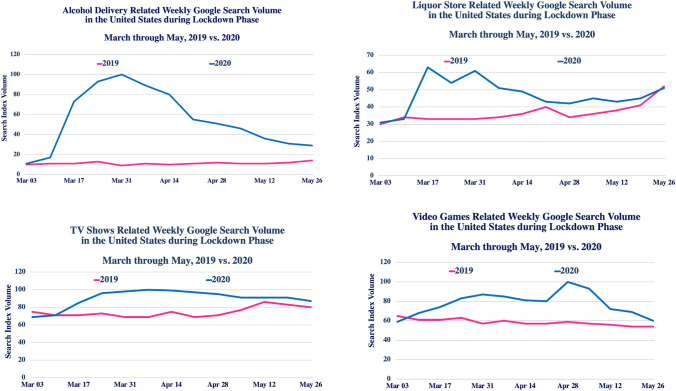
High interest in searches semantically related to alcohol, alcohol delivery, liquor stores Netflix, TV shows, and video games during the lockdown period in 2020, as shown in Fig. 2.
Low interest in car rental and slightly higher interest in searches related to online dating during the lockdown period in 2020, as shown in Fig. 3.
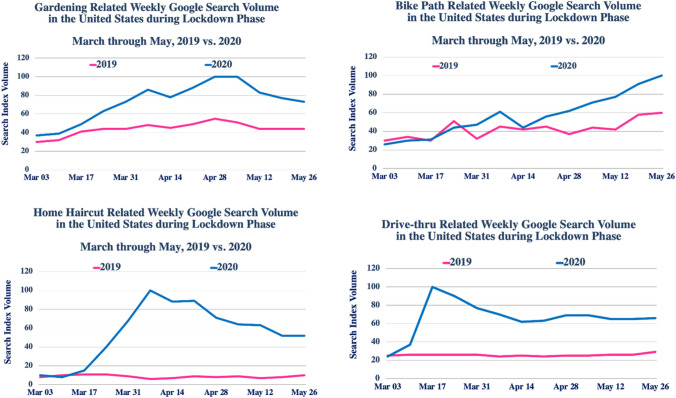
High interest in searches for activities related to gardening, making home coffee, home-made beer, bike paths, drive-thru and at-home haircuts during the lockdown period in 2020, as shown in Fig. 4.
Fig. 2.
The search volume index V as defined in Eq. (4), showing high interest in searches related to alcohol, wine, alcohol delivery, movies, video games, and TV shows during the lockdown phase in 2020
Fig. 3.
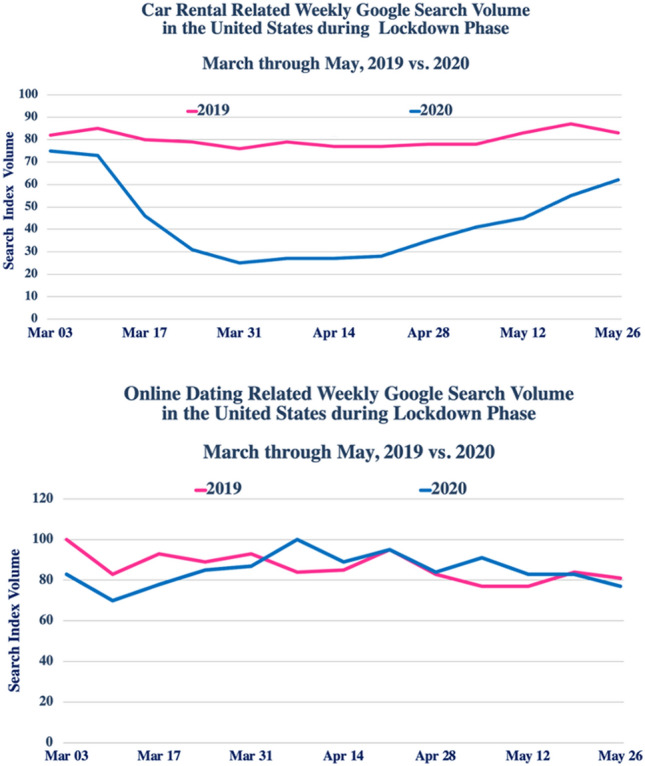
The search volume index V as defined in Eq. (4), showing low interest in searches related to car rental during the lockdown and slightly higher interest in searches related to online dating during the lockdown phase in 2020
Fig. 4.
The search volume index V as defined in Eq. (4), showing high interest in searches for activities related to gardening, making home coffee, home-made beer, bike paths, drive-thru and at-home haircut during the lockdown phase in 2020
United States: relationship between mobility and isolation indices and the number of COVID-19 cases
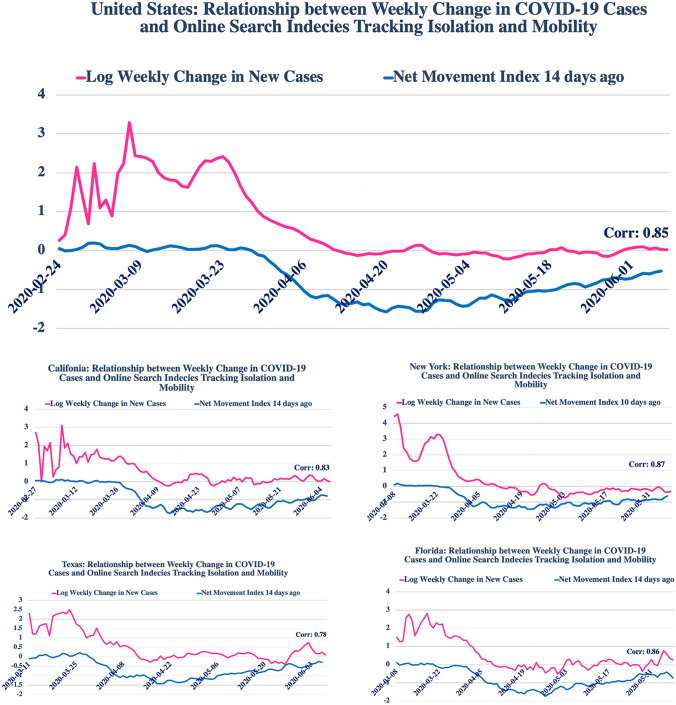
To see how the indices we designed vary with COVID-19 case growth, we performed a lag analysis of two time series: the Net Movement Index and the weekly change of COVID-19 cases. In fact, we find that an upward change in the Net Movement Index is in most cases followed by an upward change in the cases about 10–14 days later, and vice versa (the average correlation was above 0.7 on average in several states, indicating a potential relationship between the Net Movement Index (the difference between the Mobility Index and the Isolation Index), and the number of COVID-19 cases. Figure 5 illustrates the correlations that we found in some states. Note that the use of masks and other precautions were not taken into consideration in the Net Movement Index, as the Mask Index has not been validated as an indicator of actual mask use.
Fig. 5.
Relationships between (i) our index tracking isolation and mobility, lagged by between 10 and 14 days, and (ii) the weekly changes in COVID-19 cases, in the United States and NY, CA, TX, and FL
A case study of the mobility index and its relationship with the number of COVID-19 cases and the opening phases in five states
To illustrate the relation and potential predictive power of the mobility index defined above, we gathered search indices and case data from all 50 states and the District of Columbia, and present a case study of five states. Four of these states (Florida, Texas, California, and Arizona) saw cases begin to rise in June, while the fifth (New York) saw cases decline from a prior high peak. We choose these states to elucidate vital distinctions between how our defined indices and COVID-19 case growth are related.
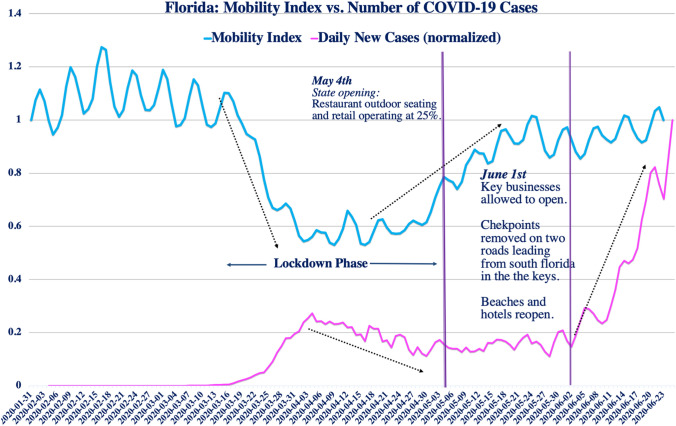
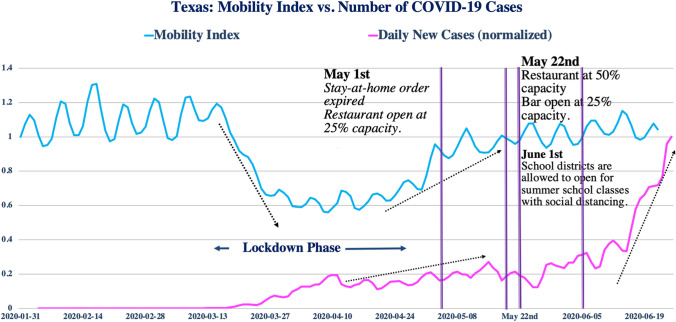
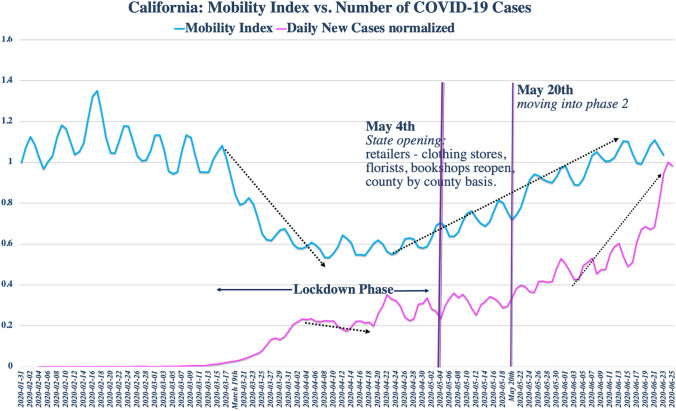
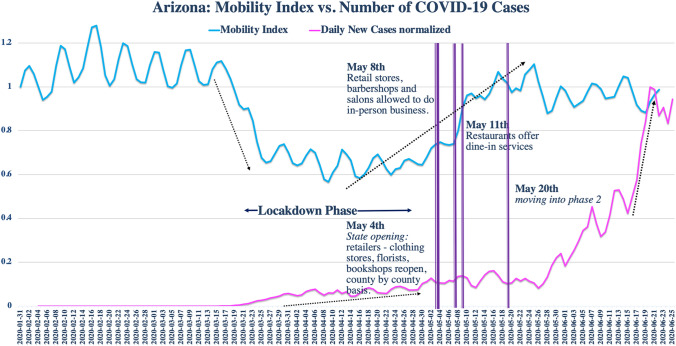
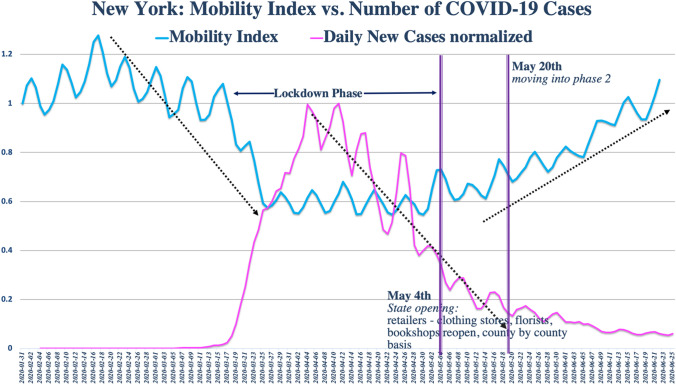
For each state, we analyzed the relationship (as shown in Figs. 6, 7, 8, 9, and 10) between the mobility index (blue, scaled to have the value 1 at the respective initial dates) and the number of confirmed COVID-19 cases within the rolling 7-day window (pink). In addition, we added vertical purple lines to mark some key dates in these states’ attempted reopening process starting in May 2020, as found in (Waltz 2020).
Fig. 6.
Mobility index vs. the number of new COVID-19 cases in Florida
Fig. 7.
Mobility index vs. the number of new COVID-19 cases in Texas
Fig. 8.
Mobility index vs. the number of COVID-19 cases in California
Fig. 9.
Mobility index vs. the number of new COVID-19 cases in Arizona
Fig. 10.
Mobility index vs. the number of new COVID-19 cases in New York State
In each state, we observe a period of sharp decrease in the mobility index starting around 3/15/2020 (in line with the time of the nationwide lockdown) lasting about 10–15 days. The times when the mobility index reaches its lowest level coincides with the beginning of a decrease or stagnation in new COVID-19 diagnoses. These periods of decreased mobility and caseloads have been followed by increases in both.
Let us now take a look at the states’ reopening process. In Florida, successive reopening stages were scheduled for May 4th and June 1st, 2020, and we observe that the mobility index increased to its original level during this time window, in fact starting and finishing a few days ahead of these key days, as people started to plan for the days to come. Within approximately two weeks of reaching the index’s top level the COVID case numbers started to spike again.
Texas exhibits a nearly identical pattern except that more time passed until the COVID-19 case numbers increased following the reopening. In California and Arizona, the first wave of COVID-19 cases had never really been brought to a reliable halt, with cases beginning to rise again further even before the first reopening phase in early May. However, the increase in the mobility index clearly preceded the second notable rise in cases by 10–14 days.
Isolation index
We find that the Isolation Index (defined previously) is particularly useful at the beginning of a lockdown but will not be sustained throughout the epidemic. That is to say, the index captures the initial response to the new situation, as people search for activities like trying out a new recipe; once they learn a new skill like this, they will not continue to search for the same thing again, and the index will slowly revert back to its original level. (Note that this is in contrast to the Mobility Index, which is more sustained and continues to be indicative of people’s behavior even as time passes.)
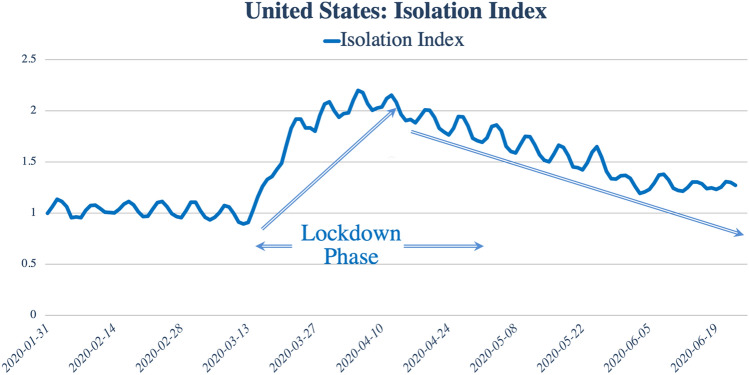
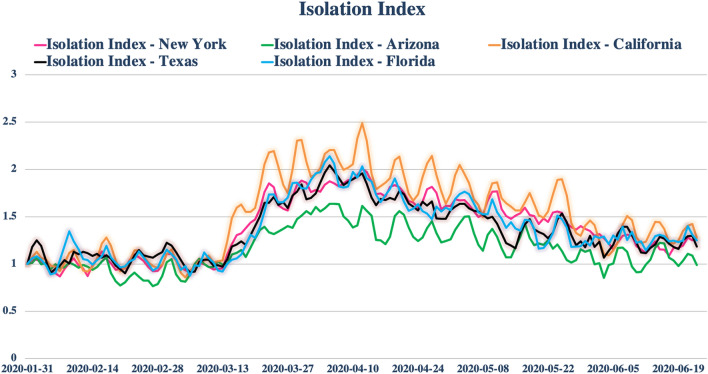
Indeed, as Figs. 11 and 12 illustrate, interest in isolation-related queries began rising mid-March, when self-isolation measures were ordered nationwide. However, interest peaked only about a month later in mid April across the U.S., possibly due to people becoming increasingly saturated with information and advice about staying home. The Search Index then proceeded to steadily decline, only approaching pre-lockdown levels in June. However, even then, many states’ Isolation Indices were still slightly higher than they had been in June. The trend observed across states is largely similar, albeit with some offsets.
Fig. 11.
Interest in isolation-related key phrases in the United States
Fig. 12.
Interest in isolation-related search key phrases across several states
Mask index
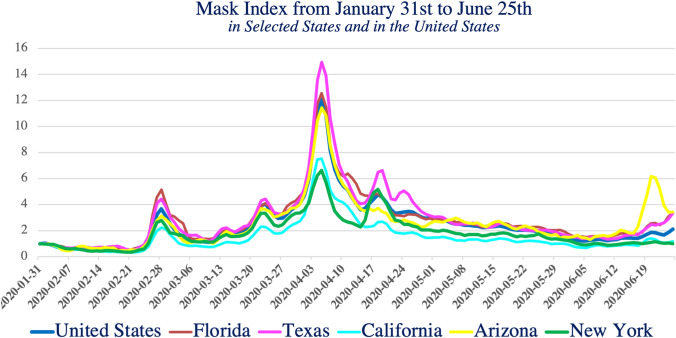
As outlined in the previous section, the Mask Index aims to gauge interest in mask wearing through searches related to masks. As shown in Fig. 13, search queries from many states expressed interest in masks.
Fig. 13.
Interest in mask-related key search phrases across several states
We defined the index to match a base “normal” search volume to an index of 1. This was done for the smoothed search volume on January 31, and most of February saw this index remain relatively stable. The first signs of a subsequent peak were in late February/early March.
The use of masks has changed notably since January 2020, when public use was absent in the US, to July 2020 when most states required their use in public in some settings. There has been no federal mandate in this period. Introductions of mask mandates have been heterogenous and staggered in these states (Gostin and Cohen 2020).
Mask mandates and use were varied between and within these different states. During the time frame of Fig. 13, two states initiated statewide mask mandates (California June 18th, New York April 15th) (California 2020; New York 2020) and three did not (Arizona, Florida, Texas) (Arizona 2020; Miami Dade 2020; Texas 2020). State mandates were preceded by mandates in local cities and communities. The counties of Los Angeles (April 10th) and San Francisco (April 22nd) instituted mandates well before the state. Miami, Florida had a mandate as early as April 9. Between April 6 and 22, the four largest Texas metropolitan areas instituted mask orders, but later in June, these mandates were not permitted by the state, until a state order went into effect in July.
Such mandates were followed by uptake. Most US adults reported use sometimes or always by mid April (Ritter and Brenan 2020). By late June, polls showed that most Americans (65%) reported masks use all or most of the time when in stores or other businesses (Igielnik 2020).
Against this backdrop, the Mask Index was characterized by sudden peaks corresponding to specific announcements on masks. Although states had very different mask regulations, searches mirrored each other closely in different states.
The largest peak in the mask index in Fig. 13 was on April 3, which corresponded with the CDC’s announcement that day recommending the use of masks by the general public (Dwyer and Aubrey 2020). Those states in which masks would be recommended by state governments the earliest (New York and California) had relatively fewer searches than Florida, Arizona, and Texas, where mask use would not be implemented statewide that soon.
The earliest peak corresponded to the CDC’s announcement on February 27 that masks are not recommended for the public, followed by the Surgeon General’s February 29 statements that masks do not help the general public and should not be stockpiled (Center for Disease Control 2020; Surgeon General 2020). A later spike on June 21 in Arizona followed the governor’s call for local governments to enforce mask use without a statewide ordinance; some local ordinances went into effect at this point. Further local spikes in April in Texas and New York correlated with the institution of local mask mandates in cities in these states.
Given the spikes in use, the Mask Index does not demonstrate steady increases in use, but rather appears to correspond to increased interest at times announcements and mandates about masks.
Conclusion and discussion
Human behaviors drive epidemics. Static population networks and baseline reproductive numbers cannot predict the unfolding dynamics of an epidemic if contact patterns change during its course. In fact, epidemics often induce such changes in behavior, while behavior change, in turn, induces changes in epidemics. Real-time reactive behavior challenges predictive modeling and public health responses, whether for COVID-19 or for Ebola, cholera, or any other epidemic disease (Chowell et al. 2017; Viboud et al. 2016; Wang et al. 2020) Such behavior change can be difficult to quantify, given the multitude of different interactions (Kissler et al. 2020) and the variations in risk caused by specific interactions (whether occurring during exercise, while mask-less, while indoor with poor ventilation or while yelling/singing). It is difficult to predict behavior change; it may be independent of, in response to, or may reflect a distrust of government mandates and scientific findings (Bonwitt et al. 2018; Goodman 2020; Johnson et al. 2020; Moon et al. 2020; Thiam et al. 2015). Real-time tools are needed to gauge the risk of case resurgences due to changes in behavior, especially if official risk mitigation mandates are discontinued early or trust in mandates erodes.
Alternative data indices can play an important role in future epidemiologic predictions. Instead of tracking signs of illness (searches for fever or cough), these alternative data tools could track relative changes in the behavior that underpins epidemic trends. Moreover, these index tools can reflect more than simple geographic mobility, as cell phone data might, but instead be built on the underlying activities that drive risk. Here such a tool is presented that could help predict COVID-19 epidemic trajectories.
Trends in Google search volumes were explored here to assess for changes in interest in activities related to isolation or mobility during the lockdown phase of the public health response in the US, starting in March 2020. These Google search volumes were used to form indices to track these collective search trends in the lockdown phase. We then followed these indices in five states (Florida, California, Arizona, Texas, New York) as COVID-19 lockdown measures were lifted. In all of these states, the mobility index, which decreased during the initial lockdown phase, increased as reopenings began. Subsequently, COVID-19 cases rose again nationwide in June 2020.
We found that the net movement index we defined correlates with COVID-19 weekly new case growth rate (defined in Eq. 2) with a lag of between 10–14 days for the United States at-large, as well as at the state level for 42 out of 50 states (but not for DE, IA, KS, NE, ND, SD, WV, WY) from March to June 2020.
An increasing caseload was seen over the summer in some southern US states. A sharp rise in mobility indices was followed by a sharp increase, respectively, in the case growth data, as seen in our case study of Arizona, California, Florida, and Texas. A sharp decline in mobility indices is often followed by a sharp decline, respectively, in the case growth data, as seen in our case study of Arizona, California, Florida, Texas, and New York.
The lag of 10–14 days seen between behaviour change and increased case load corresponds with the expected biologic delay between activities related to transmission and the identification of cases. There are usually about 5 days, (range from 2 to 14 days) from exposure to symptoms and 5–8 days from first symptoms to more severe symptoms, as well as delays due to testing capacity and backlogs in test reporting. The lag time, if the tool were further validated, could allow for measures to be taken early to minimize further transmission and case resurgences.
The tool can also highlight the strength of public health measures—including high rates of testing, contact tracing, improved ventilation, and masking—as these may effectively counteract any increased activity, as was thought to be seen in New York where search activity related to reopenings was not followed by a rise in cases (The New York Times 2020a).
The timings of state reopening plans could also predict cases. However, openings were often phased and staggered, increased mobility-related searches generally predated re-openings, perhaps in preparation, and cases correlated with the early rise in search activity. Moreover, it is not the reopening plan itself that causes the resurgence, but rather the human behavior that the reopening triggers, when there are enough cases and not enough counteracting public health measures. With further study, Google trend indices could act as an activity barometer to help decision makers track real-time behavior change in response to mandates. Such a tool, if refined and validated, could act as an early warning for local activity trends.
Further study will be needed to refine this tool to best predict transmission risks in different phases of this epidemic and for future epidemics. Further study will be needed to test this tool in future situations and also to best identify behavior changes for parameterization. The tool could focus on activity trends corresponding to transmission risk (such as physical activities indoors, without masks) and may need to allow for a wider range of activities (reflecting different cultural, and societal interests). Search indices could be weight more heavily higher-risk or potential super-spreading activities, such as indoor bars or singing groups, and reduced risk for outdoor, masked activities. The indices could avoid searches mirroring enforced regulations (such as restaurant and theater closures) but instead provide insight into what is less observable, such as private activities like family holidays or birthday gatherings. Such indices will need to be selected to avoid shaming, especially of low risk activity, and should not result in any privacy infringement (Marcus 2020). As epidemic control measures have moved from all-encompassing lockdown measures to phased reopenings with public health and, it is important to reassess the design and re-evaluat the usefulness of the tool in different public health contexts.
Furthermore, we learned through our experiments that these COVID-19 lockdown-related Google search indices fell into one of two categories:
Category 1: Some indices (e.g., isolation index, mask index) represent levels of searches that are not sustained throughout the epidemic. These are triggered by the original outbreak or the initial lockdown and will naturally revert back toward pre-crisis values after adaptation to the new situation. Examples of this could be “How to use Zoom,” “[specific] recipe,” or “What is the Coronavirus?”—once this information is learned, the majority of people will not find it necessary to search for it again.
Category 2: Other indices (e.g., mobility index) represent levels of searches that are sustained and can be used throughout the outbreak. These indicate whether current (or considered) activities are consistent with social distancing; such indices, when designed properly, will not revert back to pre-crisis levels unless accompanied by a corresponding change in lifestyle. Examples of such searches include those for the opening hours of nearby bars, or for social events.
While indices of category 1 are of value when trying to determine the speed at which people adapt to the crisis in its initial phase, it is mostly the indices of category 2 that we expect to be useful for predicting a resurgence of spread levels. Category 2 indices can be used to track risk as a durable indicator of mobility and interactions throughout the epidemic. Overall, the mobility index proved to be the strongest predictor.
Our work illustrates how a tool based on Google search volumes could, with further study, form part of an early warning system for COVID case resurgence or for other future epidemics. In combination with other standard public health metrics and social statistics, this is a first step toward building a tool to feed real time changes in behaviour into predition models. Further work will be needed to test indices for power and sustainability in predicting case fluctuations. Such tools can ultimately yield insights into which policies are the most effective. Overall, this tool could strengthen models and other predictions by increasing our understanding of an elusive feature of epidemics: the changes in human interactions that both mold and are molded by epidemic trajectories.
Acknowledgements
This work is partially sponsored by the COVID-19 Catalyst Research Award of NYU; it is also sponsored by the Amazon AI Research Grant awarded to Prof. Anasse Bari who leads the Predictive Analytics and AI Research Lab at NYU. Specials thanks to the predictive analytics research team at NYU and Mr. Mark Zouiyen for their valuable insights.
Footnotes
Publisher's Note
Springer Nature remains neutral with regard to jurisdictional claims in published maps and institutional affiliations.
Contributor Information
Anasse Bari, Email: abari@nyu.edu.
Megan Coffee, Email: Megan.Coffee@nyulangone.org.
References
- Apple (2020) Apple makes mobility data available to aid COVID-19 efforts. Apple. https://www.apple.com/newsroom/2020/04/apple-makes-mobility-data-available-to-aid-covid-19-efforts/. Accessed 13 July 2020
- Arizona (2020) Arizona emergency information network. Arizona Government. https://ein.az.gov/keywords/masks. Accessed 12 July 2020
- Ayers JW, Leas EC, Johnson DC, Poliak A, Althouse BM, Dredze M, Nobles AL. Internet searches for acute anxiety during the early stages of the COVID-19 pandemic. JAMA Int Med. 2020 doi: 10.1001/jamainternmed.2020.3305. [DOI] [PMC free article] [PubMed] [Google Scholar]
- Bari A, Peidaee P, Khera A, Zhu J, Chen H (2019) Predicting financial markets using the wisdom of crowds. In: 2019 IEEE 4th international conference on big data analytics (ICBDA), Suzhou, China, pp 334–340
- Bellaachia A, Bari A (2012) Flock by leader: a novel machine learning biologically inspired clustering algorithm. In: The international conference on swarm intelligence. Springer, Berlin, pp 117–126
- Bengtsson L, Lu X, Thorson A, Garfield R, von Schreeb J. Improved response to disasters and outbreaks by tracking population movements with mobile phone network data: a post-earthquake geospatial study in Haiti. PLoS Med. 2011;8(8):e1001083. doi: 10.1371/journal.pmed.1001083. [DOI] [PMC free article] [PubMed] [Google Scholar]
- Bengtsson L, Gaudart J, Lu X, Moore S, Wetter E, Sallah K, Rebaudet S, Piarroux R. Using mobile phone data to predict the spatial spread of cholera. Sci Rep. 2015;5:8923. doi: 10.1038/srep08923. [DOI] [PMC free article] [PubMed] [Google Scholar]
- Bonwitt J, Dawson M, Kandeh M, et al. Unintended consequences of the ‘bushmeat ban’ in West Africa during the 2013–2016 Ebola virus disease epidemic. Soc Sci Med. 2018;200:166–173. doi: 10.1016/j.socscimed.2017.12.028. [DOI] [PubMed] [Google Scholar]
- California (2020) Guidance for the use of face coverings. State of California—Health and Human Services Agency California Department of Public Health. https://www.cdph.ca.gov/Programs/CID/DCDC/CDPH%20Document%20Library/COVID-19/Guidance-for-Face-Coverings_06-18-2020.pdf. Accessed 12 July 2020
- Center for Disease Control (2020) https://twitter.com/CDCgov/status/1233134710638825473?s=20. Accessed 12 July 2020
- Chowell G, Sattenspiel L, Bansal S, Viboud C. Mathematical models to characterize early epidemic growth: a review. Phys Life Rev. 2016;18:66–97. doi: 10.1016/j.plrev.2016.07.005. [DOI] [PMC free article] [PubMed] [Google Scholar]
- Chowell G, Viboud C, Simonsen L, Merler S. Vespignani A (2017) Perspectives on model forecasts of the 2014-2015 Ebola epidemic in West Africa: lessons and the way forward. BMC Med. 2017;15(1):42. doi: 10.1186/s12916-017-0811-y. [DOI] [PMC free article] [PubMed] [Google Scholar]
- D’Amuri F, Marcucci J (2012) The predictive power of Google searches in forecasting unemployment. Banca d’Italia. No. 891. https://www.bancaditalia.it/pubblicazioni/temi-discussione/2012/2012-0891/index.html. Accessed 13 July 2020
- Democracy Fund and UCLA Nationscape (2020) COVID-19: tracking American perspectives. Democracy Fund Voter Study Group and the University of California Los Angeles. https://www.voterstudygroup.org/covid-19-updates. Accessed 15 June 2020
- Dwyer C, Aubrey A (2020) CDC now recommends Americans consider wearing cloth face coverings in public. National Public Radio. https://www.npr.org/sections/coronavirus-live-updates/2020/04/03/826219824/president-trump-says-cdc-now-recommends-americans-wear-cloth-masks-in-public. Accessed 12 July 2020
- Federal Reserve Bank of St. Louis (2020) COVID-19 financial data tracking. Economic Research. https://research.stlouisfed.org/dashboard/49752. Accessed 13 July 2020
- Feng S, Grépin KA, Chunara R. Tracking health seeking behavior during an Ebola outbreak via mobile phones and SMS. NPJ Digital Med. 2018;1:51. doi: 10.1038/s41746-018-0055-z. [DOI] [PMC free article] [PubMed] [Google Scholar]
- Funk S, Knight GM, Jansen VA. Ebola: the power of behaviour change. Nature. 2014;515(7528):492. doi: 10.1038/515492b. [DOI] [PubMed] [Google Scholar]
- Funk S, Camacho A, Kucharski AJ, Eggo RM, Edmunds WJ. Real-time forecasting of infectious disease dynamics with a stochastic semi-mechanistic model. Epidemics. 2018;22:56–61. doi: 10.1016/j.epidem.2016.11.003. [DOI] [PMC free article] [PubMed] [Google Scholar]
- Goodman JD (2020) In West Texas, lingering distrust in public health measures as virus spreads. New York Times. July 4 2020
- Google (2020) COVID-19 community mobility reports. Google. https://www.google.com/covid19/mobility/ Accessed 13 July 2020
- Gostin LO, Cohen IG, Koplan JP. Universal masking in the United States: the role of mandates, health education, and the CDC. JAMA. 2020;324(9):837–838. doi: 10.1001/jama.2020.15271. [DOI] [PubMed] [Google Scholar]
- Hamner L, Dubbel P, Capron I, Ross A, Jordan A, Lee J, Lynn J, Ball A, Narwal S, Russell S, Patrick D. Leibrand H (2020) High SARS-CoV-2 attack rate following exposure at a choir practice—Skagit County. Washington. MMWR Morb Mortal Wkly Rep. 2020;69:606–610. doi: 10.15585/mmwr.mm6919e6externalicon. [DOI] [PubMed] [Google Scholar]
- Hayward AC, Beale S, Johnson AM, Fragaszy EB. Public activities preceding the onset of acute respiratory infection syndromes in adults in England—implications for the use of social distancing to control pandemic respiratory infections. Welcome Open Res. 2020;5:54. doi: 10.12688/wellcomeopenres.15795.1. [DOI] [PMC free article] [PubMed] [Google Scholar]
- Igielnik R (2020) Most Americans say they regularly wore a mask in stores in the past month; fewer see others doing it. Pew Research Center https://www.pewresearch.org/fact-tank/2020/06/23/most-americans-say-they-regularly-wore-a-mask-in-stores-in-the-past-month-fewer-see-others-doing-it/. Accessed 12 July 2020
- Institute for Health Metrics and Evaluation (2020) COVID-19 projections https://covid19.healthdata.org/ Accessed 8 Sept 2020
- Jiang X, Coffee M, Bari A, Wang J, Jiang X, Huang J, Shi J, Dai J, Cai J, Zhang T, Wu Z, He G, Huang Y. Towards an artificial intelligence framework for data-driven prediction of coronavirus clinical severity. Comput Mater Contin. 2020;62:537–551. doi: 10.32604/cmc.2020.010691. [DOI] [Google Scholar]
- Johnson NF, Velásquez N, Restrepo NJ, et al. The online competition between pro- and anti-vaccination views. Nature. 2020;582(7811):230–233. doi: 10.1038/s41586-020-2281-1. [DOI] [PubMed] [Google Scholar]
- Kissler SM, Klepac P, Tang M, Conlan AJK, Gog JR. Sparking “The BBC Four Pandemic”: Leveraging citizen science and mobile phones to model the spread of disease. BioRxiv. 2020 doi: 10.1101/479154. [DOI] [Google Scholar]
- Laestadius L, Wang Y, Ben Taleb Z, Kalan ME, Cho Y, Manganello J. Online national health agency mask guidance for the public in light of COVID-19: content analysis. JMIR Public Health Surveill. 2020;6(2):e19501. doi: 10.2196/19501. [DOI] [PMC free article] [PubMed] [Google Scholar]
- Lazer D, Kennedy R (2015) What we can learn from the epic failure of google flu trends. Wired. https://www.wired.com/2015/10/can-learn-epic-failure-google-flu-trends/ Accessed 13 July 2020
- Lazer D, Kennedy R, King G, Vespignani A. The parable of Google Flu: traps in big data analysis. Science. 2014;343(6176):1203–1205. doi: 10.1126/science.1248506. [DOI] [PubMed] [Google Scholar]
- Marcus J (2020) Quarantine fatigue is real. The Atlantic. https://www.theatlantic.com/ideas/archive/2020/05/quarantine-fatigue-real-and-shaming-people-wont-help/611482/ Accessed 7 Sept 2020
- Miami Dade (2020) Statement from Miami-Dade County mayor carlos A. Gimenez on expansion of mandatory mask order. Miami Dade Government. https://www.miamidade.gov/releases/2020-07-01-mayor-maskorder-expanded.asp. Accessed 12 July 2020
- Moon SG, Kim YK, Son WS, et al. Time-variant reproductive number of COVID-19 in Seoul, Korea. Epidemiol Health. 2020;42:e2020047. doi: 10.4178/epih.e2020047. [DOI] [PMC free article] [PubMed] [Google Scholar]
- Moraes R, Bari A, Zhu J. Restaurant health inspections and crime statistics predict the real estate market in New York City. In: Nicosia G, Pardalos P, Umeton R, Giuffrida G, Sciacca V, editors. Machine learning, optimization, and data science. LOD 2019. Lecture notes in computer science. Cham: Springer; 2019. [Google Scholar]
- Moran K, Fairchild G, Generous N, Hickmann K, Osthus D, Priedhorsky R, Hyman J, Del Valle SY. Epidemic Forecasting is Messier Than Weather Forecasting: The Role of Human Behavior and Internet Data Streams in Epidemic Forecast. The Journal of infectious diseases. 2016;214(4):S404–S408. doi: 10.1093/infdis/jiw375. [DOI] [PMC free article] [PubMed] [Google Scholar]
- National Security Research Division (2020) Tracking the spread of COVID-19 with air travel data. RAND. https://www.rand.org/nsrd/projects/cat-v.html. Accessed 13 July 2020
- New York (2020) Continuing temporary suspension and modification of laws relating to the disaster emergency. New York State Governor Andrew M. Cuomo. https://www.governor.ny.gov/news/no-20217-continuing-temporary-suspension-and-modification-laws-relating-disaster-emergency. Accessed 12 July 2020
- Nsoesie EO, Rader B, Barnoon YL, Goodwin L, Brownstein J (2020) Analysis of hospital traffic and search engine data in Wuhan China indicates early disease activity in the Fall of 2019. Digital Access to Scholarship at Harvard. https://dash.harvard.edu/handle/1/42669767. Accessed 13 July 2020
- Our World in Data (2020) https://ourworldindata.org. Accessed 8 Sept 2020
- Patel N (2019) Satellite images show how coronavirus brought Wuhan to a standstill. MIT Technology Review. https://www.technologyreview.com/2020/02/06/349057/satellite-images-show-how-coronavirus-brought-wuhan-to-a-standstill/. Accessed 13 July 2020
- Ritter Z, Brenan M (2020) New april guidelines boost perceived efficacy of face masks. Gallup. https://news.gallup.com/poll/310400/new-april-guidelines-boost-perceived-efficacy-face-masks.aspx. Accessed 12 July 2020
- Rui X (2015) Google search volume index: predicting returns, volatility and trading volume of tech stocks. Thesis. Duke University Economics Department. https://sites.duke.edu/djepapers/files/2016/10/xurui-dje.original.pdf. Accessed 13 July 2020
- Surgeon General (2020) Seriously people-STOP BUYING MASKS! United States Surgeon General. https://twitter.com/Surgeon_General/status/1233725785283932160?s=20. Accessed 12 July 2020
- Texas (2020) Executive order no. GA-29 relating to the use of face coverings during the COVID-19 disaster. Governor Greg Abbott. https://open.texas.gov/uploads/files/organization/opentexas/EO-GA-29-use-of-face-coverings-during-COVID-19-IMAGE-07-02-2020.pdf. Accessed 12 July 2020
- The COVID Tracking Project (2020) The Atlantic https://covidtracking.com. Accessed 8 Sept 2020
- The COVID Tracking Project (2020) The public deserves the most complete data available about COVID-19 in the US. No official source is providing it, so we are. The Atlantic. https://covidtracking.com. Accessed 13 July 2020
- The New York Times (2020) Coronavirus in the U.S.: latest map and case count. GitHub. https://github.com/nytimes/COVID-19-data/. Accessed 26 June 2020
- Thiam S, Delamou A, Camara S, et al. Challenges in controlling the Ebola outbreak in two prefectures in Guinea: why did communities continue to resist? Pan Afr Med J. 2015;22(Suppl 1):22. doi: 10.11694/pamj.supp.2015.22.1.6626. [DOI] [PMC free article] [PubMed] [Google Scholar]
- Viboud C, Simonsen L, Chowell G. A generalized-growth model to characterize the early ascending phase of infectious disease outbreaks. Epidemics. 2016;15:27–37. doi: 10.1016/j.epidem.2016.01.002. [DOI] [PMC free article] [PubMed] [Google Scholar]
- Waltz E (2020) How Facebook and Google track public’s movement in effort to fight COVID-19. IEEE Spectrum. https://spectrum.ieee.org/the-human-os/telecom/wireless/facebook-google-data-publics-movement-covid19. Accessed 13 July 2020
- Wang X, Daozhou G, Wang J. Influence of human behavior on cholera dynamics. Math Biosci. 2020;267:41–52. doi: 10.1016/j.mbs.2015.06.009. [DOI] [PMC free article] [PubMed] [Google Scholar]
- Yan QL, Tang SY, Xiao YN. Impact of individual behaviour change on the spread of emerging infectious diseases. Stat Med. 2018;37(6):948–969. doi: 10.1002/sim.7548. [DOI] [PubMed] [Google Scholar]


