Abstract
An argon plasma jet was sustained in open air and characterized for its chemical composition. The optically characterized plasma jet was used to treat industrial wastewater containing mixed textile dyes and heavy metals. Since plasma jet produces UV-radiations, the photocatalytic TiO2 was used to enhance plasma treatment efficiency especially for degradation of dyes. Mixed anatase and rutile phases of TiO2 (5.2–8.5 nm) were produced through surfactant assisted sol–gel approach. The emission spectrum confirmed the presence of excited argon, OH, excited nitrogen, excited oxygen, ozone and nitric oxide in the plasma jet. The spectral lines of excited Ar, NO, O3, OH−, N2, , O, and O+ species were observed at wavelength of 695–740 nm, 254.3 nm, 307.9 nm, 302–310 nm, 330–380 nm, 390–415 nm, 715.6 nm, 500–600 nm and 400–500 nm. These reactive species decompose the organic pollutants and separate the heavy metals from the water samples. The conductivity of plasma exposed water samples increased while pH and hardness decreased. The atomic absorption spectrophotometry analysis confirmed the presence of heavy metals in the samples, which were effectively removed through plasma treatment. Finally, the effect of plasma treatment on Staphylococcus aureus strains was more pronounced than Escherichia coli strains.
Subject terms: Chemistry, Engineering, Materials science, Physics
Introduction
The contamination of water bodies is generally caused by the release of pollutants into groundwater or into streams, lakes, estuaries, rivers and oceans. The polluting substances degrade the water quality and natural functioning of ecosystems1,2. In developing countries, the coliforms, pesticides, toxic metals and industrial effluents are the major sources of surface and subsurface groundwater pollution. The disposal of industrial effluents and heavy metals in water bodies raises the human health concerns, poisons the wildlife, and damages the long-term ecosystem3. Toxins in industrial effluents promote the reproductive failure, immune suppression and acute poisoning4. The bacterial strains in water release toxins in digestive tracts, which cause nausea, watery diarrhea, vomiting, renal failure and dehydration. The harmful bacteria are removed from water through antimicrobial treatment. In developed countries, strict regulations are imposed on industrial and agricultural operations to minimize the contamination of water bodies. Different methods are also being deduced to prevent the flow of pollutants into the water bodies and to remove the pollutants from wastewater5. With conventional water treatment techniques, such as chlorination, coagulation, adsorption, ultra-sonication, etc., it is difficult to eliminate all the harmful contaminants from the water. Recently, some advanced oxidation techniques like irradiation of high energy electrons, oxidation using ozone, ionizing radiations exposure, carbon absorption, plasma exposure and sonolysis have been practiced for the treatment of contaminated waters4.
The non-thermal plasma jet is one of the best oxidation methods available for the treatment of polluted water. A non-thermal plasma jet is an electrically energized gas, which is produced by passing a gas through a strong electric field6. Instead of just gas heating, the bulk of electric field energy goes into the creation of energetic plasma species. These species include positive ions, electrons, negative ions, free radicals, electrically neutral gas atoms and or molecules and electromagnetic radiations. Being strong oxidizers, the plasma species strongly interact with the contaminated media and decompose the organic and inorganic compounds in the media. These plasma species also kill the bacterial endospores and vegetative cells. The highly energized photons, ozone, atomic oxygen, and free reactive oxygen radicals in the plasma damage the cells by charging the cell wall and reacting with macromolecules. Since membrane lipids at the cell surface are susceptible to the reactive oxygen species, the oxidized cytoplasmic membrane lipids release intracellular substances, which damage the cells. Moisan et al.7 proposed some mechanisms of inactivation of microbial spores under non-thermal plasma exposures. These mechanisms are based on interaction of ultraviolet radiations with spore surface and volatilization of surface compounds, damaging of DNA by ultraviolet irradiation, and erosion or etching of spore surface with reactive oxygen radials.
The reactive oxygen radials and nitrogen oxides in plasma jet not only kill the living organisms but decompose the organic and inorganic compounds as well4,8. If a suitable photocatalyst is added to the contaminated water, the plasma treatment of polluted water may be more effective. Titanium dioxide (TiO2) is a well-known photocatalyst. Under suitable light exposure, it converts the pesticides, polymers, surfactants, aliphatics, aromatics, herbicides and dyes into water, mineral acids and carbon monoxide9. TiO2 is a polymorphous material, which exists in anatase, rutile and brookite phases. All these phases show octahedral structures but differ in the arrangement of their octahedral units10,11. Anatase phase is the most prominent commercial phase of TiO2 due to its better stability and photocatalytic activity as compared to rutile and brookite phases4. TiO2 nanoparticles are also known for good surface acidity, good thermal and chemical stabilities and low toxicity potential12. Karami et al.13 and Wang et al.14 revealed that photocatalytic and semiconducting activities of anatase phased TiO2 mainly depends on crystal structure, crystallite size, shape, active surface area and overall morphology. The specific optical and structural properties of TiO2 nanostructures can be tailored through a deliberately chosen and well optimized method of synthesis. In many cases, sol–gel method is preferred over other methods when it comes to low cost production of nanomaterials, ceramics and glass. In this study, a sol–gel method was adopted to produce mixed anatase and rutile phases of TiO2 nanoparticles. The photoactive TiO2 was used to degrade the organic compounds in contaminated water under direct current plasma exposure.
Materials and methods
Preparation of TiO2 photocatalyst
TiO2 catalyst was produced by practicing a simple sol–gel technique. Hydrochloric acid was used as a surfactant. In a typical procedure, 45 ml of solution-I was obtained by dissolving 15 ml of deionized water in 30 ml of iso-propanol and stirring continuously at 80 °C. Then, solution-II was obtained by dripping 30 ml of titanium tetra iso-propoxide (TTIP) in solution-I under continuous stirring at 80 °C for 1 h. The water-acid mixture (1.5 ml of HCl or HNO3 diluted with 50 ml of deionized water) was added to solution-II under stirring. The temperature was reduced from 80 to 60 °C to obtain solution-III. This solution was stirred continuously at 60 °C to obtain white thick precipitated solution, which turned into a transparent white sol after 3 h. To complete the process of hydrolysis and condensation, the sol was stirred further for 150 min. The resultant gel was annealed for 2 h at 300 °C and grinded into fine powder of TiO212.
The synthesized TiO2 powder was characterized for its surface morphology, particle size, crystallographic phases and band gap energy. The surface morphology was analyzed from SEM images of the sample, particle size and crystallographic phases were analyzed from XRD spectrum and band gap energy was determined from UV–visible spectrum of the sample. After characterizing the photocatalyst, it was used in degrading the pollutants in water under atmospheric plasma exposure.
Plasma treatment setup
A plasma jet was sustained with DC voltage by flowing argon gas through open air and characterized for its chemical composition by using an optical emission spectroscopy technique. Figure 1 shows a schematic of DC plasma jet and associated optical emission spectroscopy diagnostic. The plasma jet is formed of a copper nozzle cathode. The diameter and length of the nozzle is 2 mm and 50 mm, respectively. A 3 mm thick tungsten wire was used as an anode, which was in direct contact with water sample. The cathode was fixed above the water container with a small gap of 10 mm. The gap between electrodes was measured about 30 mm. A DC voltage of 10 kV was applied between cathode and anode. A blast resistance of 150 k Ω was added between cathode and negative terminal of the battery. This safety resistance is used to avoid the breakdown and short circuiting between electrodes during treatment process. An argon-air plasma jet was produced in open atmosphere between cathode and water by supplying argon gas through cathode capillary. This plasma jet interacted with water and transferred the reactive species to the water.
Figure 1.
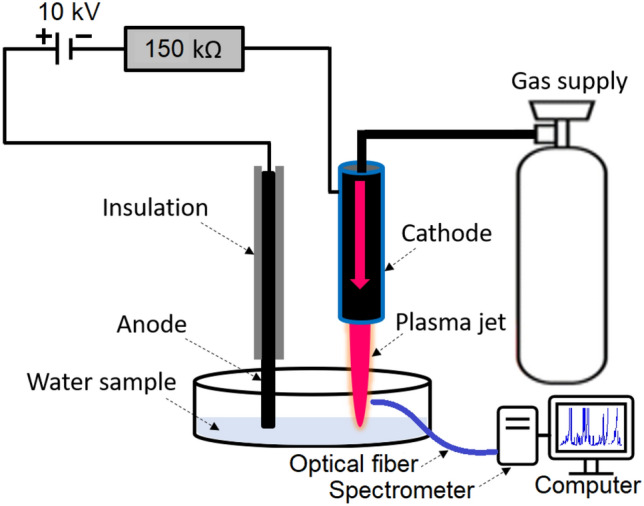
Schematic of DC plasma jet and associated optical emission spectroscopy diagnostic.
Plasma–water interaction
The plasma jet may contain positive ions, negative ions, electrons, neutral species and excited species, depending on the environmental conditions. In addition, the plasma jet also releases ultraviolet radiations, which derive the photocatalytic activity of TiO2 catalyst. The anticipated plasma jet composition was Oxygen, Nitrogen, Argon ions, excited Argon atoms, neutral Argon atoms, carbon dioxide, nitric oxide, nitrogen dioxide and ozone. The removal of contaminants from water and degradation of organic pollutants takes place when reactive plasma species interact with water body. The oxidation potentials of major reactive radicals are given in Table 1. Optical emission spectroscopy (OES) of the jet was performed to check the presence of reactive species. An optical fiber was used to collect the jet glow signal and to transmit to an Ocean Optic Spectrometer. The spectrometer was attached to a computer where optical emission spectrum of the plasma jet was recorded and analyzed. The light signal was collimated and focused onto the detector where the light signal was converted into an electrical signal. The electrical signal was recorded in the form of a spectrum. The spectrum was recorded in the range of 300–750 nm with an optical resolution of 0.025 nm.
Table 1.
Oxidation potentials of major reactive radicals or oxidizers.
| Oxidizer | Oxidation potential (V) |
|---|---|
| O· | 2.42 |
| Ozone (O3) | 2.07 |
| Hydroxyl radical (OH) | 2.80 |
| Hydrogen peroxide (H2O2) | 1.77 |
| Permanganate ion | 1.67 |
| Chlorine | 1.36 |
| Chlorine oxide | 1.50 |
After OES of the jet, it was used to process the wastewater samples. The water samples were collected from different sites and sources. The details of water sampling are provided in Table 2. In first step, all the water samples were simply plasma treated for 10 min and filtered. In second step, the water samples were treated for the same period in the presence of TiO2 catalyst. The catalyst was added to degrade the dyes in the sample under plasma exposure. The treated water was filtered and the residue was analyzed for its chemical composition. The quality of untreated and treated water samples was checked by determining TDS value, pH, conductivity, turbidity, color, etc. The reactive species and ultraviolet radiations in plasma can also kill the bacteria in water during treatment. To check the antibacterial activity of the plasma, the gram-negative and gram-positive bacteria cultures were treated with the jet for 5 min. The colony forming units of bacterial after plasma treatment were counted to study the antibacterial activity of the reactive plasma species.
Table 2.
Labeling of untreated, plasma treated and plasma/catalyst treated water samples.
| Sample labeling before treatment | Sample labeling after plasma treatment | Sample labeling after plasma/catalyst treatment | Sample source |
|---|---|---|---|
| X1, X2 and X3 | Y1, Y2 and Y3 | Z1, Z2 and Z3 | Tap water collected from different sites |
| X4 | Y4 | Z4 | Effluent of textile industry which contain dyes |
| X5 | Y5 | Z5 | Mixed wastewater of chemical industry |
| X6 | Y6 | Z6 | River water |
| X7 | Y7 | Z7 | Wasted water of filtration plant |
Ethical approval
This article does not contain any studies with human participants or animals performed by any of the authors.
Results and discussion
Characteristics of TiO2 catalyst
Figure 2 shows XRD patterns of TiO2 nanoparticles. The catalyst nanoparticles were composed of mixed anatase and rutile phases. The planes (101), (004), (020) and (121) of anatase phase were identified at 2θ of 25.5°, 38°, 48°and 54°, respectively. Similarly, XRD peaks at 2θ of 27.5°, 36° and 56° correspond to (110), (101) and (220) planes of rutile phase of TiO2. The plane (111) at 2θ of 42° reveals both anatase and rutile phases15,16. XRD pattern confirmed the crystalline nature of the nanoparticles. The particle size of the synthesized catalyst was determined using the Scherrer’s formula:
| 1 |
where, S is the particle size, K is shape factor or Scherrer constant and is usually equals to 0.89 for spherical shape, λ is the wavelength of X-rays, β is known as full width at half maximum height and θ is known as Bragg’s angle.
Figure 2.
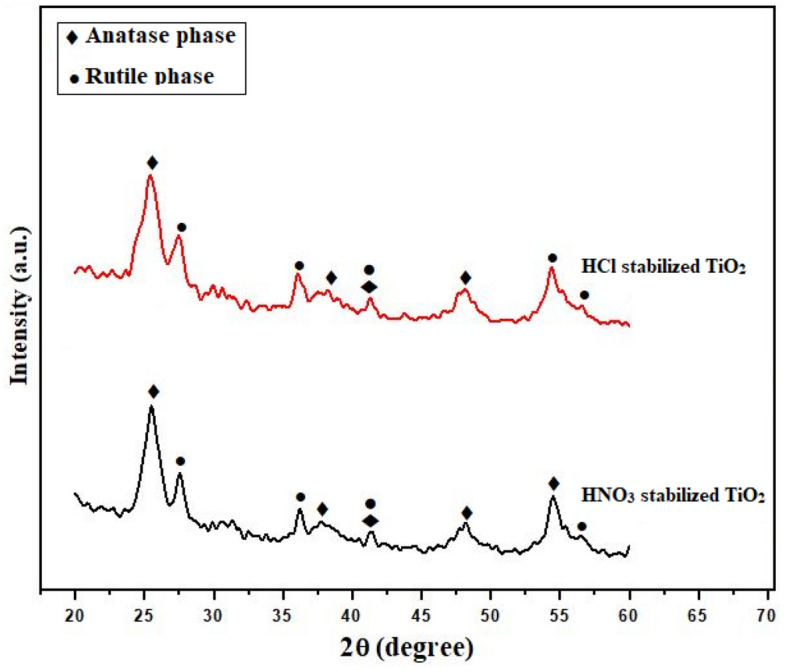
XRD patterns of TiO2 nanoparticles stabilized with HCl and HNO3 surfactants.
The particle size of catalyst varied from 5.2 to 8.5 nm. The particle size of HNO3 stabilized nanoparticles remained slightly smaller than HCl stabilized nanoparticles. The surfactants found to be ineffective on phase transformation of TiO2 nanoparticles, which mainly depends on the heat treatment12,17. The morphology of TiO2 nanoparticles was assessed through scanning electron microscopy. The agglomerated spherical nanoparticles were observed in SEM images. Figure 3 shows a typical SEM image of TiO2 nanoparticles. In some cases, the formation of agglomerates expands the boundaries between the nanoparticles by changing their shape and size18,19.
Figure 3.
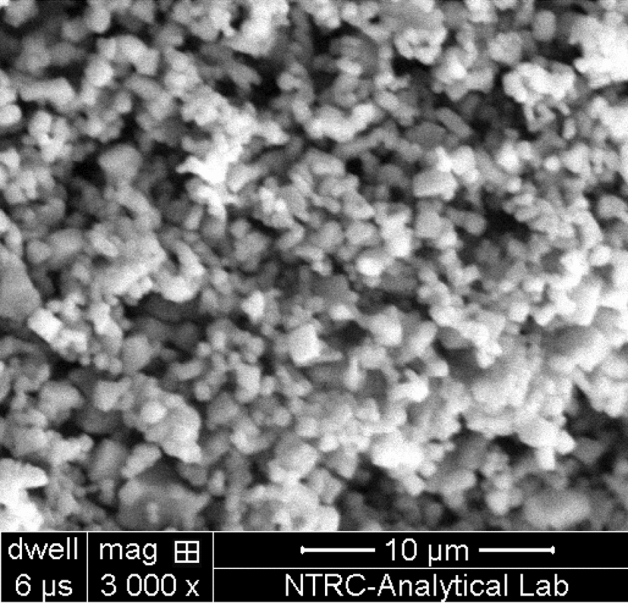
SEM micrograph of TiO2 nanoparticles.
The band gap energy of TiO2 catalyst was determined using Kubelka–Munk equation and UV–visible spectrum of the catalyst20,21. The Tauc-Plot of the nanoparticles is shown in Fig. 4. The band gap energy of the nanoparticles was measured about 3.06 eV. The band gap energy of nanoparticles depends on particles22. The particle size dependent band gap energy of the catalyst is summarized in Table 3. The band gap energy of the catalyst decreased with an increase in particle size. The change in band gap energy might also be due to phase transformations (i.e. amorphous–anatase–rutile) or induction of charge from bulk to nanocrystals' surface23,24.
Figure 4.
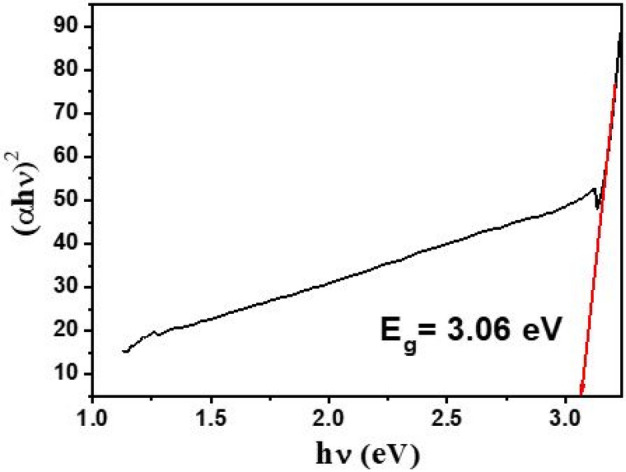
The Tauc-Plot of TiO2 nanoparticles for determination of band gap energy.
Table 3.
Particle size dependent band gap energy of the synthesized TiO2 samples.
| Particle size (nm) | Band gap energy (eV) |
|---|---|
| 6.4 | 3.12 |
| 5.2 | 3.18 |
| 6.8 | 3.11 |
| 8.1 | 3.02 |
| 7.4 | 3.06 |
| 8.5 | 2.96 |
Optical emission spectroscopy of plasma jet
Figure 5 shows a typical optical emission spectrum of argon plasma jet having OH, excited nitrogen and oxygen radicals from the air25. The emission spectrum confirmed the presence of excited argon, OH, excited nitrogen, excited oxygen, ozone and nitric oxide in the plasma jet. The energetic electrons in the jet excite and ionize the oxygen and nitrogen from the surrounding air. Oxygen molecules break into atomic oxygen to generate ozone through a three-body reaction. On the other hand, the nitrogen in its ground state gets excited due to multiple collisions with electrons as:
| 2 |
Figure 5.
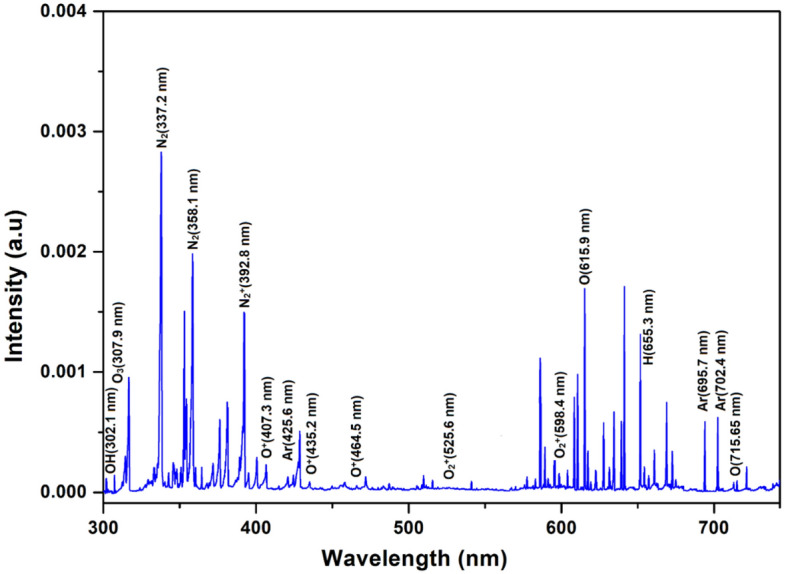
Optical emission spectrum of argon plasma jet in open atmosphere.
The state gets populated through electron impact excitation of ground state and metastable state. Other than electron impact excitation, the associate excitation, penning excitation, pooling reactions and transfer of energy among the colliding particles also populate state25. This excited state decays into second positive system of nitrogen by emitting a characteristic photon of (0–0) band6 as:
| 3 |
The second positive system reacts with oxygen molecules to form oxygen radicals, nitrous oxide and ozone. Again, the excited state of nitrogen gets populated during direct impact ionization of nitrogen in the ground state . The populated excited state decays into a first negative system by emitting characteristic photon of (0–0) band. The intensity of the emitted radiations is always proportional to the population density of the excited state.
The presence of excited Ar, NO, O3, OH−, N2, , O, and O+ species in the open atmospheric plasma jet was confirmed from the emission line intensities in optical spectrum at 695–740 nm, 254.3 nm, 307.9 nm, 302–310 nm, 330–380 nm, 390–415 nm, 715.6 nm, 500–600 nm and 400–500 nm, respectively26. The emission intensities ratios of the identified species and the second positive system of the nitrogen were found higher in the beginning of the plasma jet excitation. It reveals that the surrounding air quickly diffuses into the jet and the nitrogen concentration increases along the jet flow. Sretenović27 characterized the free expanding plasma jet in an open atmosphere. The plasma jet was impinged onto the water surface and characterized for chemical species by generating FTIR spectra at the water-plasma interface. Figure 6 shows a typical FTIR spectrum they produced during water-plasma interaction in ambient air. FTIR absorption detection confirmed the presence of NO, N2O, NO2, HNO3 and HNO2 reactive species in the plasma exposed water. The formation of ozone was also noticed during water-plasma interaction both in ambient air and in nitrogen rich environment.
Figure 6.
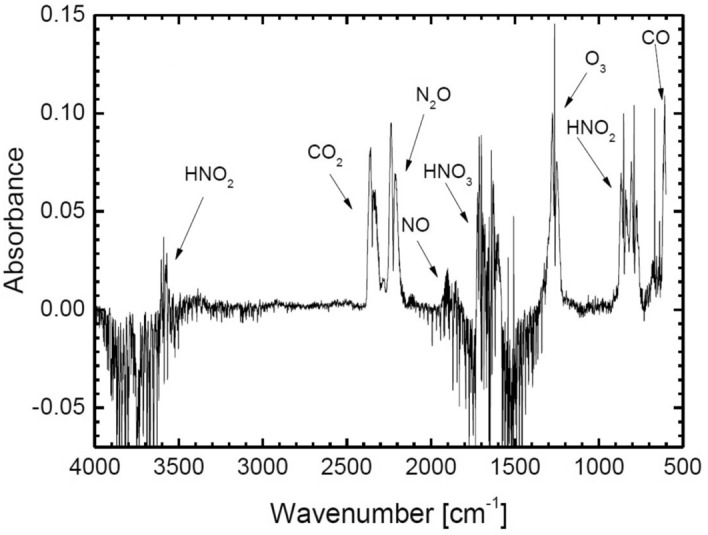
FTIR spectrum of plasma jet during interaction with water in ambient air27.
Water quality parameters
The water quality was checked by determining TDS, pH, conductivity, hardness and color of the samples. Table 4 shows that pH of the water samples noticeably decreased after plasma treatment with and without using a catalyst. The catalyst did not show significant effect on pH of water during plasma treatment. The possible reduction in pH of treated water is referred to the formation of HNO2, HNO3 and other active ions during water-plasma interaction. The hydrogen ion concentration in water increased with a decrease in pH and so does the water conductivity. Since conductivity depends on concentration of all the active ions present in the sample, pH by itself did not specify the water conductivity. Therefore, pH of water samples did not provide any information about other active ions affecting the conductivity of water. In fact, all the ions in the sample contribute to conductivity. The faster the ions travel towards the opposite electrodes, more conductivity they lead to. The electrical conductivity of treated water samples may also be affected by the type of intermediates formed during plasma-water interaction.
Table 4.
Water quality parameters of untreated, plasma treated and plasma/catalyst treated water samples.
| Sample | pH | Conductivity (µS/cm) | TDS (mg/l) | Hardness (mg/l) | Sulfates (mg/l) | Phosphates (mg/l) |
|---|---|---|---|---|---|---|
| X1 | 8.3 | 2007 | 1030 | 58 | 59 | 3.5 |
| Y1 | 7.6 | 2046 | 1040 | 49 | 48 | 3.3 |
| Z1 | 7.5 | 2048 | 1020 | 47 | 40 | 2.6 |
| X2 | 7.9 | 831 | 420 | 384 | 54 | 3.3 |
| Y2 | 7.3 | 892 | 420 | 408 | 43 | 2.6 |
| Z2 | 7.4 | 889 | 430 | 400 | 44 | 2.9 |
| X3 | 7.9 | 4660 | 2370 | 456 | 58 | 2.6 |
| Y3 | 7.5 | 4728 | 2370 | 504 | 52 | 2.8 |
| Z3 | 7.3 | 4739 | 2390 | 480 | 52 | 3.4 |
| X4 | 12.2 | 7045 | 4100 | ND | 57 | 2.8 |
| Y4 | 11.6 | 7971 | 3960 | ND | 49 | 3.3 |
| Z4 | 11.6 | 7968 | 3810 | ND | 50 | 3.2 |
| X5 | 7.8 | 1220 | 620 | 416 | 52 | 3.4 |
| Y5 | 7.3 | 1252 | 620 | 416 | 49 | 3.6 |
| Z5 | 7.2 | 1255 | 630 | 440 | 47 | 3.3 |
| X6 | 7.9 | 440 | 230 | 184 | 53 | 3.5 |
| Y6 | 7.4 | 474 | 240 | 192 | 50 | 3.2 |
| Z6 | 7.4 | 477 | 240 | 200 | 48 | 3.5 |
| X7 | 7.8 | 5350 | 2740 | 872 | 48 | 2.9 |
| Y7 | 7.5 | 5429 | 2770 | 792 | 44 | 3.5 |
| Z7 | 7.3 | 5442 | 2770 | 944 | 41 | 3.6 |
The plasma treated samples showed maximum decrease in pH. Most of the untreated water samples were alkaline in nature, which started to neutralize on plasma treatment. There was no significant effect of plasma treatment on the total dissolved solid in water except sample X4. This sample exhibited a decrease in TDS by 140 points and 190 points after noncatalytic and catalytic plasma treatment. The hardness of water samples also decreased after plasma treatment. Water with a low pH was less hard, while water with a higher pH was harder or alkaline. The degradation of organic pollutants and dyes in particular increased in the presence of TiO2 catalyst and reactive plasma species like Ar, NO, O3, OH, N2, , O, and O+. The presence of these reactive species was confirmed through optical emission spectroscopy. Some sulfates and phosphates were also detected in the water samples. The sulfate ions in water samples reacted with plasma generated OH radicals. The degradation of organic pollutants decreases with a decrease in availability of OH radicals. It reveals that for complete degradation of all organic pollutants, prolonged plasma treatment will be needed. Ghezzr et al.28 reported that degradation of pollutants in water starts after 20 min of treatment time. The pollutants’ degradation efficiency was measured about 95% after 60 min of noncatalytic plasma treatment. In the presence of TiO2 catalyst, the same degradation efficiency was possible only after 30 min of treatment time. It is worth noting that the treatment time mainly depends on plasma intensity and the population of the reactive species. The plasma treatment also cause mineralization of water samples due to formation of chloride ions, sulphate ions and phosphate ions.
Hu et al.29 performed photocatalytic decomposition of dyes with TiO2 catalyst. The role of inorganic ions in activity of TiO2 for dye degradation was investigated. Each dye degraded differently depending on pH of the solution. The sulfate and phosphate ions in the water showed significant effect on dye degradation process. Ghezzar et al.28 treated textile wastewaters of different pH values. The wastewater contained azo dyes. A gliding arc discharge plasma was used to treat the dye containing textile wastewaters in the presence of TiO2 catalyst. They investigated the role of plasma treatment time and catalyst in degradation of azo dyes. The photocatalytic activity of TiO2 was reported higher for the water samples of high pH. The degradation efficiency improved with an increase in treatment time.
Study of heavy metals
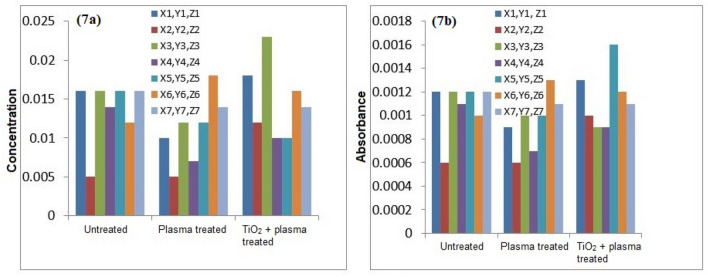
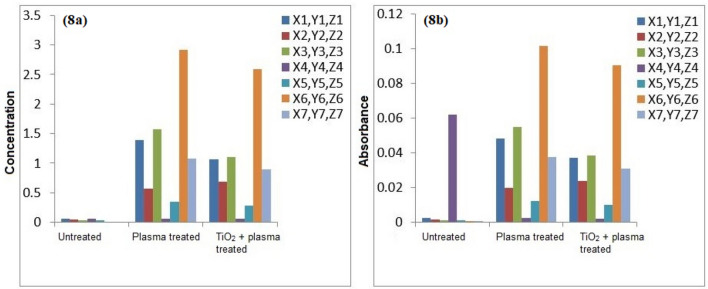
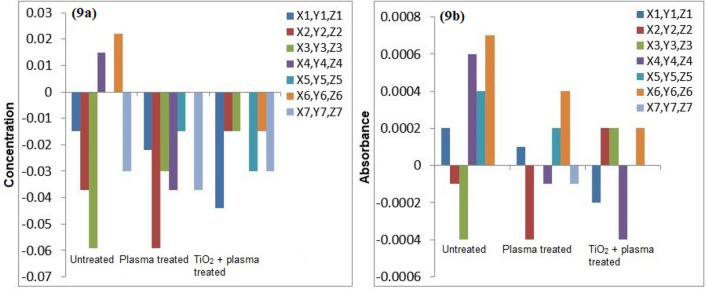
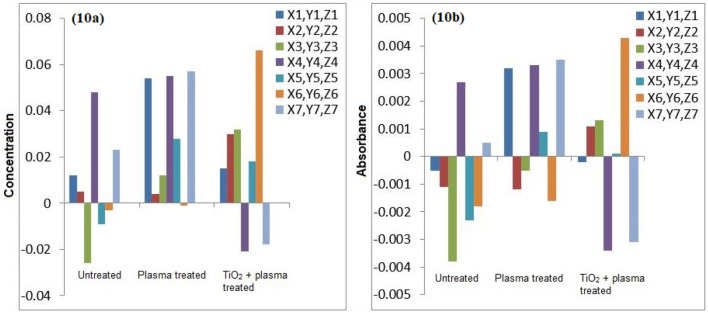
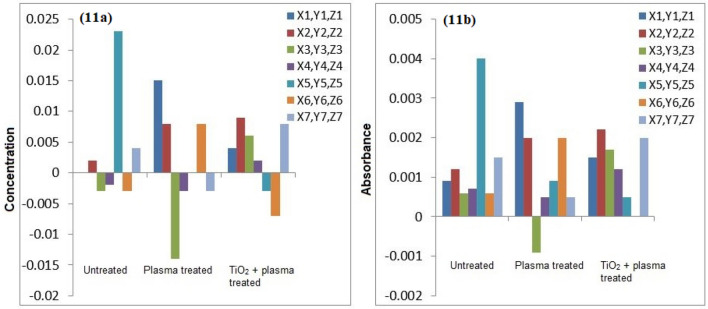
The atomic absorption spectrophotometry of the untreated and plasma treated water samples was conducted for detection of heavy metals. Figures 7, 8, 9, 10 and 11 confirm the presence of Ni, Cd, Pb, Cr and Cu in the wastewater. Significant amount of heavy metals was detected in the samples. The heavy metals’ content increased on plasma treatment due to mineralization of water samples. Some chloride ions, sulphate ions and phosphate ions also form during plasma treatment. Initially, the water samples were slightly alkaline, which started to neutralize on plasma treatment. Ke et al.30 revealed that removal of heavy metals from wastewater is pH dependent. They used argon plasma discharge for removal of chromium through reduction process at plasma–water interface. The reduction efficiency was found higher for solutions with initial pH less than 2 or greater than 8. The reduction efficiency increased on addition of ethanol in the solution. The high reduction efficiency promotes the removal of heavy metals from plasma exposed solution in the form of sediments.
Figure 7.
(a) Comparison of Cr concentration (mg/l), (b) Comparison of Cr absorbance (mg/l).
Figure 8.
(a) Comparison of Cu concentration (mg/l), (b) Comparison of Cu absorbance (mg/l).
Figure 9.
(a) Comparison of Pb concentration (mg/l), (b) Comparison of Pb absorbance (mg/l).
Figure 10.
(a) Comparison of Ni concentration (mg/l), (b) Comparison of Ni absorbance (mg/l).
Figure 11.
(a) Comparison of Cd concentration (mg/l), (b) Comparison of Cd absorbance (mg/l).
As shown in Fig. 8, the removal of Cu in plasma and plasma/TiO2 treated water samples was found higher than the untreated water. The removed metals settle at the bottom, which were removed through filtration. The residue of untreated water contained negligible amount of Cu. The removal of metals from treated water increases due to the formation of byproducts in the water during plasma exposure. The Pb removal efficiency of plasma treatment was significant higher. After plasma treatment, Pb was not detected in water samples. Similar trend was predicted for other metals.
Icopini et al.31 removed Cr from water samples of different pH values. The metal removal efficiency was reported higher for lower pH values. It was revealed that Cr containing samples would be neutral or positively charged when pH of the sample is low. In the presented work, pH of solution decreases on plasma treatment, which promotes the removal of metals. Cserfalvi et al.32 tested an atmospheric gas discharge technique for determination of heavy metals in different solutions. For lower pH values, the sputtering of solution surface during plasma exposure and subsequent excitations within the solution were observed. Using electrolyte-cathode discharge spectrometry technique, they identified Ni, Pb, Cu, Zn, Mn and Cd metals in the aqueous solutions. The emission peak intensity and concentration of these metals depended on pH of solution and hydrogen ion concentration during plasma exposure.
FTIR and XRD analysis of residue
Figure 12 shows FTIR spectra of untreated and plasma treated samples. FTIR analysis confirmed the presence of amines, hydroxyl groups, amides, esters, ethers, anhydrides and carboxylic acids in the sample. The N–H stretching of primary amines, aromatic amines and amides was observed in the wavenumber range of 3320–3520 cm−1. Eithers with C–O–C linkage were observed in the wavenumber range of 1070–1240 cm−1. Sulfates had SO2 symmetric stretching in the wavenumber range of 1140–1200 cm−1. Similarly, ketones with C–C=O group were identified in the wavenumber of 510–560 cm−1. The reported results were inline with the findings of Tichonovas et al.8. They treated polluted water samples with a barrier discharge system. The plasma treated samples contained amides, amines, carboxylic acids and nitrates.
Figure 12.
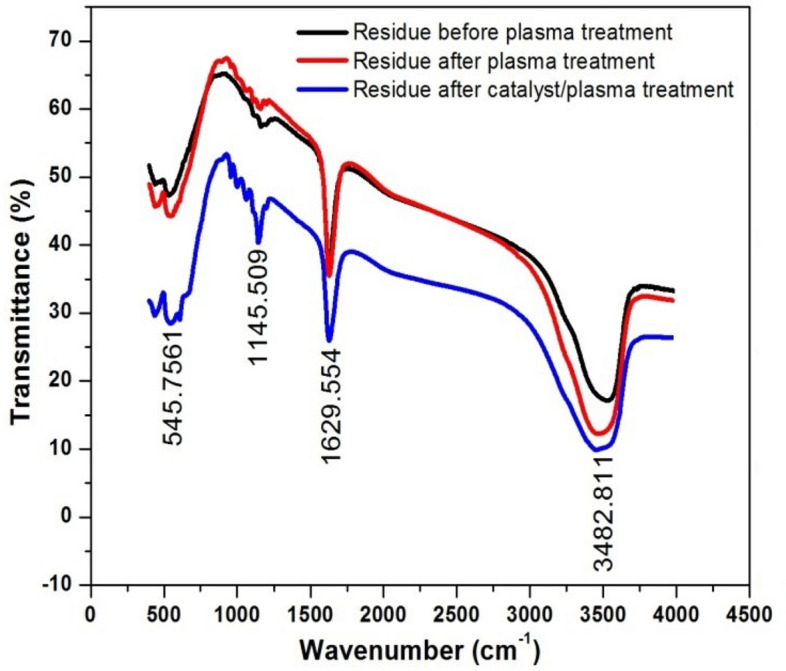
FTIR profiles of solid residues of untreated and treated wastewater.
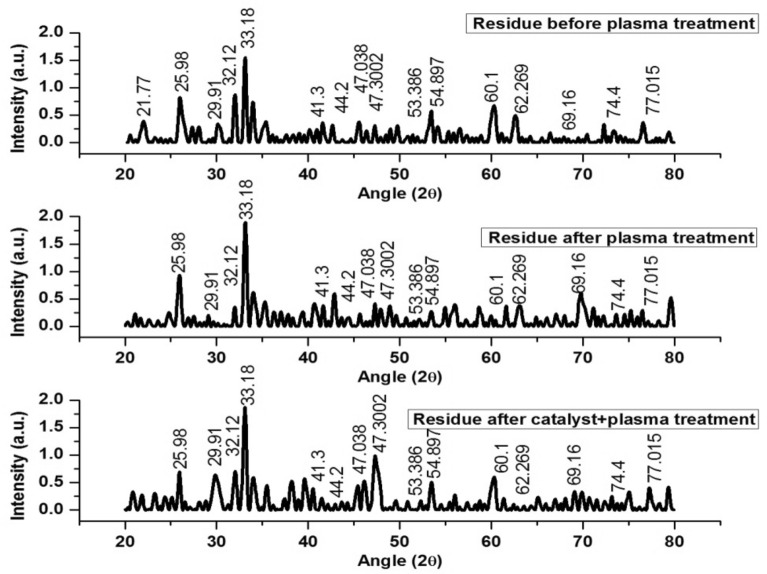
The water samples were filtered to remove the solid residue. The residue was characterized for its chemical composition. Figure 13 shows XRD spectra of the residue of untreated and treated wastewater samples. XRD peaks at 2θ of 25.98°, 29.91°, 32.12°, 44.2°, 47.038°, 47.30°, 54.9°, 60.1°, 69.16° and 74.4° correspond to S, Alite (triclinic), ferrite, Ni, CdS, Si, SiO4, Ag, Pb, CdO and Cu, respectively. Similarly, XRD peaks at 2θ of 41.3° and 53.386° correspond to Cr3O4, 21.77° and 33.18° correspond to Aluminate, and 62.269° and 77.015° correspond to Pb. The peak at 47.3002 shows the presence of 220 plane of Si. Alite, ferrite and aluminate had similar peaks as described somewhere else33. Sharma et al.33 treated polluted water with metallic nanoparticles. The nanoparticles were used to remove heavy metals for the wastewater. Several metals were identified and removed from industrial effluents collected from different industrial sites in India.
Figure 13.
XRD profiles of solid residues of untreated and treated wastewater.
Antibacterial activity of plasma species
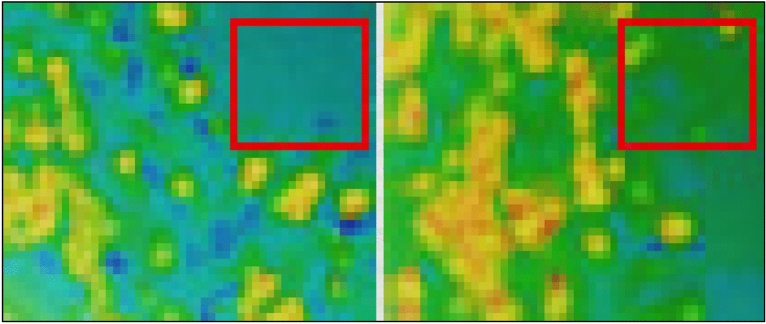
As discussed earlier, the plasma jet contained some strong oxidizers, which can easy kill the bacterial endospores and vegetative cells. Other than the plasma born ultraviolet radiations, the ozone, atomic oxygen and free reactive oxygen radicals also damage the cells by charging the cell wall and reacting with macromolecules. Since membrane lipids at the cell surface are susceptible to the reactive oxygen species, the oxidized cytoplasmic membrane lipids release intracellular substances, which damage the cells. The ultraviolet radiations interact with spore surface and cause volatilization of the surface compounds and damaging of DNA. The reactive oxygen radicals apply the electrostatic forces by charging the cell wall and oxidize the spore surface. In this study, the effect of plasma on inactivation of different bacteria in water was investigated. The culture of Escherichia coli (gram positive) and Staphylococcus aureus (gram negative) was subjected to the plasma exposure. The efficacy of plasma treatment to inactivate the bacteria was determined by observing colony forming unit (CFU) counts before and after plasma exposure. Figure 14 shows photographically the plasma exposed regions of the bacterial culture. The plasma treated regions are marked with square boundaries. A colony counter was used to find the CFU/plate. Significant reduction in CFU was observed after plasma exposure. Roughly, 98% decay of both cultures was observed after treatment time of 5 min.
Figure 14.
Scattering configuration of bacteria CFUs on the petri dish before and after plasma treatment for 5 min: Staphylococcus aureus (left image) and Escherichia coli (right image).
Initially, without any plasma exposure, the effect of air on bacteria deactivation was observed. The air flow did not show any effect on bacterial CFU. Thereafter, bacteria cultures were exposed to plasma and CFUs were counted before and after plasma exposure in the marked area of the petri dish. Since bacteria have several protective layers surrounding the genetic nucleus, it was difficult to kill them in the unexposed areas. However, all the bacterial were dead in the areas directly exposed to plasma. For prolonged plasma exposure, the bacteria in the adjacent regions also started to deactivate. The effect of plasma treatment on Staphylococcus aureus was more pronounced than the Escherichia Coli. All the Staphylococcus aureus cells in the plasma exposed region were found dead after 5 min of treatment while some Escherichia Coli cells were still alive in the plasma exposed region. It is possible to neutralize all the cells by increasing the treatment time.
Conclusions
Catalytic plasma treatment of wastewaters was conducted in ambient air in the presence of TiO2 catalyst. The catalyst nanoparticles were composed of mixed anatase and rutile phases with particle size in the range of 5.2–8.5 nm. The optical emission spectroscopy confirmed the presence of excited argon, OH, excited nitrogen, excited oxygen, ozone and nitric oxide in the plasma jet. The energetic electrons in the jet excited and ionized the oxygen and nitrogen from the surrounding air. The spectral lines of Ar, NO, O3, OH−, N2, , O, and O+ species were observed at wavelength of 695–740 nm, 254.3 nm, 307.9 nm, 302–310 nm, 330–380 nm, 390–415 nm, 715.6 nm, 500–600 nm and 400–500 nm. These reactive plasma species degraded the organic pollutants and separated the heavy metals from the wastewater. The conductivity of the water samples increased while pH and hardness decreased on treatment. The atomic absorption spectrophotometry of the samples confirmed the presence of heavy metals, which were effectively removed through plasma treatment. FTIR analysis confirmed the presence of amines, hydroxyl groups, amides, esters, ethers, anhydrides and carboxylic acids in the samples. XRD analysis of the solid residue confirmed the presence of S, Alite (triclinic), ferrite, Ni, CdS, Si, SiO4, Ag, Pb, CdO, Cu, Cr3O4 and Aluminate in the samples. On the antibacterial side, the effect of plasma treatment on Staphylococcus aureus was more pronounced than the Escherichia coli. Overall, 98% decay of both bacterial cultures was observed after plasma treatment for 5 min. These findings confirm that the reported plasma jet technique is effective for degradation of organic pollutants, inactivation of bacterial and separation of inorganic pollutants from the wastewaters.
Acknowledgements
This research is funded by the Deanship of Scientific Research at the King Saud University, Riyadh, Saudi Arabia under the Project No. RG-1439-70.
Author contributions
M.Y.N. and S.S. designed the plasma jet treatment system and conducted the experiments. R.M. and Y.K. studied the spectroscopy and antibacterial activity of the argon plasma jet. S.U.R. and A.A.A.-A. performed the data analysis. M.Y.N. and S.S. drafted the paper. Y.K. reviewed the paper draft and secured the research grant for this project and will be paying the publication fee from the grant approved on his name.
Competing interests
The authors declare no competing interests.
Footnotes
Publisher's note
Springer Nature remains neutral with regard to jurisdictional claims in published maps and institutional affiliations.
References
- 1.Abinandan S, Shanthakumar S. Challenges and opportunities in application of microalgae (Chlorophyta) for wastewater treatment: A review. Renew. Sustain. Energy Rev. 2015;52:123–132. doi: 10.1016/j.rser.2015.07.086. [DOI] [Google Scholar]
- 2.Naz MY, Sulaiman SA. Attributes of natural and synthetic materials pertaining to slow-release urea coating industry. Rev. Chem. Eng. 2017;33:293. doi: 10.1515/revce-2015-0065. [DOI] [Google Scholar]
- 3.Hussain Z, Sultan N, Ali M, Naz MY, AbdEl-Salam NM, Ibrahim KA. Thermochemical conversion of waste glass and mollusk shells into an absorbent material for separation of direct blue 15 azo dye from industrial wastewater. ACS Omega. 2020;5:18114–18122. doi: 10.1021/acsomega.0c01680. [DOI] [PMC free article] [PubMed] [Google Scholar]
- 4.Shukrullah S, Bashir W, Altaf NUH, Khan Y, Al-Arainy AA, Sheikh TA. Catalytic and non-catalytic treatment of industrial wastewater under the exposure of non-thermal plasma jet. Processes. 2020;8:667. doi: 10.3390/pr8060667. [DOI] [Google Scholar]
- 5.Azizullah A, Khattak MNK, Richter P, Häder DP. Water pollution in Pakistan and its impact on public health—A review. Environ. Int. 2011;37:479–497. doi: 10.1016/j.envint.2010.10.007. [DOI] [PubMed] [Google Scholar]
- 6.Naz MY, Shukrullah S, Ghaffar A, Rehman NU, Sagir M. A low-frequency dielectric barrier discharge system design for textile treatment. Synthesis React. Inorg. Metal-Org. Nano-Metal Chem. 2016;46:104–109. doi: 10.1080/15533174.2014.900789. [DOI] [Google Scholar]
- 7.Moisan M, Barbeau J, Crevier MC, Pelletier J, Philip N, Saoudi B. Plasma sterilization. Methods and mechanisms. Pure Appl. Chem. 2002;74:349–358. doi: 10.1351/pac200274030349. [DOI] [Google Scholar]
- 8.Tichonovas M, Krugly E, Racys V, Hippler R, Kauneliene V, Stasiulaitiene I, et al. Degradation of various textile dyes as wastewater pollutants under dielectric barrier discharge plasma treatment. Chem. Eng. J. 2013;229:9–19. doi: 10.1016/j.cej.2013.05.095. [DOI] [Google Scholar]
- 9.Lusvardi G, Barani C, Giubertoni F, Paganelli G. Synthesis and characterization of TiO2 nanoparticles for the reduction of water pollutants. Materials. 2017;10:1208. doi: 10.3390/ma10101208. [DOI] [PMC free article] [PubMed] [Google Scholar]
- 10.Yahaya, M. Z., Azam, M. A., Teridi, M. A. M., Singh, P. K. & Mohamad, A. A. Recent characterisation of sol–gel synthesised TiO2 nanoparticles. In Recent Applications in Sol–Gel Synthesis (ed Usha Chandra) (IntechOpen, 2017). https://www.intechopen.com/books/recent-applications-in-sol-gel-synthesis/recent-characterisation-of-sol-gel-synthesisedtio2-nanoparticles
- 11.Elbushra H, Ahmed M, Wardi H, Eassa N. Synthesis and characterization of TiO2 using sol–gel method at different annealing temperatures. MRS Adv. 2018;3:2527–2535. doi: 10.1557/adv.2018.230. [DOI] [Google Scholar]
- 12.Andrade-Guel M, Díaz-Jiménez L, Cortés-Hernández D, Cabello-Alvarado C, Ávila-Orta C, Bartolo-Pérez P, et al. Microwave assisted sol–gel synthesis of titanium dioxide using hydrochloric and acetic acid as catalysts. Boletín de la Sociedad Española de Cerámica y Vidrio. 2019;58:171–177. doi: 10.1016/j.bsecv.2018.10.005. [DOI] [Google Scholar]
- 13.Karami A. Synthesis of TiO2 nano powder by the sol–gel method and its use as a photocatalyst. J. Iran. Chem. Soc. 2010;7:S154–S160. doi: 10.1007/BF03246194. [DOI] [Google Scholar]
- 14.Wang B, Li L, Chen J, Duan C, Song J, Wang R, et al. Synthesis of BiOCl 0.5 I 0.5/TiO2 heterojunctions with enhanced visible-light photocatalytic properties. J. Nanopart. Res. 2018;20:175. doi: 10.1007/s11051-018-4270-y. [DOI] [Google Scholar]
- 15.Calatayud DG, Rodríguez M, Jardiel T. Controlling the morphology of TiO2 nanocrystals with different capping agents. Boletín de la Sociedad Española de Cerámica y Vidrio. 2015;54:159–165. doi: 10.1016/j.bsecv.2015.07.001. [DOI] [Google Scholar]
- 16.Sharma A, Karn R, Pandiyan S. Synthesis of TiO2 nanoparticles by sol–gel method and their characterization. J. Basic Appl. Eng. Res. 2014;1:1–5. [Google Scholar]
- 17.Yuenyongsuwan J, Nithiyakorn N, Sabkird P, O'Edgar EA, Pongprayoon T. Surfactant effect on phase-controlled synthesis and photocatalyst property of TiO2 nanoparticles. Mater. Chem. Phys. 2018;214:330–336. doi: 10.1016/j.matchemphys.2018.04.111. [DOI] [Google Scholar]
- 18.Haider AJ, Al-Anbari RH, Kadhim GR, Salame CT. Exploring potential environmental applications of TiO2 nanoparticles. Energy Procedia. 2017;119:332–345. doi: 10.1016/j.egypro.2017.07.117. [DOI] [Google Scholar]
- 19.Cheng Y, Luo F, Jiang Y, Li F, Wei C. The effect of calcination temperature on the structure and activity of TiO2/SiO2 composite catalysts derived from titanium sulfate and fly ash acid sludge. Colloids Surf. A. 2018;554:81–85. doi: 10.1016/j.colsurfa.2018.06.032. [DOI] [Google Scholar]
- 20.Liang Y, Sun S, Deng T, Ding H, Chen W, Chen Y. The preparation of TiO2 film by the sol–gel method and evaluation of its self-cleaning property. Materials. 2018;11:450. doi: 10.3390/ma11030450. [DOI] [PMC free article] [PubMed] [Google Scholar]
- 21.Singh MK, Mehata MS. Phase-dependent optical and photocatalytic performance of synthesized titanium dioxide (TiO2) nanoparticles. Optik. 2019;193:163011. doi: 10.1016/j.ijleo.2019.163011. [DOI] [Google Scholar]
- 22.Dubey RS. Temperature-dependent phase transformation of TiO2 nanoparticles synthesized by sol–gel method. Mater. Lett. 2018;215:312–317. doi: 10.1016/j.matlet.2017.12.120. [DOI] [Google Scholar]
- 23.Dastan D, Londhe PU, Chaure NB. Characterization of TiO2 nanoparticles prepared using different surfactants by sol–gel method. J. Mater. Sci. Mater. Electron. 2014;25:3473–3479. doi: 10.1007/s10854-014-2041-9. [DOI] [Google Scholar]
- 24.Singh R, Dutta S. Synthesis and characterization of solar photoactive TiO2 nanoparticles with enhanced structural and optical properties. Adv. Powder Technol. 2018;29:211–219. doi: 10.1016/j.apt.2017.11.005. [DOI] [Google Scholar]
- 25.Förster S, Mohr C, Viöl W. Investigations of an atmospheric pressure plasma jet by optical emission spectroscopy. Surface Coat. Technol. 2005;200:827–830. doi: 10.1016/j.surfcoat.2005.02.217. [DOI] [Google Scholar]
- 26.Saadati F, Mahdikia H, Abbaszadeh HA, Abdollahifar MA, Khoramgah MS, Shokri B. Comparison of Direct and Indirect cold atmospheric-pressure plasma methods in the B(16)F(10) melanoma cancer cells treatment. Sci. Rep. 2018;8:7689. doi: 10.1038/s41598-018-25990-9. [DOI] [PMC free article] [PubMed] [Google Scholar]
- 27.Sretenović, G. FTIR spectroscopy of chemical species produced in plasma jet interaction with liquid target. STSM Rep. TD1208, 1–9 (2017).
- 28.Ghezzar MR, Abdelmalek F, Belhadj M, Benderdouche N, Addou A. Enhancement of the bleaching and degradation of textile wastewaters by Gliding arc discharge plasma in the presence of TiO2 catalyst. J. Hazardous Mater. 2009;164:1266–1274. doi: 10.1016/j.jhazmat.2008.09.060. [DOI] [PubMed] [Google Scholar]
- 29.Hu C, Yu JC, Hao Z, Wong PK. Effects of acidity and inorganic ions on the photocatalytic degradation of different azo dyes. Appl. Catalysis B Environ. 2003;46:35–47. doi: 10.1016/S0926-3373(03)00139-5. [DOI] [Google Scholar]
- 30.Ke Z, Huang Q, Zhang H, Yu Z. Reduction and removal of aqueous Cr(VI) by glow discharge plasma at the gas–solution interface. Environ. Sci. Technol. 2011;45:7841–7847. doi: 10.1021/es201680m. [DOI] [PubMed] [Google Scholar]
- 31.Icopini GA, Long DT. Speciation of aqueous chromium by use of solid-phase extractions in the field. Environ. Sci. Technol. 2002;36:2994–2999. doi: 10.1021/es015655u. [DOI] [PubMed] [Google Scholar]
- 32.Cserfalvi T, Mezei P. Direct solution analysis by glow discharge: Electrolyte–cathode discharge spectrometry. J. Anal. At. Spectrom. 1994;9:345–349. doi: 10.1039/ja9940900345. [DOI] [Google Scholar]
- 33.Sharma AK, Desnavi S, Dixit C, Varshney U, Sharma A. Extraction of nickel nanoparticles from electroplating waste and their application in production of bio-diesel from biowaste. Int. J. Chem. Eng. Appl. 2015;6:156. [Google Scholar]


