

Abstract
The microbiome of flowers (anthosphere) is an understudied compartment of the plant microbiome. Within the flower, petals represent a heterogeneous environment for microbes in terms of resources and environmental stress. Yet, little is known of drivers of structure and function of the epiphytic microbial community at the within‐petal scale. We characterized the petal microbiome in two co‐flowering plants that differ in the pattern of ultraviolet (UV) absorption along their petals. Bacterial communities were similar between plant hosts, with only rare phylogenetically distant species contributing to differences. The epiphyte community was highly culturable (75% of families) lending confidence in the spatially explicit isolation and characterization of bacteria. In one host, petals were heterogeneous in UV absorption along their length, and in these, there was a negative relationship between growth rate and position on the petal, as well as lower UV tolerance in strains isolated from the UV‐absorbing base than from UV reflecting tip. A similar pattern was not seen in microbes isolated from a second host whose petals had uniform patterning along their length. Across strains, the variation in carbon usage and chemical tolerance followed common phylogenetic patterns. This work highlights the value of petals for spatially explicit explorations of bacteria of the anthosphere.
Keywords: Anthosphere, community ecology, Helianthus tuberosus, plant microbiome, spatial structure, Verbesina alternifolia
Spatially explicit analysis of flower petal microbial communities reveals evidence of environmental filtering.

1. INTRODUCTION
Plant microbiomes are diverse and can affect growth, development, and ecological interactions (Berg et al., 2016; Müller et al., 2016; Saikkonen et al., 2020). What we know of the structure and function of the plant microbiome, however, has been heavily weighted toward microbes (i.e., bacteria and fungi) associated with leaf (phyllosphere) and root (rhizosphere) environments (Berg et al., 2016; Lindow & Brandl, 2003; Müller et al., 2016). Much less is known about the floral microbiome (anthosphere), which is likely to have unique features because flowers are distinct in form and function (Arunkumar et al., 2019; Junker & Keller, 2015; Massoni et al., 2020; Rebolleda‐Gómez et al., 2019; Shade et al., 2013; Wei & Ashman, 2018). Flowers are structurally complex (consisting of two sterile organs [petals and sepals] and two fertile organs [stamens, pistils], as well as nectaries), and each component can host microbes (Aleklett et al., 2014). Moreover, the function of flowers changes over their lifetime, from initially attracting pollinators to facilitate sexual reproduction to later maturing, protecting, and dispersing progeny in seeds. Because of the diversity of pollinating and seed‐dispersing agents, floral phenotypes are tremendously varied (van der Niet & Johnson, 2012; Valenta et al., 2017) but how this variation translates into a variation in composition or function of the anthosphere microbial community or ultimately in plant function remains an open question.
Dispersal and environmental filtering are thought to play an important role in microbial community assembly (reviewed in Nemergut et al., 2013). Floral and microbial traits can affect each of these processes. For example, the dispersal of microbes to flowers can occur through indiscriminate vectors such as wind and rain but also via sentient pollinating animals, so even if “microbes are everywhere,” microbial traits that affect attraction or attachment to pollinators could play a role in their deposition on flowers (Rebolleda‐Gómez et al., 2019; Russell et al., 2019). Similarly, heterogeneity in the floral environment can select for microbes with attributes that allow their persistence in those different environments. For example, floral organs differ in their production of volatiles, secondary metabolites, or aqueous exudates that can support microbes (Aleklett et al., 2014; Junker & Keller, 2015; Rebolleda‐Gómez & Ashman, 2019; Steven et al., 2018). Direct evidence in support of these processes is accumulating for floral epiphytic and aqueous nectar communities (e.g., Morris et al., 2020; Rebolleda‐Gómez & Ashman, 2019; Zemenick et al., 2018). However, outside the nectar environment (e.g., Dhami et al., 2018; Vannette et al., 2020; de Vega & Herrera, 2012), no study has attempted to link microbial functional traits to floral habitat variation.
Petals are famously heterogeneous floral organs (Koski & Ashman, 2016; Sobel & Streisfeld, 2013). From a microbes' "point of view," the petal could represent variation in both nutrient resources and abiotic stress within a single floral organ. For instance, even within a species, petals vary in color, shape, texture, and orientation, and these aspects can affect the temperature, moisture, and resource environment of the petal (e.g., van der Kooi et al., 2019; Majetic et al., 2007; Whitney et al., 2011). Specifically, petal cell shape can influence wettability (e.g., Whitney et al., 2011), and shape, and pigments can affect radiant light absorption/reflection (e.g., Koski & Ashman, 2015), all of which could lead to differences in the suitability for microbe survival and growth. Within‐petal variation in these features also can be striking, suggesting that a spatially explicit view of the petal microbiome is warranted. For instance, the base of petals can have nectaries that provide rich environments favorable for microbial growth (e.g., sugars in the aqueous environments of nectar) while the tip of the same petal may present a less hospitable environment offering fewer resources but greater exposure to abiotic stresses such as ultraviolet (UV) radiation (Jacobs & Sundin, 2001; Koski & Ashman, 2015). Also, epidermal cell size and shape change over the petal surface further contributing to microenvironmental variation in moisture and temperature (van der Kooi et al., 2019). Thus, a spatially explicit characterization of the microbiome within petals would shed light on this finest scale variation in the floral microbiome. It would also give insight into how the petal environment shapes the pattern of bacterial functional traits (e.g., tolerance to stresses such as pH, salinity or UV irradiation, and ability to grow on different carbon sources) adding substantially to what we know of bacterial function in other plant habitats (Lindow & Brandl, 2003; Remus‐Emsermann et al., 2014).
One approach to evaluating the connection between a floral habitat and microbial community functional traits is through spatially explicit isolation and culturing of microbes. This approach has accelerated our understanding of composition and functional aspects of nectar microbial communities (e.g., Herrera et al., 2010; Rering et al., 2018), but as far as we know the cultivability of the entire epiphytic community, outside nectar (Morris et al., 2020) has not been determined for any floral organ. While there is much debate over the cultivability of microbial communities including those of plants (Burch et al., 2016; Martiny, 2019; Steen et al., 2019; Yashiro et al., 2011), the diversity of the anthosphere is lower than the phyllosphere or rhizosphere (Abdelfattah et al., 2019; Rebolleda‐Gómez & Ashman, 2019; Wei & Ashman, 2018), and thus it may be possible to cultivate a larger fraction of the whole epiphytic community of a single floral organ, specifically, a petal, providing unparalleled insight into its function.
Flowers of plants in the sunflower family (Asteraceae) are an excellent model system to explore a spatially explicit functional signal in the petal microbiome. In this family, flowers are arranged into a composite “head” (i.e., a whole inflorescence) that mimics a single flower (Figure 1a–c). These flower heads comprise many central disc flowers and several peripheral ray flowers. While the disc flowers open sequentially and are short‐lived, the ray flowers open first and live throughout the anthesis of all disc flowers. Thus, ray petals of each head are exposed to microbes for several days to several weeks. Ray petals are the main source of olfactory and visual cues to pollinators, including generating the “bullseye” pattern via variation in reflecting and absorbing ultraviolet light on the top (adaxial) side of the petals (Moyers et al., 2017; Sun & Ganders, 1990). They usually do not produce pollen or ovules, and thus are often sexually sterile.
FIGURE 1.

Experimental design. Plant host species, Helianthus tuberosus (HETU) (a) and Verbesina alternifolia (VEAL) (b), in the field. Both species have flower heads composed of a ring of sterile ray flowers and a central cluster of fertile disc flowers (c). Ray petals were sampled from heads of each species to photograph their ultraviolet absorbance patterns, “printed” on plates for colony isolation, and collect epiphytic bacterial DNA for amplicon sequencing (d). Representative prints of petals on an agar plate to capture the spatial arrangement of bacteria (here from H. tuberosus). These petal‐shaped “microbial maps” were divided into five evenly spaced transects from the base (T1) to the tip (T5)
In this study, we seek to understand the environmental drivers and functional characteristics of the ray petal microbiome of two co‐flowering “sunflowers” (Helianthus tuberosus and Verbesina alternifolia, Asteraceae) (Figure 1a,b). We characterize the ray petal variation in epidermal cell size and shape and overall UV light absorption patterns. We then use both culture‐independent and culture‐dependent methods to describe the ray petal epiphyte bacterial community in a spatially explicit manner (Figure 1d,e). In doing so, we determine how representative the culturable community is of the whole ray petal community. We then characterize the culturable community members with respect to several functional traits related to growth and stress tolerance. We determine whether the ray petal epiphytic bacterial communities are structured by plant host identity or petal‐level spatial variation. Finally, at the within‐petal level, we determine whether there is covariation between bacterial functional traits (UV irradiance tolerance and growth rate) and spatial patterns of UV absorption and whether this differs between the two host plant species.
2. MATERIALS AND METHODS
2.1. Characterizing the petal environment
2.1.1. Plant hosts
Two herbaceous perennial plants in the family Asteraceae: Helianthus tuberosus (HETU) and Verbesina alternifolia (VEAL) were the hosts. Both are native to the Eastern United States of America. Helianthus tuberosus (Figure 1a) reaches 1.5–3 ms tall and is typically found in forest margins and near stream beds, whereas Verbesina alternifolia reaches 1–2.5 m tall and prefers alluvial soils in drainage basins (Figure 1b). Both flower from late summer to mid‐fall and produce flower “heads” consisting of protandrous hermaphrodite disc flowers surrounded by sterile ray flowers with a long single petal (hereafter, “ray petal”) (Figure 1c)
2.1.2. Assessing petal environment
Ray petals from flowers of each plant host (HETU N = 18, VEAL N = 9) were collected from a site near Panther Hollow Pond in Schenley Park, Pittsburgh, PA (40.436983, −79.946868) between September 24 and October 26, 2018. Petals were pressed and dried for photographic analysis of the pattern of UV following Koski and Ashman (2013). For each petal, we recorded length, width, total area, and total UV‐absorbing area using ImageJ. We marked 5 transects (“T1–5”; see Figure 1e) and calculated the proportion of UV absorbing area at the base (area within T1 + T2) and tip (area within T4 + T5) and calculated the average for each host species.
Floral longevity was monitored in the laboratory. Closed flower heads (N = 8–10 per host) were observed and scored as “open” when at least one ray petal was completely unfurled and considered “senesced” when the last ray petal was shed or completely shriveled.
Scanning electron microscopy was used to visualize the petal cell shape at the tip and base of ray petals from both hosts. Petals were collected in the field and immediately imaged at the University of Pittsburgh with a JEOL JSM6390LV SEM at 350X without fixing, dehydrating, or sputter‐coating using an ion beam with a 7kv accelerating voltage. Charging was mitigated by viewing in the low vacuum using 22–28 Pascals.
2.2. Culture‐independent isolation of ray petal epiphytic bacteria
2.2.1. Culture‐independent microbial community collection
Four flower heads of each host species were collected for community sequencing between November 2–11, 2018. A ray petal was aseptically removed from each head and vortexed for 1 min (hereafter, “whole”) in an Eswab Liquid‐based Microbial collection and transport tube (COPAN Diagnostics, Murrieta, CA). The abaxial (top) and adaxial (bottom) sides of a second and third ray petal, respectively, were swabbed individually with Eswab moistened flocked applicators. Eswab tubes were sonicated for 5 min, vortexed for 30 s, then the entire volume of the Eswab tube (1 ml) was transferred to a sterile microcentrifuge tube and stored at −20°C until extraction resulting in 12 (4 whole, 4 top, 4 bottom) samples per host species.
2.2.2. Community sample DNA extraction
DNA extractions were performed on community samples using the Quick‐DNA Fecal/Soil Microbe Miniprep Kit (Zymo Research, Irvine, CA) following manufacturer specifications with a few exceptions. Sample tubes were thawed and centrifuged at 10,000 rpm for 5 min. The top 500 µl of supernatant was removed and discarded, while the entire pellet along with the bottom 200 µl of supernatant was added to the BashingBead Lysis Tube at Step 1, followed by a 650 µl BashingBead Buffer, which was then processed at 27 Hz for 5 min in a tissue lyser. In Step 3, the tubes were centrifuged at 13,300 rpm for 5 min. The last two steps in the protocol were removed, and Step 10 was altered to add 60 µl DNA Elution Buffer to the column matrix, followed by centrifugation at 8000 rpm for 1 min to elute the DNA. Extracted DNA samples were then stored at −20°C.
2.2.3. Sequencing community microbiome
Samples were sequenced at Argonne National Laboratory (Lemont, IL, USA) using primers 799F (5′‐AACMGGATTAGATACCCKG‐3′) and 1115R (5′‐AGGGTTGCGCTCGTTG‐3′) (Chelius & Triplet, 2001; Redford et al., 2011) to target the V5‐V6 region of the 16S rRNA. Amplicons were sequenced on an Illumina MiSeq PE250 (Illumina, San Diego, CA, USA) using customized barcodes as described in Caporaso et al. (2012). We included controls in sequencing runs to ensure the quality of our sequencing. We obtained 377,976 reads for 24 samples, with an average of 15,749 reads per sample.
The DADA2 pipeline (v. 1.10; Callahan et al., 2016) was used to process the reads. Briefly, the ends of reads were trimmed to remove areas of low quality (i.e., the last 100 bp for forward, and 10 bp for reverse reads), and reads with more than 5 expected errors were filtered out. Most reads (360,190; 95%) were kept after quality filtering and trimming, and 330,354 reads (92%) were merged and assigned to unique amplicon sequence variants (ASVs). Finally, much shorter sequences (<260 bp) or much larger (>310 bp) were removed, as well as chimeras to end with 277,159 reads (mean ± SD = 11,548 ± 5594). One sample (VEAL, a swab of the adaxial side) only had 4 reads initially and all were removed after quality control. After quality control taxonomic classification was assigned to reads using a naïve Bayesian classifier method (Wang et al., 2007) and the Silva database (v. 132; Quast et al., 2012; Yilmaz et al., 2014). Finally, sequences that matched chloroplast or mitochondria were removed.
2.3. Culture‐dependent community identification and characterization
2.3.1. Bacterial collection and isolation
Three flower heads from each HETU and VEAL were collected on two dates (October 16 and 26, 2018) and transported in 4 oz sterile cups to the lab. From each flower head, 4 ray petals were removed under aseptic conditions and the abaxial surface of each was “printed” (Figure 1d,e) into agar plates containing 0.1% cycloheximide solution to select for bacteria and one of four media types: Lysogeny Broth (Lennox), potato dextrose, diluted ½‐Tryptic Soy, and diluted ¼‐Tryptic Soy. A fifth ray petal was pressed for photographic UV pattern analysis (see above). Petal prints were cultured in a 30°C incubator for 72 h. Five equidistant transects were established on each petal print from base to tip (Figure 1e). Two discrete colonies (one on each side of the center) were isolated from each of the five transects per petal. Isolates were plated and re‐isolated thrice to obtain monoclonal strains. Prints that became overgrown before discrete colonies could be detected were excluded. A total of 160 isolates were collected (2 hosts × 2 dates × 4 media types × 5 transects × 2 colonies/transect). We scored colonies for 7 morphological characteristics: form, diameter, elevation, margin, surface, opacity, and color. Colony colors from light to dark were coded as 1–4: white (1), buff (2), yellow (3), and orange/red/pink (4). Of the 160 total isolates originally collected, 145 were uncontaminated and grew following glycerol storage (25% at −80°C) and of those, 85 were morphologically unique. Fifteen additional morphologically indistinct isolates were randomly selected to achieve a minimum of 8 isolates at each transect from each host species.
2.3.2. Sequencing of cultured colonies
Cultured isolates were grown from glycerol stocks for 72 h at 30°C on lysogeny broth (Lennox) agar (Sigma‐Aldrich, St. Louis, MO) for sequencing. Colony PCR reactions were performed using 25 µl CloneID PCR Master Mix (Lucigen Corporation, Middleton, WI), 0.25 µl of each primer, and a small portion of a colony. Primers used were IDT Readymade Primers 16S rRNA For (5′‐AGA GTT TGA TCC TGG CTC AG‐3′) and 16S rRNA Rev (5′‐ACG GCT ACC TTG TTA CGA CTT‐3′) (Integrated DNA Technologies, Coralville, IA), each diluted to 50 µM. Conditions for PCR were 98°C for 2 min, 98°C for 30 s, 55°C for 30 s, and 72°C for 1:30 min, 72°C for 10 min. The PCR products were visualized on an agarose gel and enzymatically cleaned through a primer and nucleotide degradation step (37°C for 15 min) and reagent inactivation using ExoSAP‐IT PCR Product Cleanup Reagent (Applied Biosystems, Foster City, CA) (80°C for 15 min). Sequencing was performed by Genewiz, South Plainfield, NJ. Forward‐ and reverse‐primered amplicons were trimmed in the ApE software (v 2. 0. 60; Davis, 2012) and consensus sequences for each isolate were compiled. Contigs were matched to known sequences using BLAST to the NCBI’s nucleotide database and identified a top single sequence match (≥96% identity, in all but 2 isolates). For 10 isolates BLAST yielded two top matches, but in every case, these were the same genus. All were crosschecked with the SILVA rRNA gene database.
2.3.3. UV irradiance tolerance assay
All successfully sequenced isolates (N = 88) were grown from glycerol stocks on lysogeny broth agar plates at 30°C until discrete colonies began to form (48–72 h depending on individual growth rate). From these, an initial bacterial suspension in 1500 µl 1× phosphate‐buffered saline was prepared to an absorbance of 0.10–0.35 at OD600 on a Spectronic 200 spectrophotometer (Thermo Fisher Scientific, Waltham, MA). For several strains, higher absorbance values were determined necessary to produce adequate colony counts. For isolates that would not homogenize, 10 µl 0.05% Tween 80 detergent in NaCl solution was added to the initial suspension. One‐fifth serial dilutions were performed into 800 µl PBS down to 5.10−8.
Square 6 × 6 grid Petri dishes were prepared with lysogeny broth agar and 10uL aliquots of bacteria. Each plate contained a grid of an E. coli (K‐12 strain) control and 5 strains each represented by 5−3 to 5−8 serial dilutions. Six identical plates were prepared for each of the 6 UV exposure durations: 0, 5, 10, 20, 30, and 40 s.
Uncovered plates were exposed to UV‐B (306 nm) in a custom box (31.25 cm × 50 cm × 17.7 cm) with two UV lamps (Model G8T5E, Ushio America, Inc., Cypress, CA) 15 cm from the plate. The UV intensity was maintained at 2076 µW/cm2. Post‐exposure plates were incubated at 30°C and discrete colonies (CFU) were counted at 24, 48, and 72 h, and divided by the dilution factor. For each strain‐exposure treatment surviving CFUs were standardized by the control. These survival ratios were used to calculate UV exposure LD50 measures using the dose.p function in the MASS package (Venables & Ripley, 2002) in R (R Core Team, 2019).
2.3.4. Growth rate assay
Unique strains based on Sanger sequencing (N = 39) were cultured for 24 h in 5 ml lysogeny broth (Lennox) at 30°C, 250 rpm. Seven isolates did not successfully grow and were excluded. A 1 ml overnight culture was transferred to a sterile microcentrifuge tube and centrifuged for 10 min at 13,000 rpm. The supernatant was discarded and the pellet was resuspended in 200 µl 1× PBS. All perimeter wells of a 96‐well plate were filled with sterile water to prevent edge effects from evaporation (Shukla & Rao, 2017). A 10 µl aliquot of each resuspended culture was inoculated into 190 µl liquid M9 media supplemented with either 2% (high) or 0.25% (low) sucrose. Plates were incubated for 2 h at 30°C and 10 µl of each well was transferred into a new 96‐well plate with fresh M9‐sucrose and allowed to grow for another 2 h. This was repeated a total of three times to allow all cells to reach balanced exponential growth. Growth curves were generated by measuring the optical density at 600 nm (OD600) of each well every 30 min for 24 h on a BioTek Gen5 plate reader (BioTek Instruments, Inc., Winooski, VT). The reader was set to incubate at 30°C with continuous orbital shaking.
Positive growth in each condition (high or low concentration of sucrose) was determined as having an OD600 greater than 0.01 after 24 h of growth. Exponential growth rates (maximum slope; m) were determined for the best‐fitted model for each sample with positive growth. Different parametric growth curve models were fitted (logistic, richards, gompertz, and gompertz exponential), and the best model for each growth curve was chosen based on AIC values. In cases where no parametric model provided a good fit (usually samples with little growth), a spline fit was used. For the implementation of this algorithm, we used the grofit package (Kahm et al., 2010) in R (R Core Team, 2019).
2.3.5. Biolog assays
Each sequence‐unique strain (N = 39) was cultured on lysogeny broth agar at 30°C for 48–72 h and inoculated into Biolog IF‐A Inoculating Fluid to a 90%–98% transmittance measured by a Biolog turbidimeter (Biolog, Inc. Hayward, CA). Aliquots (100 µl) of IF‐A suspensions were incubated for 24 h on GEN III MicroPlates and optical density at 550 nm (OD550) of each well was measured on a BioTek Gen5 plate reader (BioTek Instruments, Inc., Winooski, VT). Two of the 39 strains were unable to grow in IF‐A and thus were not scored. Biolog plates come with a negative control well with no carbon sources and a positive control well that reacts with the tetrazolium dye contained in the wells to provide a baseline for comparison. Stain‐specific OD550 was standardized by subtracting the negative control and dividing by the positive control.
2.4. Analyses
To analyze the difference in UV patterns on ray petals between hosts, we pooled UV reflection data from the two base transects (1 + 2) and the two tip transects (4 + 5) and excluded transect 3 given the ambiguity in the UV pattern at that transect in H. tuberosus. We conducted a two‐way ANOVA with host species and location in R (R Core Team, 2019).
To characterize the total epiphyte community composition and compare between species we calculated beta‐diversity using the ASVs, using four indices (Sørensen, Bray‐Curtis, UniFrac, and weighted UniFrac). Sørensen and UniFrac indices incorporate only presence‐absence data, while Bray‐Curtis and weighted UniFrac consider differences in relative abundances. Besides, UniFrac and weighted UniFrac use phylogenetic distance (Lozupone & Knight, 2005). To evaluate differences in these indices across host species and sample type (whole, top, or bottom) we performed a PERMANOVA in R (R Core Team, 2019) using the adonis function in vegan (Oksanen et al., 2019). We used the full model with host species, type, and their interaction as factors. Also, we obtained the rarefaction curves for each sample and compared the overall number of unique ASVs (richness) for each host species with a two‐sided t‐test.
To compare the culturable community to the total ray petal epiphyte community composition, we performed pairwise alignments of all unique ASVs with a relative abundance greater than 0.001% to all of our isolates (trimmed sequences, see below). We then obtained the percentage similarity for the best alignment for each ASV. We used the paiwiseAlignment function in the Biostrings R package (v2.5, Pagès et al., 2019), to perform the pairwise global alignment.
Also, we constructed a phylogeny with the sequences obtained through cultivation and cultivation‐free methods. We aligned the amplicon sequences of all of the unique ASVs with a mean relative abundance of at least 1% and all of the 16S sequences from our isolates using ClustalW (Thompson et al., 1994) with the default values and as implemented in the R package msa (version 1.14; Bodenhofer et al., 2015). The sequences of Pseudomonas caricapapayae and Stenotrophomonas tumulicola were removed due to poor alignment scores. Using trimAI (v1.2; Capella‐Gutiérrez et al., 2009), we trimmed the flanking regions of the alignment to cover only the area of overlap between the amplicons and the fully amplified 16s region. We used this alignment to reconstruct the phylogenetic relationships between isolates and our ASVs. To reconstruct the maximum likelihood phylogeny we used IQ‐tree (Nguyen et al., 2015), using ModelFinder (Kalyaanamoorthy et al., 2017) to select the best substitution model. Here, a transition model with unequal base frequencies (TIM3+F+R4) was chosen because it had the lowest BIC (BIC = 14021.129). For tree reconstruction, we downloaded a Chloroflexi spp. sequence from Genbank as our outgroup.
We used this phylogeny to calculate the UniFrac distance (Lozupone & Knight, 2005) between our cultivated and amplicon samples. Starting with the tip labels in our tree, we assigned 1 to all the isolates and 0 to all of our ASVs to create a presence‐absence vector for our cultivated sample, we repeated this process a second time but with assigning presence to all our ASVs and calculated the UniFrac distance between these two vectors. We compared this distance with a null distribution of UniFrac values in several ways (“random,” “same sample size,” and “relative abundance”). First, by randomly sampling branches of the tree while maintaining the same sample sizes and overall structure (no shared presences or absences). Second, we addressed the concern that UniFrac is affected by uneven sample sizes (O'Dwyer et al., 2012), by obtaining a second null distribution, this time by randomly sampling two samples of equal size (the size of the cultivated sample, N = 56) while still maintaining the structure of no‐taxa overlap. We compared this distribution to one obtained by comparing our cultivated samples to subsamples of the amplicon community, each with N = 56 (same as the cultivated community), either sampled with equal probability for each taxon. Thirdly, we sampled with probabilities determined by the mean relative abundance of each taxon in our amplicon samples. For each group of samples, we sampled 1000 times. In addition, we calculated the expected phylogenetic diversity for our amplicon and cultivated samples given our phylogeny and their sample sizes using the R package Picante (v.1.8.1; Kembel et al., 2010) as described in (O'Dwyer et al., 2012).
To characterize growth and tolerance parameters for the cultural community, we subjected the data from the Biolog plate carbon and chemical assays to NMDS ordinations using the metaMDS function in the R package vegan (Oksanen et al., 2019).
To determine whether bacterial functional traits (growth rate and UV tolerance) varied with UV phenotype at the tip or base of the petal and whether these varied more for HETU than VEAL, we performed linear models in R (R Core Team, 2019). We compared the LD50s of strains collected from transects 1 and 2 to those collected from transects 4 and 5 of both host species. Factors included petal position, host species, and their interaction. We tested whether colony abundance depended on host and transect location using a two‐way ANOVA in R with type III sums of squares (R Core Team, 2019) with host, transect location, and their interaction as fixed factors. We performed a Spearman rank correlation to evaluate the association between colony color and UV tolerance (LD50) using the R package ggpubr (v.0.1.7, Kassambara, 2018). We used a similar linear model to evaluate if the strain growth rate varied among all 5 transect positions, hosts, sucrose concentration (high and low), and two‐way interactions. We obtained the marginal trends with the package emmeans (v.1.4.5, Lenth et al., 2020).
3. RESULTS AND DISCUSSION
3.1. The ray petal environment
Flowers of the two plant hosts are similar in general appearance (head size and longevity; Table A1), but they differ in several important ways. Helianthus tuberosus (HETU) has upward facing ray petals that are twice the length of those of Verbesina alternifolia (VEAL) (Figure 1a,b, Table A1). Moreover, the pattern of UV absorption of the adaxial (top) side of the ray petals differs between the species (Figure 2a,b,e,f). The ray petals of VEAL are predominantly UV reflecting with UV‐absorbing regions mostly along the veins (Figure 2f), leading to a uniform UV absorbance across the petal (UV‐absorbing proportion, tip vs base: 0.18 ± 0.06 vs 0.13 ± 0.06, p = 0.22; Figure A1). In contrast, the base of HETU is significantly more UV absorbing than the tip (UV‐absorbing proportion, base vs tip: 0.90 ± 0.07 vs. 0.10 ± 0.04; p < 0.0001). This results in the heads of HETU displaying a UV absorbing “bullseye” whereas those of VEAL do not. Also, the epidermal cells of HETU ray petals are conical and smaller at the base but flatter and larger at the petal’s tip (Figure 2c,d, see also cell density in Table A1), whereas those in VEAL are uniformly raised, angular, and sized across the petal (Figure 2g,h; Table A1). Taken together, these results suggest stronger spatial heterogeneity in the HETU ray petals than in those of VEAL.
FIGURE 2.
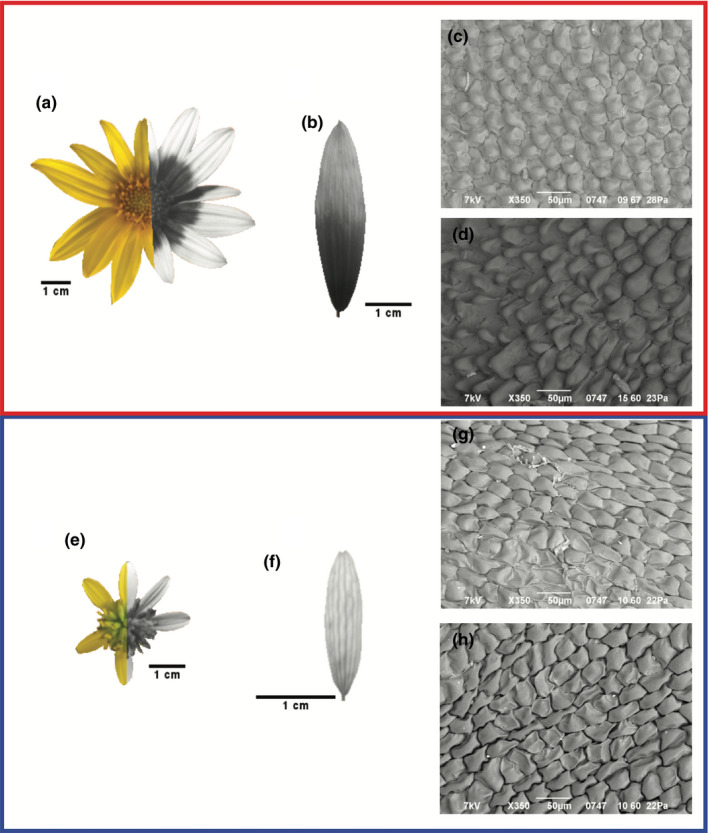
Images of the two host plant species HETU (a–d) and VEAL (e–h). Flower heads photographed under visible (left) and ultraviolet (right) spectrum light (a, e); close‐ups of individual ray petals of each species photographed under ultraviolet light (b, f); SEM petal images (c and d, g and h). The cells of HETU at the tip (T5) (c) are flat compared to the conical cells at the base (T1) (d), whereas the cells at both ends of the petal (T5 (g) and T1 (h)) are uniformly shaped in VEAL
3.2. The total epiphyte bacterial community composition
We characterized the overall epiphytic bacterial community of ray petals of the two hosts, as well as the adaxial (top) and abaxial (bottom) sides of the petal separately (Figure 1d). There were no significant differences between the microbial communities of the two host species (Table A2, Figure A2) nor among the regions (whole, bottom, or top) of the petal (Table A2, Figure A2, Figure 3a) across several different indices of beta diversity (Figure A2). We only observed significant differences between species when considering the phylogenetic distance and presence/absence (PERMANOVA R 2 = 0.114; p = 0.034, Figure 3a), suggesting that differences are due to the presence of rare phylogenetically distant species between the two hosts.
FIGURE 3.

Characterization of ray petal bacterial communities of Helianthus tuberosus (HETU) and Verbesina alternifolia (VEAL) through cultivation‐free methods. (a) PCoA based on UniFrac differences between samples. Each point represents one petal sample (whole, bottom, or top). Percentages indicate the variation explained in each axis. (b) Rarefaction curves (species versus read number) of all the cultivation‐free samples. Most curves flatten around 1500 reads. HETU samples tend to have a higher total number of species than VEAL
Overall, the petals of HETU had more amplicon sequence variants (ASVs) than those of VEAL (HETU ASVs mean = 15.6 vs. VEAL ASVs mean = 8.1; t 19 = 2.58, 95% CI [1.39–13.5], p = 0.02; Figure 3b). This result is consistent with the observation that rare bacterial species present in HETU are responsible for the differences in community composition between the two plant species. All ASVs with a mean relative abundance of at least 0.001% in VEAL samples, were also present in HETU. These ASVs are from genera commonly found in floral microbiomes, such as Pantoea, Erwinia, Pseudomonas, Acinetobacter, and Rosenbergiella (Aleklett et al., 2014; von Arx et al., 2019; Junker et al., 2011; Rebolleda‐Gómez & Ashman, 2019; Steven et al., 2018). However, 73 (58%) ASVs were found only in HETU samples. Of those, most were in clades that had at least one ASV present in both species, but a few Actinomycetales (e.g., genera Geodermatophilus and Curtobacterium), all members of the Paenibacillaceae family, the genera Methylobacterium, and other smaller clades, were only present in HETU samples. Many of these groups were rare (mean relative abundance ≤0.05%; Figure 4a,b).
FIGURE 4.

Taxonomic distribution and comparison of cultivated and amplicon sequencing identified bacteria from ray petals of Helianthus tuberosus (HETU) and Verbesina alternifolia (VEAL). (a) Phylogeny of bacterial isolates and amplicon 16S sequences. The outward most circle is the relative abundance of amplicon sequences broken in five groups of equal size (in grayscale); there is no relative abundance data for the cultivated isolates, and thus, these appear as white. The middle circle marks taxa from the isolate collection (cultivated; yellow) and those from amplicon sequences (orange). Note—For mapping, all amplicon sequences were assumed to be different from all isolates, although as the distance in the tree indicates, many are extremely closely related, and some have a 100% sequence identity match. The inner‐circle shows the host species (HETU, VEAL, or BOTH). (b) Similarity amplicon ASVs and isolate sequences based on relative abundance. The mean similarity is 95% (gray dashed lines), the median 97% (red dashed lines). (c) Deviation from phylogenetic distance expectations given the overall tree. Gray shaded area is the 95% CI of the expected phylogenetic distance, where above this is phylogenetically overdispersed, and below reflect phylogenetically clustered. (d) UniFrac distance between the cultivated and amplicon samples under three different assumptions (random, equal sample size, and relative abundances). See text for explanation. The red vertical line is the observed UniFrac when comparing all of the isolates against all of the ASVs, and the gray box represents 95% CI of the null expectation
Overall, ray petal communities are similar between hosts. Differences between hosts could largely be attributed to the presence of rare taxa, while the most abundant taxa were shared between hosts. Unlike our results, previous studies in flower microbiomes have found significant differences in the bacterial community composition across host species (von Arx et al., 2019; Gaube et al., 2020; Junker et al., 2011), even when the hosts were in the same genus (Wei & Ashman, 2018). These studies, however, compared either nectar communities (von Arx et al., 2019) or entire flowers (Gaube et al., 2020; Junker et al., 2011; Wei & Ashman, 2018), or allopatric samples. In most of these studies, there was also a large variation within species, leading to some overlap in community composition between hosts (von Arx et al., 2019; Gaube et al., 2020; Wei & Ashman, 2018). The differences between our findings for single petal communities and the prevailing information on the anthosphere are likely due to a combined effect of reduced variation in host habitat (petal vs. whole flowers), shared habitat, and restricted physical distance between plants (sympatry versus allopatry) along with high variation among petals even when sampling multiple petals per plant (12 petals from 4 plants per species) (Figure 3).
Moreover, we did not observe differences between the top and bottom surfaces of the petal, except for presence‐absence data (see “Sørensen”; Table A2) where the top surface of the petal had higher ASV richness than the bottom (Figure 4, Figure A3). Although one must note that there was a wide variation among petals (Figure A3), and all the ASVs present on the bottom surface were also present in at least one of the top samples. Our results agree with data from leaves where, despite being more protected against environmental stresses, there tends to be higher diversity in the top surface (e.g., Huws et al., 2014). More studies of floral organs are needed to determine the generality of these findings between leaves and petals.
3.3. The cultivable bacteria and their relation to the whole epiphyte bacterial community
We used petal prints to obtain spatially explicit bacterial isolates (Figure 1d,e) and get a rough estimate of abundance. There was no significant difference between the mean total number of colonies retrieved from petals of the two hosts (HETU: 34 ± 5.5, VEAL: 25 ± 3.6; p = 0.1), nor among transect positions or their interaction (both p > 0.4).
We cultured 39 uniquely identifiable isolates across both hosts, and these represent 20 genera and 11 families (Figure 4a; Table S3 at https://doi.org/10.5061/dryad.2v6wwpzjt). In HETU, there were 23 total strains encompassing 14 genera and 9 families. In VEAL, there were 26 strains from 14 genera and 8 families. Unlike the amplicon sequencing samples, we cultured some host‐specific strains (13 from HETU only and 16 from VEAL only). More than 70% of the strains identified through culturing had previously been collected from plant hosts (N = 28 of 39; Table S3 at https://doi.org/10.5061/dryad.2v6wwpzjt). For example, Rosenbergiella species were common in our cultured floral community (20 of 89 sequenced isolates) and were isolated from both hosts and all transects along the petal. Of those, three Rosenbergiella species (R. epipactidis, R. collisarenosi, and R. australiborealis) had previously been isolated from flowers, specifically floral nectar (Table S3 at https://doi.org/10.5061/dryad.2v6wwpzjt).
Of the 20 genera in the cultured set of bacteria, 16 were present in the sequencing pool (Figure A3A). In contrast, Exiguobacterium, Paracoccus, Rhizobium, and Sphingomonas were found exclusively in our isolates (given the ambiguity in the classification, we considered Pantoea, Kluyvera, Pseudescherichia, and Lelliottia as the same genus; see Figure 4a). All of these isolates, except for the Sphingomonas had a close relative (within the same family) present in our sequencing samples (Figure 4a).
In contrast, of the 46 genera that were assignable in the amplicon sequencing data, only 16 were present among our cultured isolates (Figure A3A). Of these, some had close relatives among the isolates (e.g., Falsochrobactrum, Kosakonia, and Xanthomonas), but others were phylogenetically distant (Figure 4a). The families we could recover comprised ~75% of all amplicon sequences (Figure A3B), and most of the unique families in our amplicon data set were either rare overall or only present in the HETU petals (Figure 4a, Figure A3B). The median percentage similarity between amplicon sequences and 16S sequence of our isolates was 97.66%, somewhere between the genus and species level cut‐offs. This cut‐off is on the higher end of values estimated for other environments (Martiny, 2019; Steen et al., 2019). In addition, taxa below this threshold were on average less abundant in our samples (relative abundance difference in low vs. high similarity = 0.7%, 95%CI [0.03%−1.3%], t 84.2 = 2.08, p = 0.04; Figure 4b).
To evaluate how phylogenetically representative the cultured isolates and sequenced community were to the total (combined) data set or to each other we performed two tests. First, we calculated the phylogenetic distance of these subsets to the whole tree (combined ASVs and isolates). Here, we found the amplicon sample was representative of the whole tree (neither overdispersed nor significantly clustered), whereas the cultivated strains were slightly clustered (z = −2.43; Figure 4c), as expected given the lower number of families isolated. Second, we calculated the UniFrac (non‐weighted) distance between the cultivated and amplicon samples under three assumptions: (1) Random sampling, assuming all the strains were different to avoid overestimating similarity between the amplicon sequences and isolates. Here we found that the observed distance was larger than expected by the null model (p = 0.026); (2) Sampling with simulated equal sample size because UniFrac distances are overestimated when sample sizes differ (O'Dwyer et al., 2012). By re‐sampling 56 taxa from our amplicon data set (N = 126) and comparing it to our isolate sample (N = 56), we obtained a distribution closer to the null expectation (Figure 4d). (3) Re‐sampling accounting of differences in the relative abundance of each taxon. Under these conditions, the observed distribution of UniFrac difference between the amplicon and cultured sets falls entirely within the 95%CI of our null distribution (Figure 4d). Given the differences in sequencing methods and lengths of DNA sequences, in all of these comparisons, we took a conservative approach and assumed that none of the strains isolated on plates was present in our amplicon data.
Taken together, these data suggest that the cultivated isolates are slightly taxonomically clustered, but are within the range of what would be expected by simply subsampling the larger set of ASVs. However, even when sampling accounting for relative abundance, the larger UniFrac values suggest slight biases in the cultured set. Indeed, the cultured set included more Enterobacteriaceae and Pseudomonadaceae and less Actinomycetales than the culture‐independent set, likely a function of the culturing conditions we used (Figure 4a, Figure A3B). Under general, nutrient‐rich growth conditions, fast‐growing Enterobacteriaceae and Pseudomonadaceae are favored, while slower growing stress‐tolerators such as some of the Actinomycetales are unable to compete. This reflects a common drawback of using only culture‐dependent methods, that is, biases toward easily cultured families (Aleklett et al., 2014). Finally, it remains unclear which proportion of the flower microbiome is actively growing in the flower, and many taxa could be in a dormant state, affecting the proportion of taxa that can be cultivated.
Recently, it has been proposed that the culturability problem has multiple dimensions: (1) the number of cells that can be cultivated, (2) the number of taxa that can be cultivated, and (3) the number of cells or taxa that grow on standard agar medium (Martiny, 2019). In this study, we evaluated the number of taxa that can grow on standard agar media and by assessing the relative abundance of these taxa began to address how representative this sample was in terms of the number of cells. However, this question requires further investigation into the percentage of dormancy across different taxa, the amount of intra‐taxa variation, and the use of alternative media to culture an even more representative community. Independent of cultivation biases, the cultivated sample missed rare taxa, some of which could have important functional contributions in different environmental conditions (Shade et al., 2014). For all of these reasons, heavy sampling efforts across multiple different media/growth conditions must accurately represent the whole epiphyte community. This type of study lends itself well to an experimental biology curriculum environment, which would allow robust sampling, emphasize the whole spectrum of media formulations, and thus, could continuously build upon the current data set over time.
Nevertheless, the representation of the strains cultivated here is better, or on par with, that from other floral (Morris et al., 2020) and leaf (Yashiro et al., 2011) environments, indicating the high value of this habitat for experimental functional analyses of microbial communities. Future studies can use these isolates to evaluate their ecological role in the petal community.
3.4. Functional characterization of bacteria of the ray petal community
We hypothesized that bacteria able to inhabit the ray petal environment could rapidly consume different carbon sources, tolerate general stresses, as well as specifically tolerate high UV exposure.
Results of the carbon use assay indicate that most of the cultured strains differentiated along a sugar‐organic acid axis, corroborating known familial proclivities (Estrela et al., 2020), with most Enterobacteriaceae specializing on sugars and most Pseudomonadaceae specializing on organic acids (Figure A4A). Similarly, members of the Enterobacteriaceae had some of the highest growth in sucrose, followed by Pseudomonadaceae and Bacillaceae (Figure 5a,b). However, in several cases, faster growth rates were observed at lower concentrations of sucrose (2% vs. 0.25%; Figure 5c,d), perhaps indicative of the excretion of toxic byproducts at high sugar concentrations.
FIGURE 5.

Bacterial strain growth curves in high (2%) and low (0.25%) sucrose concentrations (a and b). Growth varies with position along the petal in HETU but not VEAL (c and e). c–d show the relationship between growth and transect position in the ray petal. (e) The marginal means of the slope in the different host species and across concentrations of sucrose
Interestingly, in our petal community members of the Pseudomonadaceae and Enterobacteriaceae are common (Figure A3), and recent studies have shown that these same two families tend to dominate communities assembled in minimal media with carbon as the main limiting resource (Goldford et al., 2018). In these artificial communities, as in our functional tests, Enterobacteriaceae tend to grow better on sugars, and Pseudomonadaceae in organic acids (Estrela et al., 2020). An extreme case of this potential specialization was the Rosenbergiella species, which are known nectar inhabitants. These species grew very well in low concentrations of sugar, but two of the three Rosenbergiella species could use fewer than half of the potential carbon sources in the Biolog array, hinting at a possible specialization to sugar‐dominated environments. Taken together, these results point to the ability to obtain carbon as one of the main determinants of colonization in petals as it is in leaves (Leveau & Lindow, 2001; Wilson & Lindow, 1994). Moreover, the ability to rapidly grow in relatively low concentrations of sucrose (Figure 5b) or on different carbon sources (Figure A4A) is probably contributing to the diversity and relative abundances of the ray petal community.
Concerning general stress tolerance, most petal bacterial strains were better able to tolerate a low pH environment than a 4% saline environment. The Biolog panel of environmental chemicals revealed that all strains, except for Paracoccus marcusii and Rhodococcus cercidiphylli, tolerated the pH 6 assay (Figure A5). Fewer strains tolerated the 4% saline assay (28/37), with most strains exhibiting lower tolerance to the saline environment than the acidic environment, with a notable exception of P. marcusii, which was unable to tolerate pH 6 at all but performed better than all other strains under 4% saline stress (Figure A5). Most Bacillaceae, Microbacteriaceae, and Pseudomonadaceae could tolerate saline stress, each with one exception (Bacillus megaterium, Microbacterium testaceum, and Pseudomonas viridiflava, Figure A5).
The functional analyses of tolerance to UV light exposure demonstrated that bacterial strains collected from ray petals exhibited a 15‐fold range of UV tolerances. The most UV‐sensitive strain was Bacillus aryabhattai, isolated from VEAL transect 5, which had an LD50 of 2.9 ± 0.01 seconds. The most UV tolerant strain was Curtobacterium oceanosedimentum, also isolated from VEAL but from transect 1, which had an LD50 of 47.8 ± 0.04 seconds. Across all strains and locations, the mean LD50 of isolates from HETU, however, was similar to those from VEAL (LD50: 14.6 ± 9.01s, N = 47 vs 15.0 ± 10.1s, N = 41). Interestingly, the average LD50 of isolates in both hosts was nearly twice that of the E. coli control (6.7 ± 0.52 s). In fact, of the 88 strains tested, 81% had higher LD50s than the E. coli control.
Taken together, these results reveal potentially important axes of stress tolerance for bacteria inhabiting ray petals. For instance, the tolerance of acidity might be an important trait for survival in the flower at two spatial scales. At a large biogeographic scale, soil pH shapes the pool of soil microbes that can colonize the flower (Lauber et al., 2009; Zarraonaindia et al., 2015). Soils in Pittsburgh are rich in clay and in general, have a low pH (between 4 and 6; USDA, 1981), which could explain some of our results. However, the relationship between soil pH and flower community composition requires further investigation. At a much smaller scale (within the petal), the fermentation of sugars in bacteria often leads to the production of organic acids, potentially affecting growth.
Similarly, while petals might not be particularly “saline,” petal surfaces tend to be very water repellent and there is substantial evidence of correlated responses for different stresses in bacteria (Nagar et al., 2016; Ramos et al., 2001). In particular, in some taxa, it has been shown that increased salinity tolerance is also associated with increased tolerance to dry conditions (e.g., Beblo‐Vranesevic et al., 2017), and high temperatures (e.g., Gunasekera et al., 2008), which are likely important stressors on the petal surface (van der Kooi et al., 2019; Majetic et al., 2007; Whitney et al., 2011). Future studies should evaluate the resistance of petal microbes to desiccation, as well as their ability to grow in more humid microenvironmental patches within the petal, as these are structuring microhabitats within the leaf (e.g., along veins, crevices between epidermal cells, near the base of trichomes, in the proximity of stomates; Leveau & Lindow, 2001).
In addition to desiccation, one of the most prominent stresses of all sun‐exposed surfaces is UV radiation. This stressor is important in shaping the bacterial communities of peanut leaves (Sundin & Jacobs, 1999). In this phyllosphere, bacterial pigmentation was an important factor contributing to survival (Jacobs et al., 2005; Sundin & Jacobs, 1999). We did not observe a relationship between bacterial isolate color and LD50 (Table S3 at https://doi.org/10.5061/dryad.2v6wwpzjt; r s = 0.14, p = 0.19), however, our petal communities were largely composed of highly pigmented strains (84%; Table S3 at https://doi.org/10.5061/dryad.2v6wwpzjt). Overall strains from ray petals were on average twice as tolerant of UV radiation than E. coli control suggesting strong selection for UV tolerance, and this may be an underestimate because some taxa present on the petal (i.e., in the ASV pool, Figure 4a), were absent in cultivated communities and thus not tested here, though they are known to be highly tolerant to UV radiation (e.g., Geodermatophilus; Gtari et al., 2012; Montero‐Calasanz et al., 2014). However, one should note also that even despite their UV tolerances, petal bacteria could not withstand much more than a minute of intense UV exposure, suggesting that UV is a successful way to sterilize petal surfaces for in vivo experiments, much like the use of UV‐C to reduce fungal pathogens (Begum et al., 2009).
3.5. Within‐petal spatial variation in bacterial functional traits
Given that HETU and VEAL vary in their degree of within‐petal spatial heterogeneity (Figure 2), we hypothesized that there would be a stronger effect of spatial position on the bacterial functional traits from those isolated from HETU, than those from the more spatially homogeneous VEAL. Consistent with this hypothesis, we observed a significant overall effect of petal transect on bacterial growth rate (Figure 5c,d, p = 0.02), which was driven by the declining growth rate toward the petal tip for bacteria isolated from HETU (slope = −0.00014, SE = 0.00006; Figure 5e). The effects of host species (p = 0.09), sugar concentration (p = 0.94) and their interaction (p = 0.09) were not significant.
One possible cause of this pattern in HETU is that ray petals are angled upward with bigger basal cells (Figure 1a), so taxa that reside at the base may more often encounter nectar, water, and other nutrients. In contrast, the downward angle and flatter, more even‐sized cells of ray petals in VEAL (Figure 1b) may neutralize any within‐petal resource gradient. Future work is needed to address the intriguing possibility that petal angle and epidermal characteristics select for microbial functions, but if found would join evidence in the leaves that microbial growth is affected by areas of high carbon and moisture (e.g., centered around stomata, Leveau & Lindow, 2001).
When considering UV tolerance along the length of the petal (Figure 6), isolates from UV‐absorbing regions (transects 1 and 2) of HETU (Figure A1) had an average LD50 of 12.5 ± 6.1s (N = 18), whereas isolates from UV reflecting regions (transects 4 and 5) had an average LD50 of 19.3 ± 11.0s (N = 20). In contrast isolates from VEAL transects 1 and 2 (Figure A1) had an average LD50 of 17.3 ± 12.6s (N = 15), while isolates from transects 4 and 5 had an average LD50 of 9.6 ± 5.1s (N = 18). The interaction between transect and host was highly significant (p = 0.0018), but neither main effects were (p > 0.07).
FIGURE 6.

Bacterial UV tolerance by transect. Strains were exposed to various durations of UV light to determine UV LD50. LD50s were natural log‐transformed and pooled by transect location, petal base (T1 and T2), or petal tip (T4 and T5). Strains are colored by the original host flower that each isolate was collected from, HETU or VEAL
These findings agree with the expectation that the UV tolerance of bacteria collected from the UV‐absorbing base of HETU would be lower than those collected from the UV‐reflecting tip, but contrary to our prediction in VEAL where a decrease in UV tolerance was found from the base and tip despite the uniform UV‐absorbing pattern. These results suggest that UV absorbing patterns influence the spatial organization of the petal microbiome, but not alone, perhaps in conjunction with resource availability and other stresses described above. In sum, along with the study of bacterial function and location within the petal, studies that elucidate the spatial availability of carbon sources and specifically measure the microbial‐level heterogeneity in stressors will be needed to fully inform on the drivers of bacterial community patterns. Such work would complement that on the leaf (Jacobs et al., 2005) and significantly inform the organization of the plant phyllosphere.
4. CONCLUSIONS
Similar to leaves, we conclude that the petal environment is heterogeneous and requires a spatially explicit study. The culturable community was slightly more clustered than that recovered via amplicon sequencing but was within the range of what would be expected by sampling in a spatially explicit fashion. Important bacterial functional traits, such as growth and UV tolerance, varied along the ray petal length, illustrating for the first time that the function of the microbiome varies at the within‐petal level. Some of these patterns aligned with our predictions between hosts based on petal traits (i.e., UV absorption/reflection) but others did not, illustrating the likely multivariate phenotype differences between the hosts. This work paves the way for manipulating realistic experimental microbiomes in a laboratory under controlled culturing conditions and in vivo where natural variation in the petal environment can be leveraged—both crucial for furthering our understanding of the plant microbiome function, and especially the anthosphere. Finally, this study demonstrates that the ray petals of Asteraceae species present a tractable system for understanding plant microbiomes and, in particular, can be extended to explore questions about how the variety of ray petal colors, patterns, and morphologies affect the dynamics of the petal microbial communities.
CONFLICT OF INTEREST
None declared.
AUTHOR CONTRIBUTION
Rebecca A. Hayes: Data curation (equal); Formal analysis (supporting); Investigation (lead); Visualization (equal); Writing‐original draft (equal); Writing‐review & editing (equal). Maria Rebolleda‐Gómez: Conceptualization (equal); Data curation (equal); Formal analysis (lead); Investigation (supporting); Methodology (equal); Supervision (supporting); Validation (equal); Visualization (equal); Writing‐original draft (equal); Writing‐review & editing (equal). Kristen Butela: Conceptualization (supporting); Methodology (equal); Supervision (supporting); Validation (supporting); Writing‐review & editing (supporting). Leah F. Cabo: Data curation (supporting); Formal analysis (supporting); Validation (supporting); Writing‐review & editing (supporting). Nevin Cullen: Data curation (supporting); Formal analysis (supporting); Software (supporting); Writing‐review & editing (supporting). Nancy Kaufmann: Conceptualization (supporting); Funding acquisition (equal); Investigation (supporting); Methodology (equal); Resources (equal); Supervision (supporting); Validation (supporting); Writing‐review & editing (supporting). Steffani O'Neill: Data curation (supporting); Investigation (supporting); Validation (supporting); Writing‐review & editing (supporting). Tia‐Lynn Ashman: Conceptualization (equal); Funding acquisition (equal); Methodology (equal); Project administration (lead); Resources (equal); Supervision (lead); Validation (supporting); Writing‐original draft (equal); Writing‐review & editing (equal).
ETHICS STATEMENT
None required.
ACKNOWLEDGMENTS
We thank T. Harper for SEM microscopy support, T. Gasmire, M. G. Bowman, and the University of Pittsburgh Dietrich School Machine Shop staff for the construction of UV exposure box, and E. O’Neill, K. Payne, K. Wagner, and K. Wozniak for logistical support. This work was supported by Howard Hughes Medical Institute, the National Science Foundation DEB1452386, and the University of Pittsburgh Dietrich School of Arts and Sciences.
APPENDIX A.
TABLE A1.
Floral characteristics (mean ± SD) of the two flowering plant hosts Helianthus tuberosus (HETU) and Verbesina alternifolia (VEAL). Sample sizes (N) for each species
| Helianthus tuberosus | Verbesina alternifolia | N | |
|---|---|---|---|
| Longevity of entire flower head (days) | 8.75 ± 2.05 | 8.9 ± 4.4 | 8, 10 |
| Number of disc flowers | 31.2 ± 10.5 | 32.4 ± 7.83 | 8, 10 |
| Number of ray flowers | 12.3 ± 1.16 | 5.5 ± 0.85 | 8, 10 |
| Orientation of ray petal | Upward | Downward | 5, 5 |
| Ray petal area (mm2) | 299.2 ± 59.78 | 68.41 ± 27.23 | 18, 9 |
| Ray petal length (mm) | 39.97 ± 3.62 | 18.23 ± 4.99 | 18, 9 |
| Ray petal width (mm) | 10.14 ± 1.29 | 4.93 ± 1.22 | 18, 9 |
| Epidermal cell density at petal base (cells/50 µm2) | 1.9 ± 0.30 | 2.6 ± 0.44 | 5, 5 |
| Epidermal cell density at petal tip (cells/50 µm2) | 2.5 ± 0.38 | 3.0 ± 0.45 | 5, 5 |
TABLE A2.
PERMANOVA results evaluating the contribution of host species and sampling area of the ray petal (whole flower, bottom, and top) to community assembly using four different beta‐diversity indices.
| Sorensen | Bray‐Curtis | UniFrac | Weighted uniFrac | |||||
|---|---|---|---|---|---|---|---|---|
| R 2 | p‐Value | R 2 | p‐Value | R 2 | p‐Value | R 2 | p‐Value | |
| Host species | 0.07 | 0.06 | 0.05 | 0.55 | 0.11 | 0.03 | 0.03 | 0.65 |
| Sampling | 0.13 | 0.04 | 0.08 | 0.89 | 0.11 | 0.24 | 0.07 | 0.70 |
| Host species:Sampling | 0.11 | 0.2 | 0.09 | 0.81 | 0.12 | 0.2 | 0.05 | 0.95 |
FIGURE A1.

Ray petal UV absorbing proportion significantly differs between petal tip (transect 1&2) and base (transect 4&5) in HETU (p < 0.0001), while in VEAL the petal has a uniform UV absorbing proportion along its length (p = 0.22)
FIGURE A2.

PCoAs based on four different beta diversity indices (Sorensen, Bray‐Curtis, UniFrac, and weighted UniFrac). Each point represents one sample (whole, bottom, or top of petal), and the different shapes represent the different locations (entire, top, or bottom). Percentages indicate the variation explained in each axis
FIGURE A3.

Differences in bacterial species composition between cultivated and amplicon datasets. A. Venn diagram of genera with more than 0.001% relative abundance. B. Relative abundance of the different families
FIGURE A4.

Biolog Plate NMDS. Biolog plates test strain response to 71 carbon sources (A) and 23 chemicals (B). Each strain is colored by the family to which it belongs. Arrows and labels are shown only for significant responses
FIGURE A5.

Strain growth response to common biological stressors. Each strain (N = 37) was inoculated into Biolog plates with an array of assays including acidic pH 6 (A) and 4% NaCl (B) conditions that were monitored through a tetrazolium dye reaction. Strains able to grow successfully under those conditions showed a stronger positive response, while those unable to grow showed a negative response. The color of the bars reflects the bacterial family
Rebecca A. Hayes and Maria Rebolleda‐Gómez are co‐first authors.
Contributor Information
Maria Rebolleda‐Gómez, Email: maria.rebolleda-gomez@yale.edu.
Tia‐Lynn Ashman, Email: maria.rebolleda-gomez@yale.edu, Email: tia1@pitt.edu.
DATA AVAILABILITY STATEMENT
Sequence data are available in GenBank https://www.ncbi.nlm.nih.gov/nuccore, under accession numbers MT544502–MT544586 and under BioProject PRJNA644391: https://www.ncbi.nlm.nih.gov/bioproject/PRJNA644391. Other data are available in the Dryad repository at https://doi.org/10.5061/dryad.2v6wwpzjt (Table S3. Summary of bacteria isolated from ray petals, traits scored and information from the literature on the location of previous isolation; Table S4. Bacterial isolate morphological traits. Isolates were grown on lysogeny broth agar media for 72 h at 30°C, and colonies were scored on eight morphological traits. Colony images were taken using the Leica EZ4W dissecting microscope). Code for phylogenetic analyses, growth curves, and biology analyses can be found on GitHub: https://github.com/mrebolleda/Paper_MicrobialCommunitySpacePetal.
REFERENCES
- Abdelfattah, A. , Sanzani, S. M. , Wisniewski, M. , Berg, G. , Cacciola, S. O. , & Schena, L. (2019). Revealing cues for fungal interplay in the plant‐air interface in vineyards. Frontiers in Plant Science, 10, 922. [DOI] [PMC free article] [PubMed] [Google Scholar]
- Aleklett, K. , Hart, M. , & Shade, A. (2014). The microbial ecology of flowers: An emerging frontier in phyllosphere research. Botany‐Botanique, 92(4), 253–266. [Google Scholar]
- Arunkumar, N. , Rakesh, S. , Rajaram, K. , Kumar, N. R. , & Durairajan, S. S. K. (2019). Anthosphere microbiome and their associated interactions at the aromatic interface In Varma A., Tripathi S., & Prasad R. (Eds.), Plant microbe interface (pp. 309–324). Springer. [Google Scholar]
- Beblo‐Vranesevic, K. , Galinski, E. A. , Rachel, R. , Huber, H. , & Rettberg, P. (2017). Influence of osmotic stress on desiccation and irradiation tolerance of (hyper)‐thermophilic microorganisms. Archives of Microbiology, 199(1), 17–28. [DOI] [PubMed] [Google Scholar]
- Begum, M. , Hocking, A. D. , & Miskelly, D. (2009). Inactivation of food spoilage fungi by ultra violet (UVC) irradiation. International Journal of Food Microbiology, 129(1), 74–77. [DOI] [PubMed] [Google Scholar]
- Berg, G. , Rybakova, D. , Grube, M. , & Köberl, M. (2016). The plant microbiome explored: implications for experimental botany. Journal of Experimental Botany, 67(4), 995–1002. [DOI] [PMC free article] [PubMed] [Google Scholar]
- Bodenhofer, U. , Bonatesta, E. , Horejš‐Kainrath, C. , & Hochreiter, S. (2015). msa: An R package for multiple sequence alignment. Bioinformatics, 31(24), 3997–3999. [DOI] [PubMed] [Google Scholar]
- Burch, A. Y. , Do, P. T. , Sbodio, A. , Suslow, T. V. , & Lindow, S. E. (2016). High‐level culturability of epiphytic bacteria and frequency of biosurfactant producers on leaves. Applied and Environmental Microbiology, 82(19), 5997–6009. [DOI] [PMC free article] [PubMed] [Google Scholar]
- Callahan, B. J. , McMurdie, P. J. , Rosen, M. J. , Han, A. W. , Johnson, A. J. A. , & Holmes, S. P. (2016). DADA2: high‐resolution sample inference from Illumina amplicon data. Nature Methods, 13(7), 581–587. [DOI] [PMC free article] [PubMed] [Google Scholar]
- Capella‐Gutiérrez, S. , Silla‐Martínez, J. M. , & Gabaldón, T. (2009). trimAl: a tool for automated alignment trimming in large‐scale phylogenetic analyses. Bioinformatics, 25(15), 1972–1973. [DOI] [PMC free article] [PubMed] [Google Scholar]
- Caporaso, J. G. , Lauber, C. L. , Walters, W. A. , Berg‐Lyons, D. , Huntley, J. , Fierer, N. , Owens, S. M. , Betley, J. , Fraser, L. , Bauer, M. , Gormley, N. , Gilbert, J. A. , Smith, G. , & Knight, R. (2012). Ultra‐high‐throughput microbial community analysis on the Illumina HiSeq and MiSeq platforms. The ISME Journal, 6(8), 1621–1624. [DOI] [PMC free article] [PubMed] [Google Scholar]
- Chelius, M. K. , & Triplett, E. W. (2001). The Diversity of Archaea and Bacteria in Association with the Roots of Zea mays L. Microbial ecology, 41(3), 252–263. [DOI] [PubMed] [Google Scholar]
- Davis, M. W. (2012). ApE: A plasmid editor, v2.0.60. [Google Scholar]
- de Vega, C. , & Herrera, C. M. (2012). Relationships among nectar‐dwelling yeasts, flowers and ants: patterns and incidence on nectar traits. Oikos, 121(11), 1878–1888. [Google Scholar]
- Dhami, M. K. , Hartwig, T. , Letten, A. D. , Banf, M. , & Fukami, T. (2018). Genomic diversity of a nectar yeast clusters into metabolically, but not geographically, distinct lineages. Molecular Ecology, 27(8), 2067–2076. [DOI] [PubMed] [Google Scholar]
- Estrela, S. , Sanchez‐Gorostiaga, A. , Vila, J.C. , Sanchez, A. (2020). Nutrient dominance governs the assembly of microbial communities in mixed nutrient environments. bioRxiv. 10.1101/2020.08.06.239897 [DOI] [PMC free article] [PubMed] [Google Scholar]
- Gaube, P. , Junker, R. R. , & Keller, A. (2020). Changes amid constancy: Flower and leaf microbiomes along land use gradients and between bioregions. Biorxiv, 10.1101/2020.03.31.017996 [DOI] [Google Scholar]
- Goldford, J. E. , Lu, N. , Bajić, D. , Estrela, S. , Tikhonov, M. , Sanchez‐Gorostiaga, A. , Segrè, D. , Mehta, P. , & Sanchez, A. (2018). Emergent simplicity in microbial community assembly. Science, 361(6401), 469–474. [DOI] [PMC free article] [PubMed] [Google Scholar]
- Gtari, M. , Essoussi, I. , Maaoui, R. , Sghaier, H. , Boujmil, R. , Gury, J. , Pujic, P. , Brusetti, L. , Chouaia, B. , Crotti, E. , Daffonchio, D. , Boudabous, A. , & Normand, P. (2012). Contrasted resistance of stone‐dwelling Geodermatophilaceae species to stresses known to give rise to reactive oxygen species. FEMS Microbiology Ecology, 80(3), 566–577. [DOI] [PubMed] [Google Scholar]
- Gunasekera, T. S. , Csonka, L. N. , & Paliy, O. (2008). Genome‐wide transcriptional responses of Escherichia coli K‐12 to continuous osmotic and heat stresses. Journal of Bacteriology, 190(10), 3712–3720. [DOI] [PMC free article] [PubMed] [Google Scholar]
- Herrera, C. M. , Canto, A. , Pozo, M. I. , & Bazaga, P. (2010). Inhospitable sweetness: Nectar filtering of pollinator‐borne inocula leads to impoverished, phylogenetically clustered yeast communities. Proceedings of the Royal Society B: Biological Sciences, 277(1682), 747–754. [DOI] [PMC free article] [PubMed] [Google Scholar]
- Huws, S. A. , Mayorga, O. L. , Theodorou, M. K. , Kim, E. J. , Cookson, A. , Newbold, J. , & Kingston‐Smith, A. H. (2014). Differential colonization of plant parts by the rumen microbiota is likely to be due to different forage chemistries. Journal of Microbial and Biochemical Technology, 6(2), 80–86. [Google Scholar]
- Jacobs, J. L. , Carroll, T. L. , & Sundin, G. W. (2005). The role of pigmentation, ultraviolet radiation tolerance, and leaf colonization strategies in the epiphytic survival of phyllosphere bacteria. Microbial Ecology, 49(1), 104–113. [DOI] [PubMed] [Google Scholar]
- Jacobs, J. L. , & Sundin, G. W. (2001). Effect of solar UV‐B radiation on a phyllosphere bacterial community. Applied and Environmental Microbiology, 67(12), 5488–5496. [DOI] [PMC free article] [PubMed] [Google Scholar]
- Junker, R. R. , & Keller, A. (2015). Microhabitat heterogeneity across leaves and flower organs promotes bacterial diversity. FEMS Microbiology Ecology, 91(9), fiv097. [DOI] [PubMed] [Google Scholar]
- Junker, R. R. , Loewel, C. , Gross, R. , Dötterl, S. , Keller, A. , & Blüthgen, N. (2011). Composition of epiphytic bacterial communities differs on petals and leaves. Plant Biology, 13(6), 918–924. [DOI] [PubMed] [Google Scholar]
- Kahm, M. , Hasenbrink, G. , Lichtenberg‐Fraté, H. , Ludwig, J. , & Kschischo, M. (2010). Grofit: Fitting biological growth curves. Journal of Statistical Software, 33, 1–21. 10.18637/jss.v033.i07 20808728 [DOI] [Google Scholar]
- Kalyaanamoorthy, S. , Minh, B. Q. , Wong, T. K. , von Haeseler, A. , & Jermiin, L. S. (2017). ModelFinder: fast model selection for accurate phylogenetic estimates. Nature Methods, 14(6), 587. [DOI] [PMC free article] [PubMed] [Google Scholar]
- Kassambara, A. (2018). ggpubr:“ggplot2” based publication ready plots. R package version 0.1, 7. [Google Scholar]
- Kembel, S. W. , Cowan, P. D. , Helmus, M. R. , Cornwell, W. K. , Morlon, H. , Ackerly, D. D. , Blomberg, S. P. , & Webb, C. O. (2010). Picante: R tools for integrating phylogenies and ecology. Bioinformatics, 26(11), 1463–1464. [DOI] [PubMed] [Google Scholar]
- Koski, M. H. , & Ashman, T. L. (2013). Quantitative variation, heritability, and trait correlations for ultraviolet floral traits in Argentina anserina (Rosaceae): Implications for floral evolution. International Journal of Plant Sciences, 174(8), 1109–1120. [Google Scholar]
- Koski, M. H. , & Ashman, T. L. (2015). Floral pigmentation patterns provide an example of Gloger's rule in plants. Nature Plants, 1(1), 1–5. [DOI] [PubMed] [Google Scholar]
- Koski, M. H. , & Ashman, T. L. (2016). Macroevolutionary patterns of ultraviolet floral pigmentation explained by geography and associated bioclimatic factors. New Phytologist, 211(2), 708–718. [DOI] [PMC free article] [PubMed] [Google Scholar]
- Lauber, C. L. , Hamady, M. , Knight, R. , & Fierer, N. (2009). Pyrosequencing‐based assessment of soil pH as a predictor of soil bacterial community structure at the continental scale. Applied and Environment Microbiology, 75(15), 5111–5120. [DOI] [PMC free article] [PubMed] [Google Scholar]
- Lenth, R. , Singmann, H. , Love, J. , Buerkner, P. , & Herve, M. (2020) emmeans: Estimated Marginal Means, aka Least‐Squares Means. R Package version 1.4.5. [Google Scholar]
- Leveau, J. H. , & Lindow, S. E. (2001). Appetite of an epiphyte: quantitative monitoring of bacterial sugar consumption in the phyllosphere. Proceedings of the National Academy of Sciences of the United States of America, 98(6), 3446–3453. [DOI] [PMC free article] [PubMed] [Google Scholar]
- Lindow, S. E. , & Brandl, M. T. (2003). Microbiology of the phyllosphere. Applied and Environmental Microbiology, 69(4), 1875–1883. [DOI] [PMC free article] [PubMed] [Google Scholar]
- Lozupone, C. , & Knight, R. (2005). UniFrac: a new phylogenetic method for comparing microbial communities. Applied and Environmental Microbiology, 71(12), 8228–8235. [DOI] [PMC free article] [PubMed] [Google Scholar]
- Majetic, C. J. , Raguso, R. A. , Tonsor, S. J. , & Ashman, T. L. (2007). Flower color–flower scent associations in polymorphic Hesperis (Brassicaceae). Phytochemistry, 68(6), 865–874. [DOI] [PubMed] [Google Scholar]
- Martiny, A. C. (2019). High proportions of bacteria are culturable across major biomes. The ISME Journal, 13(8), 2125–2128. [DOI] [PMC free article] [PubMed] [Google Scholar]
- Massoni, J. , Bortfeld‐Miller, M. , Jardillier, L. , Salazar, G. , Sunagawa, S. , & Vorholt, J. A. (2020). Consistent host and organ occupancy of phyllosphere bacteria in a community of wild herbaceous plant species. The ISME Journal, 14(1), 245–258. [DOI] [PMC free article] [PubMed] [Google Scholar]
- Montero‐Calasanz, M. D. C. , Hofner, B. , Göker, M. , Rohde, M. , Spröer, C. , Hezbri, K. , Gtari, M. , Schumann, P. , & Klenk, H.‐P. (2014). Geodermatophilus poikilotrophi sp. nov.: A multitolerant actinomycete isolated from dolomitic marble. BioMed Research International, 2014, 1–11. [DOI] [PMC free article] [PubMed] [Google Scholar]
- Morris, M. M. , Frixione, N. J. , Burkert, A. C. , Dinsdale, E. A. , & Vannette, R. L. (2020). Microbial abundance, composition, and function in nectar are shaped by flower visitor identity. FEMS Microbiology Ecology, 96(3), fiaa003. [DOI] [PubMed] [Google Scholar]
- Moyers, B. T. , Owens, G. L. , Baute, G. J. , & Rieseberg, L. H. (2017). The genetic architecture of UV floral patterning in sunflower. Annals of Botany, 120(1), 39–50. [DOI] [PMC free article] [PubMed] [Google Scholar]
- Müller, D. B. , Vogel, C. , Bai, Y. , & Vorholt, J. A. (2016). The plant microbiota: systems‐level insights and perspectives. Annual Review of Genetics, 50, 211–234. [DOI] [PubMed] [Google Scholar]
- Nagar, S. D. , Aggarwal, B. , Joon, S. , Bhatnagar, R. , & Bhatnagar, S. (2016). A network biology approach to Decipher stress response in bacteria using Escherichia coli as a model. OMICS: A Journal of Integrative Biology, 20(5), 310–324. [DOI] [PMC free article] [PubMed] [Google Scholar]
- Nemergut, D. R. , Schmidt, S. K. , Fukami, T. , O'Neill, S. P. , Bilinski, T. M. , Stanish, L. F. , Knelman, J. E. , Darcy, J. L. , Lynch, R. C. , Wickey, P. , & Ferrenberg, S. (2013). Patterns and processes of microbial community assembly. Microbiology and Molecular Biology Reviews, 77(3), 342–356. [DOI] [PMC free article] [PubMed] [Google Scholar]
- Nguyen, L. T. , Schmidt, H. A. , Von Haeseler, A. , & Minh, B. Q. (2015). IQ‐TREE: A fast and effective stochastic algorithm for estimating maximum‐likelihood phylogenies. Molecular Biology and Evolution, 32(1), 268–274. [DOI] [PMC free article] [PubMed] [Google Scholar]
- O'Dwyer, J. P. , Kembel, S. W. , & Green, J. L. (2012). Phylogenetic diversity theory sheds light on the structure of microbial communities. PLoS Computational Biology, 8(12), e1002832. [DOI] [PMC free article] [PubMed] [Google Scholar]
- Oksanen, J. , Blanchet, F. G. , Friendly, M. , Kindt, R. , Legendre, P. , McGlinn, D. , Minchin, P. R. , O'Hara, R. B. , Simpson, G. L. , Solymos, P. , Stevens, M. H. H. , Szoecs, E. , & Wagner, H. (2019). vegan: Community Ecology Package. R package version 2.5‐6. https://CRAN.R‐project.org/package=vegan [Google Scholar]
- Pagès, H. , Aboyoun, P. , Gentleman, R. , & DebRoy, S. (2019). Biostrings: Efficient manipulation of biological strings. R package version 2.54.0. [Google Scholar]
- Quast, C. , Pruesse, E. , Yilmaz, P. , Gerken, J. , Schweer, T. , Yarza, P. , Peplies, J. , & Glöckner, F. O. (2012). The SILVA ribosomal RNA gene database project: Improved data processing and web‐based tools. Nucleic Acids Research, 41(D1), D590–D596. [DOI] [PMC free article] [PubMed] [Google Scholar]
- R Core Team (2019). R: A language and environment for statistical computing. R Foundation for Statistical Computing; https://www.R‐project.org/ [Google Scholar]
- Ramos, J. L. , Gallegos, M. T. , Marqués, S. , Ramos‐González, M. I. , Espinosa‐Urgel, M. , & Segura, A. (2001). Responses of Gram‐negative bacteria to certain environmental stressors. Current Opinion in Microbiology, 4(2), 166–171. [DOI] [PubMed] [Google Scholar]
- Rebolleda‐Gómez, M. , & Ashman, T. L. (2019). Floral organs act as environmental filters and interact with pollinators to structure the yellow monkeyflower (Mimulus guttatus) floral microbiome. Molecular Ecology, 28(23), 5155–5171. [DOI] [PubMed] [Google Scholar]
- Rebolleda‐Gómez, M. , Forrester, N. J. , Russell, A. L. , Wei, N. , Fetters, A. M. , Stephens, J. D. , & Ashman, T.‐L. (2019). Gazing into the anthosphere: considering how microbes influence floral evolution. New Phytologist, 224(3), 1012–1020. [DOI] [PubMed] [Google Scholar]
- Redford, A. J. , Bowers, R. M. , Knight, R. , Linhart, Y. , & Fierer, N. (2011). The ecology of the phyllosphere: Geographic and phylogenetic variability in the distribution of bacteria on tree leaves. Environmental Microbiology, 12(11), 2885–2893. [DOI] [PMC free article] [PubMed] [Google Scholar]
- Remus‐Emsermann, M. N. , Lücker, S. , Müller, D. B. , Potthoff, E. , Daims, H. , & Vorholt, J. A. (2014). Spatial distribution analyses of natural phyllosphere‐colonizing bacteria on Arabidopsis thaliana revealed by fluorescence in situ hybridization. Environmental Microbiology, 16(7), 2329–2340. [DOI] [PubMed] [Google Scholar]
- Rering, C. C. , Beck, J. J. , Hall, G. W. , McCartney, M. M. , & Vannette, R. L. (2018). Nectar‐inhabiting microorganisms influence nectar volatile composition and attractiveness to a generalist pollinator. New Phytologist, 220(3), 750–759. [DOI] [PubMed] [Google Scholar]
- Russell, A. L. , Rebolleda‐Gómez, M. , Shaible, T. M. , & Ashman, T. L. (2019). Movers and shakers: Bumble bee foraging behavior shapes the dispersal of microbes among and within flowers. Ecosphere, 10(5), e0214. [Google Scholar]
- Saikkonen, K. , Nissinen, R. , & Helander, M. (2020). Toward comprehensive plant microbiome research. Frontiers in Ecology and Evolution, 8, 61. [Google Scholar]
- Shade, A. , Jones, S. E. , Caporaso, J. G. , Handelsman, J. , Knight, R. , Fierer, N. , & Gilbert, J. A. (2014). Conditionally rare taxa disproportionately contribute to temporal changes in microbial diversity. Mbio 5.4, e01371‐14. [DOI] [PMC free article] [PubMed] [Google Scholar]
- Shade, A. , McManus, P. S. , & Handelsman, J. (2013). Unexpected diversity during community succession in the apple flower microbiome. Mbio, 4.2, e00602‐12. [DOI] [PMC free article] [PubMed] [Google Scholar]
- Shukla, S. K. , & Rao, T. S. (2017). An improved crystal violet assay for biofilm quantification in 96‐well microtitre plate. bioRxivorg, 100214. 10.1101/100214 [DOI] [Google Scholar]
- Sobel, J. M. , & Streisfeld, M. A. (2013). Flower color as a model system for studies of plant evo‐devo. Frontiers in Plant Science, 4, 321. [DOI] [PMC free article] [PubMed] [Google Scholar]
- Steen, A. D. , Crits‐Christoph, A. , Carini, P. , DeAngelis, K. M. , Fierer, N. , Lloyd, K. G. , & Thrash, J. C. (2019). High proportions of bacteria and archaea across most biomes remain uncultured. The ISME Journal, 13(12), 3126–3130. [DOI] [PMC free article] [PubMed] [Google Scholar]
- Steven, B. , Huntley, R. B. , & Zeng, Q. (2018). The influence of flower anatomy and apple cultivar on the apple flower phytobiome. Phytobiomes, 2(3), 171–179. [Google Scholar]
- Sun, M. , & Ganders, F. R. (1990). Outcrossing rates and allozyme variation in rayed and rayless morphs of Bidens pilosa . Heredity, 64(1), 139–143. [Google Scholar]
- Sundin, G. W. , & Jacobs, J. L. (1999). Ultraviolet radiation (UVR) sensitivity analysis and UVR survival strategies of a bacterial community from the phyllosphere of field‐grown peanut (Arachis hypogeae L.). Microbial Ecology, 38(1), 27–38. [DOI] [PubMed] [Google Scholar]
- Thompson, J. D. , Higgins, D. G. , & Gibson, T. J. (1994). CLUSTAL W: improving the sensitivity of progressive multiple sequence alignment through sequence weighting, position specific gap penalties and weight matrix choice. Nucleic Acids Research, 22(22), 4673–4680. [DOI] [PMC free article] [PubMed] [Google Scholar]
- USDA (1981). Soil survey of Allegheny County, Pennsylvania. https://www.nrcs.usda.gov/Internet/FSE_MANUSCRIPTS/pennsylvania/PA003/0/allegheny.pdf [Google Scholar]
- Valenta, K. , Nevo, O. , Martel, C. , & Chapman, C. A. (2017). Plant attractants: Integrating insights from pollination and seed dispersal ecology. Evolutionary Ecology, 31(2), 249–267. [Google Scholar]
- van der Kooi, C. J. , Kevan, P. G. , & Koski, M. H. (2019). The thermal ecology of flowers. Annals of Botany, 124(3), 343–353. [DOI] [PMC free article] [PubMed] [Google Scholar]
- van der Niet, T. , & Johnson, S. D. (2012). Phylogenetic evidence for pollinator‐driven diversification of angiosperms. Trends in Ecology and Evolution, 27(6), 353–361. [DOI] [PubMed] [Google Scholar]
- Vannette, R. , Hall, G. , & Munkres, I. (2020). Fungi are more dispersal‐limited than bacteria among flowers. BioRxiv. 10.1101/2020.05.19.104968 [DOI] [Google Scholar]
- Venables, W. N. , & Ripley, B. D. (2002). Modern applied statistics with S (4th ed.). Springer. [Google Scholar]
- von Arx, M. , Moore, A. , Davidowitz, G. , & Arnold, A. E. (2019). Diversity and distribution of microbial communities in floral nectar of two night‐blooming plants of the Sonoran Desert. PLoS One, 14(12), e0225309. [DOI] [PMC free article] [PubMed] [Google Scholar]
- Wang, Q. , Garrity, G. M. , Tiedje, J. M. , & Cole, J. R. (2007). Naive Bayesian classifier for rapid assignment of rRNA sequences into the new bacterial taxonomy. Applied and Environmental Microbiology, 73(16), 5261–5267. [DOI] [PMC free article] [PubMed] [Google Scholar]
- Wei, N. , & Ashman, T. L. (2018). The effects of host species and sexual dimorphism differ among root, leaf and flower microbiomes of wild strawberries in situ. Scientific Reports, 8(1), 1–12. [DOI] [PMC free article] [PubMed] [Google Scholar]
- Whitney, H. M. , Poetes, R. , Steiner, U. , Chittka, L. , & Glover, B. J. (2011). Determining the contribution of epidermal cell shape to petal wettability using isogenic Antirrhinum lines. PLoS One, 6(3), e17576. [DOI] [PMC free article] [PubMed] [Google Scholar]
- Wilson, M. , & Lindow, S. E. (1994). Coexistence among epiphytic bacterial populations mediated through nutritional resource partitioning. Applied and Environmental Microbiology, 60(12), 4468–4477. [DOI] [PMC free article] [PubMed] [Google Scholar]
- Yashiro, E. , Spear, R. N. , & McManus, P. S. (2011). Culture‐dependent and culture‐independent assessment of bacteria in the apple phyllosphere. Journal of Applied Microbiology, 110(5), 1284–1296. [DOI] [PubMed] [Google Scholar]
- Yilmaz, P. , Parfrey, L. W. , Yarza, P. , Gerken, J. , Pruesse, E. , Quast, C. , Schweer, T. , Peplies, J. , Ludwig, W. , & Glöckner, F. O. (2014). The SILVA and “all‐species living tree project (LTP)” taxonomic frameworks. Nucleic Acids Research, 42(D1), D643–D648. [DOI] [PMC free article] [PubMed] [Google Scholar]
- Zarraonaindia, I. , Owens, S. M. , Weisenhorn, P. , West, K. , Hampton‐Marcell, J. , Lax, S. , Bokulich, N. A. , Mills, D. A. , Martin, G. , Taghavi, S. , van der Lelie, D. , & Gilbert, J. A. (2015). The soil microbiome influences grapevine‐associated microbiota. Mbio, 6(2), e02527‐14. [DOI] [PMC free article] [PubMed] [Google Scholar]
- Zemenick, A. T. , Rosenheim, J. A. , & Vannette, R. L. (2018). Legitimate visitors and nectar robbers of Aquilegia formosa have different effects on nectar bacterial communities. Ecosphere, 9(10), e02459. [Google Scholar]
Associated Data
This section collects any data citations, data availability statements, or supplementary materials included in this article.
Data Availability Statement
Sequence data are available in GenBank https://www.ncbi.nlm.nih.gov/nuccore, under accession numbers MT544502–MT544586 and under BioProject PRJNA644391: https://www.ncbi.nlm.nih.gov/bioproject/PRJNA644391. Other data are available in the Dryad repository at https://doi.org/10.5061/dryad.2v6wwpzjt (Table S3. Summary of bacteria isolated from ray petals, traits scored and information from the literature on the location of previous isolation; Table S4. Bacterial isolate morphological traits. Isolates were grown on lysogeny broth agar media for 72 h at 30°C, and colonies were scored on eight morphological traits. Colony images were taken using the Leica EZ4W dissecting microscope). Code for phylogenetic analyses, growth curves, and biology analyses can be found on GitHub: https://github.com/mrebolleda/Paper_MicrobialCommunitySpacePetal.