Abstract
Background
With a mortality rate of 65–85%, a ruptured abdominal aortic aneurysm (AAA) can have catastrophic consequences for patients. However, few effective pharmaceutical treatments are available to treat this condition. Therefore, elucidating the pathogenesis of AAA and finding the potential molecular targets for medical therapies are vital lines of research.
Methods
An mRNA microarray dataset of perivascular adipose tissue (PVAT) in AAA patients was downloaded and differentially expressed gene (DEG) screening was performed. Weighted gene co-expression networks for dilated and non-dilated PVAT samples were constructed via weighted correlation network analysis (WGCNA) and used to detect gene modules. Functional annotation analysis was performed for the DEGs and gene modules. We identified the hub genes of the modules and created a DEG co-expression network. We then mined crucial genes based on this network using Molecular Complex Detection (MCODE) in Cytoscape. Crucial genes with top-6 degree in the crucial gene cluster were visualized, and their potential clinical significance was determined.
Results
Of the 173 DEGs screened, 99 were upregulated and 74 were downregulated. Co-expression networks were built and we detected 6 and 5 modules for dilated and non-dilated PVAT samples, respectively. The turquoise and black modules for dilated PVAT samples were related to inflammation and immune response. MAP4K1 and PROK2 were the hub genes of these 2 modules, respectively. Then a DEG co-expression network with 112 nodes and 953 edges was created. PLAU was the crucial gene with the highest connectivity and showed potential clinical significance.
Conclusions
Using WGCNA, gene modules were detected and hub genes and crucial genes were identified. These crucial genes might be potential targets for pharmaceutic therapies and have potential clinical significance. Future in vitro and in vivo experiments are required to more comprehensively explore the biological mechanisms by which these genes affect AAA pathogenesis
Keywords: Abdominal aortic aneurysm (AAA), perivascular adipose tissue, weighted correlation network analysis, crucial genes
Introduction
Abdominal aortic aneurysm (AAA) is the true aneurysm of the abdominal aorta and the diameter of AAA is over 1.5 times than normal (1). Risk factors for AAA include smoking, male sex, family history, old age, and other factors (2). An AAA rupture has catastrophic consequences for patients, and the mortality rate is 65–85%. Currently, the primary treatment for AAA includes open surgical repair and endovascular repair (3); however, few effective pharmaceutical treatments are available. Therefore, elucidating the pathogenesis of AAA and finding the potential molecular targets for medical therapies are quite important. Previous studies have indicated that inflammation, immune response, extracellular matrix (ECM) degradation, vascular smooth muscle phenotypic switching, etc., promote the development and progression of AAA (4-6).
Perivascular adipose tissue (PVAT) is the adipose tissue surrounding most blood vessels (7). It represents approximately 3% of total adipose tissue and was initially thought only to support the vasculature, although it has now been shown to play important roles in vascular pathologies as well, such as in atherosclerosis, hypertension, and AAA (8-10). Dysfunctional PVAT is associated with inflammation through the production of inflammatory cytokines and chemokines (11). Piacentini et al. were the first to use a high throughput approach via an mRNA microarray to examine PVAT in AAA. Through functional enrichment analysis, they found that an altered immunological response in PVAT is involved in the pathogenesis of AAA (12). However, weighted correlation network analysis (WGCNA) has rarely been used with high throughput PVAT data to investigate crucial genes that mediate AAA pathogenesis.
WGCNA is an algorithm first created by Zhang and Horvath (13). Using gene expression data, WGCNA is used to build a weighted gene co-expression network, detect gene modules, and identify genes with critical biological functions (14). Non-coding RNA data, proteomic data, metabolomic data, and even microbiome data can be used in WGCNA analyses (15-17). An R package has also been developed by Langfelder and Horvath (18) and is available for researchers on the R official website (https://cran.r-project.org/) to perform WGCNA analysis.
In our study, mRNA microarray data for the PVAT of AAA patients was obtained from the Gene Expression Omnibus (GEO) website (http://www.ncbi.nlm.nih.gov/geo/). This includes data from dilated abdominal aorta PVAT (dilated PVAT) samples and non-dilated abdominal aorta PVAT (non-dilated PVAT) samples. We constructed weighted networks and detected gene modules for both dilated PVAT and non-dilated PVAT samples. Functional annotation analysis was conducted using genes in modules. We then mapped differentially expressed genes (DEGs) into the co-expression network of dilated PVAT samples and created a DEG co-expression network to identify crucial genes. The crucial genes with top-6 degree in the crucial gene cluster were visualized, and their potential clinical significance was determined. We present the following article in accordance with the MDAR reporting checklist (available at: http://dx.doi.org/10.21037/atm-20-3758).
Methods
Medical ethics
The raw datasets were available from the GEO database (http://www.ncbi.nlm.nih.gov/geo/; GSE119717). In our study, neither human trials nor animal experiments were executed.
Data preprocessing
We selected the GEO dataset GSE119717 for our study. The series matrix files and data table of the GPL10558 platform were obtained from the GEO website (https://www.ncbi.nlm.nih.gov/geo/query/acc.cgi?acc=GSE119717). The probe ID of the probe matrix from the series matrix files was annotated with gene symbols using the platform data table, then the gene expression matrix was generated. Samples from dilated PVAT and non-dilated PVAT were included for further analysis.
DEG screening
The complete differentially expressed (DE) transcripts list was obtained from the online-only data supplement 3 of the AAA PVAT study conducted by Piacentini et al. This list is based on paired-sample tests. Confounder effects and patient heterogeneity were eliminated (12). The threshold to select DE transcripts and DEGs in our study was a |log2(Fold-change)| of >0.5 (dilated PVAT/non-dilated PVAT) and an adjusted P value of <0.05.
Weighted gene co-expression network construction
The top 25% of genes with the highest expression variance were selected to construct the co-expression network. Pearson’s correlation was used to calculate the correlation coefficients between genes and produce a correlation matrix. The cutoff R2 was set as 0.9 for the soft threshold β in both dilated PVAT and non-dilated PVAT samples. The adjacency matrix, which stored co-expression network information, was then built using the following formula: amn = |cmn|β (amn: element in the adjacency matrix; cmn: correlation coefficient between genes; β: soft threshold). A topological overlap measure (TOM) matrix was then generated based on the adjacency matrix. Using the TOM matrix, average linkage hierarchical clustering and a dynamic tree cut were performed to detect gene modules. The minimal module size was set as 100 and similar modules were merged with a threshold of 0.25.
Functional annotation analysis
Upregulated genes and downregulated genes were used to conduct a Kyoto Encyclopedia of Genes and Genomes (KEGG) pathway analysis and a Gene Ontology Biological Processes (GO-BP) analysis using The Database for Annotation, Visualization and Integrated Discovery (DAVID) 6.8 (https://david.ncifcrf.gov/) (19). These analyses were also performed for each gene module. The threshold for the functional annotation analysis was set as P<0.05 with a count number of >2. The patterns of co-expression between dilated PVAT samples and non-dilated PVAT samples were then compared using KEGG pathway and GO-BP analysis.
Hub gene and crucial gene mining
The intramodular connectivity within gene modules was determined by the WGCNA algorithm. The gene with the highest connectivity in each module was considered the hub gene. A DEG co-expression network was then created by mapping DEGs into the co-expression network of dilated PVAT samples using Cytoscape 3.7.2. The Molecular Complex Detection (MCODE) algorithm was used within Cytoscape to detect crucial gene clusters based on the DEG co-expression network. Crucial genes with top-6 degree in the crucial gene cluster were visualized, and their potential clinical significance was determined by receiver operating characteristic (ROC) analysis.
Statistical analysis
R v3.6.2 was used to conduct data preprocessing, DEG screening and WGCNA analysis. DAVID v6.8 was used to perform functional annotation analysis, and MCODE in Cytoscape v3.7.0 was selected to mine crucial genes. We have described the details of these bioinformatic analyses in corresponding subsections. IBM SPSS 25.0 was used to conduct ROC analysis, which showed the potential diagnostic value of crucial genes. A P value of <0.05 was considered significant.
Results
Study workflow
The flowchart of our study is shown in Figure 1. Data were downloaded from the GEO website and preprocessed. DEGs were then screened and weighted co-expression networks were constructed. KEGG pathway and GO-BP analyses were conducted for the DEGs and genes in each module. The co-expression patterns between dilated PVAT samples and non-dilated PVAT samples were then compared based on the results of the GO-BP and KEGG analyses. A DEG co-expression network was then constructed by mapping DEGs into the co-expression network of dilated PVAT samples. Crucial genes were identified by MCODE using the DEG co-expression network. The potential diagnostic value of crucial genes with top-6 degree was determined by ROC analysis.
Figure 1.
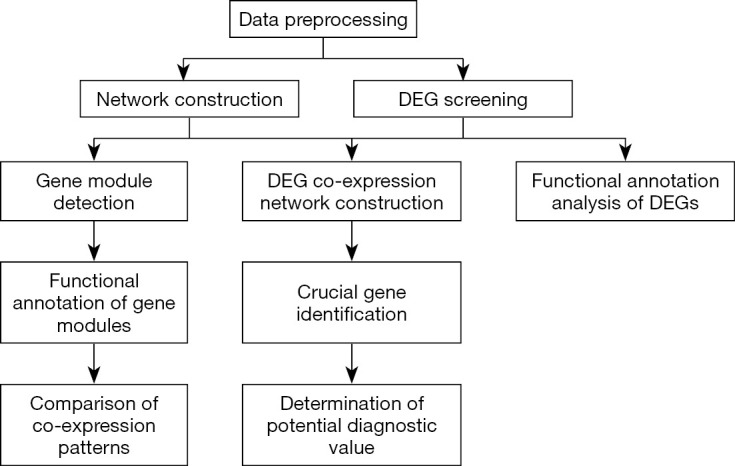
Workflow for the whole study. DEG, differentially expressed gene.
DEG screening
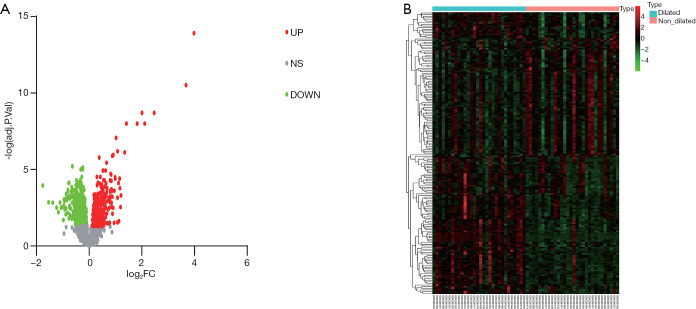
In our study, 194 DE transcripts were screened with an adjusted P value of <0.05 and a |log2 (Fold-change)| of >0.5 (Figure 2A) as the threshold. These DE transcripts corresponded to 173 DEGs, of which 99 genes were upregulated and 74 were downregulated (Figure 2B). The 10 DEGs with the highest | log2(Fold-change) | are shown in Table 1.
Figure 2.
Patterns of DE transcripts and DEGs. (A) The volcano plot showed the number of DE transcripts. The red dots represent the up-regulated transcripts while the green dots represent the down-regulated transcripts. (B) The heatmap showed the expression patterns of DEGs between dilated PVAT samples and non-dilated PVAT samples. DE, differentially expressed; DEG, differentially expressed gene; PVAT, perivascular adipose tissue.
Table 1. DEGs with top-10 |log2(Fold-change)| (dilated PVAT/non-dilated PVAT).
| Gene symbol | Official full name | Log2(Fold-change) | Adjusted P value |
|---|---|---|---|
| Up-regulated | |||
| FOS | Fos proto-oncogene, AP-1 transcription factor subunit | 3.98 | 1.20E-14 |
| FOSB | FosB proto-oncogene, AP-1 transcription factor subunit | 3.68 | 3.04E-11 |
| EGR1 | Early growth response 1 | 2.47 | 1.94E-09 |
| CYR61 | Cellular communication network factor 1 | 2.11 | 1.01E-08 |
| DUSP1 | Dual specificity phosphatase 1 | 2.01 | 1.94E-09 |
| ZFP36 | ZFP36 ring finger protein | 1.82 | 1.01E-08 |
| JUNB | JunB proto-oncogene, AP-1 transcription factor subunit | 1.41 | 1.01E-08 |
| JUN | Jun proto-oncogene, AP-1 transcription factor subunit | 1.35 | 7.60E-07 |
| NR4A2 | Nuclear receptor subfamily 4 group A member 2 | 1.21 | 2.18E-04 |
| S100A9 | S100 calcium binding protein A9 | 1.19 | 8.30E-04 |
| Down-regulated | |||
| SLN | Sarcolipin | −1.76 | 4.73E-07 |
| DES | Desmin | −1.54 | 2.67E-05 |
| MYH11 | Myosin heavy chain 11 | −1.38 | 2.97E-05 |
| CNN1 | Calponin 1 | −1.23 | 8.71E-05 |
| MYLK | Myosin light chain kinase | −1.17 | 2.63E-04 |
| KCNMB1 | Potassium calcium-activated channel subfamily M regulatory beta subunit 1 | −1.11 | 2.78E-05 |
| PDLIM3 | PDZ and LIM domain 3 | −1.06 | 8.87E-05 |
| SYNM | Synemin | −1.03 | 7.81E-05 |
| NTS | Neurotensin | −0.97 | 1.54E-03 |
| PDLIM3 | PDZ and LIM domain 3 | −0.96 | 5.36E-05 |
PVAT, perivascular adipose tissue.
Weighted gene co-expression network construction
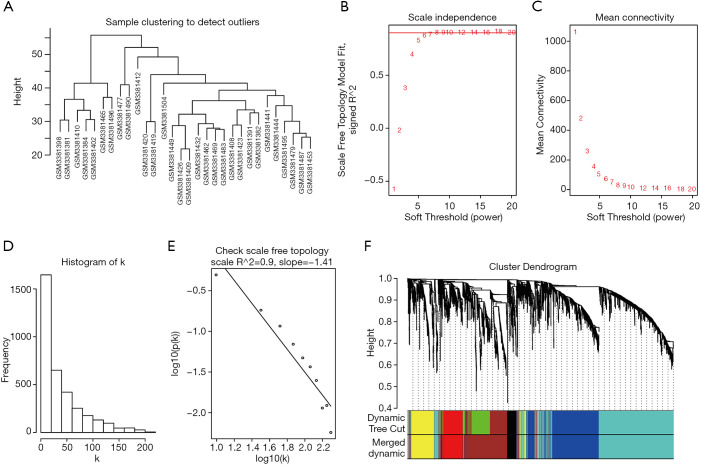
Sample clustering detected no outliers in either dilated or non-dilated PVAT samples, and all were included in the analysis (Figure 3A and Figure S1A). With a cutoff R2 value of 0.9, a soft threshold β value of 8 was selected for dilated PVAT samples, while a value of 10 was selected for non-dilated PVAT samples (Figure 3B,C and Figure S1B,S1C). The histogram and the linear plot showed that we constructed 2 networks with scale-free topology (Figures 3D,E and Figures S1D,S1E). After a dynamic tree cut and merging, we discovered 6 and 5 gene modules for dilated PVAT and non-dilated PVAT sample, respectively.
Figure 3.
Weighted co-expression network construction for dilated PVAT. (A) No outliers were detected by sample clustering. (B,C)The soft-threshold β was chosen to be 8. (D,E) The network we constructed met the requirements of scale-free topology. (F) After dynamic tree cut and merging, 6 gene modules were detected. PVAT, perivascular adipose tissue.
Functional annotation analysis
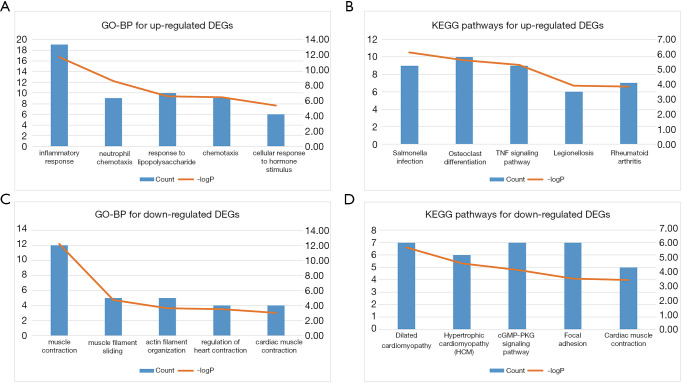
The upregulated and downregulated DEGs were used in functional annotation analyses; the results are shown in Table S1 and Table S2. Upregulated DEGs were related to inflammation and the immune response; downregulated DEGs were related to muscle contraction. The 5 KEGG pathways and GO-BP terms with the most significant p values were visualized (Figure 4).
Figure 4.
GO-BP and KEGG pathways with top-5 significant p value for up-regulated DEGs and Down-regulated DEGs. (A,B) Up-regulated DEGs are mainly associated with inflammation and immune response. (C,D) Down-regulated DEGs are mainly associated with muscle contraction. The left axis represents count number and the right axis represent −logP. GO-BP, Gene Ontology Biological Processes; DEG, differentially expressed gene.
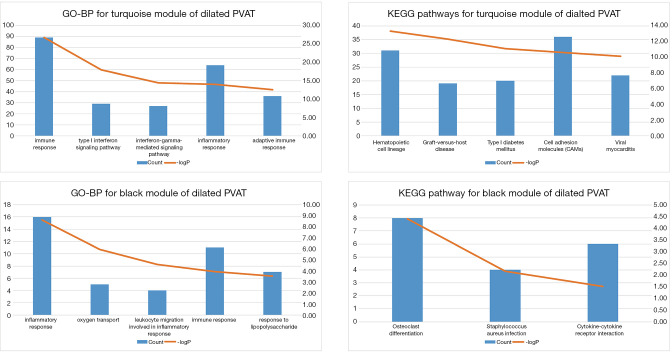
The results of the KEGG pathway and GO-BP analyses of gene modules are presented in Table S3 and Table S4. The black and turquoise gene modules for dilated PVAT samples were associated with inflammation and the immune response (Figure 5). However, these inflammation and immune response-associated pathways were scattered across the modules of non-dilated samples.
Figure 5.
GO-BP terms and KEGG pathways with top-5 significant p value for black and turquoise module of dilated PVAT. The left axis represents count number and the right axis represent −logP. GO-BP, Gene Ontology Biological Processes; KEGG, Kyoto Encyclopedia of Genes and Genomes; PVAT, perivascular adipose tissue.
Hub gene and crucial gene mining
Hub genes for each module are listed in Table S5. MAP4K1 and PROK2 were the respective hub genes for the turquoise and black PVAT sample gene modules.
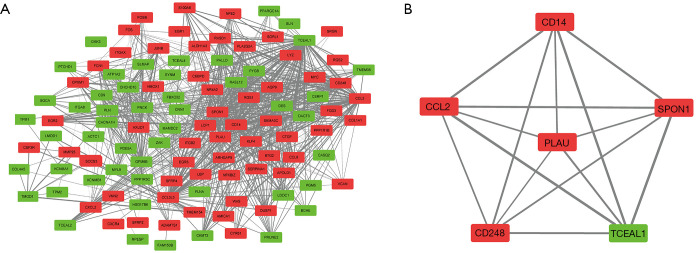
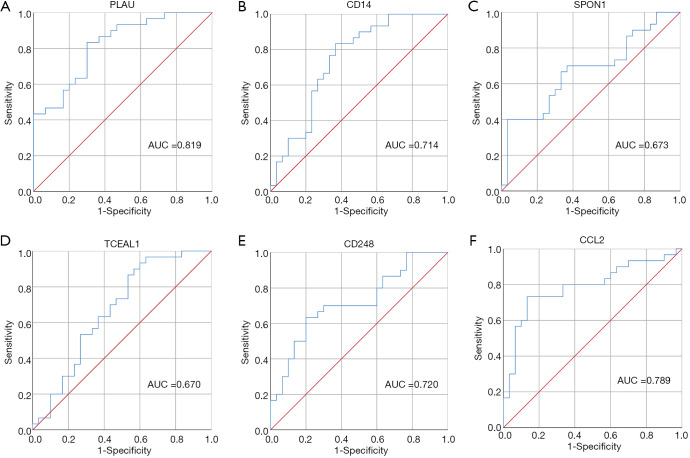
After removing isolated nodes and node pairs, a DEG co-expression network with 112 nodes and 953 edges was obtained (Figure 6A). Crucial genes were mined using MCODE, and crucial genes with top-6 degree were visualized (Figure 6B). Plasminogen activator urokinase (PLAU) was the crucial gene with the highest connectivity. All these crucial genes showed potential clinical significance (Figure 7 and Table 2).
Figure 6.
DEG co-expression network and crucial gene cluster. (A) The DEGs co-expression network with 112 nodes and 953 edges were generated. The red box represents the up-regulated genes and the green box represents the down-regulated genes. (B) Crucial genes with top-6 degree were visualized. DEG, differentially expressed gene.
Figure 7.
The ROC curve of the crucial genes with top-6 degree. ROC, receiver operating characteristic.
Table 2. AUC of the crucial genes with top-6 degree.
| Gene symbol | Official full name | AUC | P value |
|---|---|---|---|
| PLAU | Plasminogen activator, urokinase | 0.819 | <0.001 |
| CD14 | CD14 molecule | 0.741 | 0.001 |
| SPON1 | Spondin 1 | 0.673 | 0.021 |
| TCEAL1 | transcription elongation factor A like 1 | 0.670 | 0.024 |
| CD248 | CD248 molecule | 0.720 | 0.003 |
| CCL2 | C-C motif chemokine ligand 2 | 0.789 | <0.001 |
Discussion
Obesity has become a major public health concern worldwide and significantly increases the risk of AAA (20). PVAT expands and becomes dysfunctional during obesity, which contributes to AAA progression (10,21). By using gene co-expression networks, our study aimed to provide further insight into the associations between obesity and AAA pathogenesis. We selected 173 DEGs, of which 99 were upregulated and 74 were downregulated. The upregulated DEGs were related to inflammation and the immune response, while downregulated DEGs were related to muscle contraction. By constructing weighted gene co-expression networks for dilated and non-dilated PVAT samples, 6 gene modules were discovered for dilated samples and 5 were discovered for non-dilated samples. The black and turquoise modules for dilated PVAT samples were also associated with inflammation and the immune response, and the hub genes of these 2 modules were PROK2 and MAP4K1, respectively. A DEG co-expression network was then created, and the crucial genes were identified. Crucial genes with top-6 degree in the crucial gene cluster were visualized. PLAU was the gene with the highest connectivity. Finally, by conducting a ROC analysis, we found that all 6 crucial genes had potential diagnostic significance.
Piacentini et al. were the first to use an mRNA microarray to study PVAT in human AAA. Using a |log2(Fold-change)| of >0.38 and an adjusted P value of <0.05, they screened 193 upregulated DE transcripts and 142 downregulated transcripts (12). We chose to use a |log2(Fold-change)| of >0.5 and an adjusted P value of <0.05 as a more stringent threshold, and we screened fewer DE transcripts and DEGs than Piacentini et al.
The results of our functional annotation analysis showed that the co-expression patterns between dilated and non-dilated PVAT were different. Inflammation and the immune response were clustered in the black and turquoise modules of dilated PVAT samples. Using microarray data from AAA tissue, researchers have found that immune and inflammation-related processes, such as B cell and T cell signaling pathways, cytokine–cytokine receptor interactions, natural killer (NK) cell–mediated cytotoxicity, etc. are involved in AAA pathogenesis (22-24). Immune cells such as macrophages, B and T cells, NK cells, etc. are present in AAA tissue (25-27). Studies investigating PVAT tissue have made similar discoveries. PVAT is rich in interleukin-6 (IL-6), which might upregulate CD14 expression in the adventitia throughout the formation of an AAA (28,29). Li et al. found that endothelin-1 increases reactive oxygen species production, as well as CD4+ T cell and monocyte/macrophage infiltration in Apoe(−/−) mouse models (30). Folkesson et al. also discovered that increased T cell, neutrophil, and mast cell counts in the PVAT of AAA patients (31). In addition, PAVT contributes to AAA formation by promoting angiotensin II type 1 receptor and platelet-derived growth factor D–mediated vascular inflammation and the binding of IL-18 to corresponding receptors (32-34). These studies, in addition to the research by Piacentini et al., suggest that PVAT mediates the pathogenesis of AAA via inflammation and the immune response; our results were consistent with these findings. Therefore, targeting inflammation and modulating the immune response at the PVAT level, might inhibit AAA progression. AMP-activated protein kinase (AMPK) activators, such as diosgenin, salicylate, metformin, etc., can inhibit inflammation induced by palmitic acid and downregulate the expression of pro-inflammatory cytokines CCL2, IL-6, and TNF-α in PVAT (35,36). Additionally, Skiba et al. found that AVE0991, an agonist of the Mas receptor, can reduce the recruitment of monocytes/macrophages to PVAT, and Mikolajczyk et al. showed that 1,2,3,4,6-penta-O-galloyl-β-d-glucose (PCG) can decrease leukocyte and T cell infiltration in PVAT (37,38). Although few studies of PVAT in AAA have been carried out, these findings still suggest that anti-inflammatory and immunomodulating strategies might be effective treatments for AAA. We also found that downregulated DEGs were primarily associated with muscle contraction. Although the detailed function of muscle contraction in AAA pathogenesis has not yet been verified, Chew et al. found that certain proteases, such as matrix metalloproteinase and elastase, have inhibitory roles in vascular smooth muscle contraction by inhibiting the passage of Ca2+, thereby promoting early aortic dilation (39-41). Our previous study that integrated mRNA microarray data from AAA tissues obtained similar findings (42).
PROK2 and MAP4K1 were the hub genes of the black and turquoise gene modules for dilated PVAT samples, respectively. PROK2 is a chemokine that interacts with 2 types of G protein-coupled receptors (PKR1 and PKR2) and is associated with inflammation and the immune response (43). PROK2 is upregulated in granulocytes and macrophages found in inflamed tissue (44). Previous studies suggest that PROK2 plays important roles in mediating inflammation-associated disorders, such as inflammatory pain, psoriasis, and orchitis (44-46). Choke et al. also found that PROK2 was upregulated with 7-fold at rupture sites of AAA (47). MAP4K1 is usually expressed by T and B cells and participates in the regulation of inflammation and immune-related processes, such as cytokine production, immune cell adhesion, and T and B cell activation et al. Our previous study also found that MAP4K1 is the hub gene of the module related to inflammation and the immune response in AAA samples (42,48-50). Although the detailed mechanisms of these 2 PVAT genes in AAA remain unknown, these genes might be potential targets for the mediation of AAA pathogenesis because they are important mediators of inflammation and the immune response.
PLAU, also named u-PA, is the gene with the highest connectivity among the crucial genes. It is a serine protease that cleaves plasminogen into plasmin. Once generated, plasmin activates metalloproteinases (MMPs), which promote the formation and progression of AAA by degrading ECM (1,2,51). Therefore, u-PA is closely associated with the pathogenesis of AAA. Using Apoe(−/−) Plau(−/−) mouse models, Carmeliet et al. found that aneurysm formation and ECM degradation were inhibited when PLAU genes were deficient (52). These studies suggest that u-PA expression in the PVAT of AAA patients might mediate AAA pathogenesis by indirectly degrading ECM via plasmin and MMPs. Furthermore, Qian et al. had locally overexpressed human plasminogen activator inhibitor-1 (PAI-1), a natural inhibitor of u-PA, in the adventitia of AAA mouse models and found that AAA formation and early progression were prevented. Reduced activity of MMPs and inflammatory cells were also observed. The blockage of u-PA/u-PA receptor (u-PAR) mediated inflammation by PAI-1 might account for the therapeutic effects observed when PAI-1 is locally overexpressed (53). The findings of Qian et al. implicated that local inhibition of u-PA/u-PAR might be a new medical therapy to prevent AAA formation and stabilize early stage AAA.
Other genes with high degree in the crucial gene cluster, such as CD14 and CCL2, also play important roles in AAA pathogenesis. CD14 is preferentially expressed by monocytes and macrophages and, as previously discussed, was found to be upregulated in the PVAT of AAA patients. CD14(−/−) mice have been shown to exhibit both reduced macrophage infiltration and AAA formation (28). CCL2, also called monocyte chemoattractant protein 1 (MCP1), is a C-C motif chemokine ligand and participates in inflammation and immune-related processes. It performs chemokine functions for monocytes and basophils and is upregulated in AAA (54-56). These crucial genes are also potential molecular targets to mediate AAA pathogenesis and have potential diagnostic value.
Our study was the first to construct weighted gene co-expression networks for dilated and non-dilated PVAT samples from AAA patients. We also combined DEGs and the weighted co-expression network to identify crucial genes with potential biological functions in the pathogenesis of AAA. However, we did not analyze the correlation between gene modules and the clinical traits of patients due to the clinical information provided on the GEO website being incomplete.
The co-expression network patterns found between the dilated PVAT samples and non-dilated PVAT samples were different. These differences imply that inflammatory and immunological responses in PVAT are involved in the pathogenesis of AAA Then crucial genes were identified, which might potentially play critical roles in AAA formation.
Conclusions
Using WGCNA, 6 and 5 gene modules were detected for dilated PVAT and non-dilated PVAT samples, respectively. Module hub genes were detected, and then crucial genes were identified using our DEG co-expression network. These crucial genes might be potential molecular targets for pharmaceutical therapies and have potential diagnostic value for AAA. Future in vitro and in vivo experiments are required to clarify the detailed molecular mechanisms by which these genes contribute to the pathogenesis of AAA.
Supplementary
The article’s supplementary files as
Acknowledgments
Funding: This work was supported by the Natural Science Foundation of China (no. 81770481 and 51890894). The funders had no role in study design, data collection and analysis, decision to publish, or preparation of the manuscript.
Ethical Statement: The authors are accountable for all aspects of the work in ensuring that questions related to the accuracy or integrity of any part of the work are appropriately investigated and resolved. This study was not involved in the experiments of humans or animals. The raw datasets were available from the GEO database (http://www.ncbi.nlm.nih.gov/geo/; GSE119717).
Reporting Checklist: The authors have completed the MDAR reporting checklist. Available at http://dx.doi.org/10.21037/atm-20-3758
Conflicts of Interest: All authors have completed the ICMJE uniform disclosure form (available at http://dx.doi.org/10.21037/atm-20-3758). The authors declare that they have no conflict of interests.
(English Language Editors: B. Madden and J. Gray)
References
- 1.Sakalihasan N, Michel JB, Katsargyris A, et al. Abdominal aortic aneurysms. Nat Rev Dis Primers 2018;4:34. 10.1038/s41572-018-0030-7 [DOI] [PubMed] [Google Scholar]
- 2.Golledge J. Abdominal aortic aneurysm: update on pathogenesis and medical treatments. Nat Rev Cardiol 2019;16:225-42. 10.1038/s41569-018-0114-9 [DOI] [PubMed] [Google Scholar]
- 3.Moll FL, Powell JT, Fraedrich G, et al. Management of abdominal aortic aneurysms clinical practice guidelines of the European society for vascular surgery. Eur J Vasc Endovasc Surg 2011;41 Suppl 1:S1-58. 10.1016/j.ejvs.2010.09.011 [DOI] [PubMed] [Google Scholar]
- 4.Golledge J, Muller J, Daugherty A, et al. Abdominal aortic aneurysm: pathogenesis and implications for management. Arterioscler Thromb Vasc Biol 2006;26:2605-13. 10.1161/01.ATV.0000245819.32762.cb [DOI] [PubMed] [Google Scholar]
- 5.Nordon IM, Hinchliffe RJ, Loftus IM, et al. Pathophysiology and epidemiology of abdominal aortic aneurysms. Nat Rev Cardiol 2011;8:92-102. 10.1038/nrcardio.2010.180 [DOI] [PubMed] [Google Scholar]
- 6.Raffort J, Lareyre F, Clement M, et al. Monocytes and macrophages in abdominal aortic aneurysm. Nat Rev Cardiol 2017;14:457-71. 10.1038/nrcardio.2017.52 [DOI] [PubMed] [Google Scholar]
- 7.Gao YJ, Lu C, Su LY, et al. Modulation of vascular function by perivascular adipose tissue: the role of endothelium and hydrogen peroxide. Br J Pharmacol 2007;151:323-31. 10.1038/sj.bjp.0707228 [DOI] [PMC free article] [PubMed] [Google Scholar]
- 8.Gollasch M, Dubrovska G. Paracrine role for periadventitial adipose tissue in the regulation of arterial tone. Trends Pharmacol Sci 2004;25:647-53. 10.1016/j.tips.2004.10.005 [DOI] [PubMed] [Google Scholar]
- 9.Siegel-Axel DI, Haring HU. Perivascular adipose tissue: An unique fat compartment relevant for the cardiometabolic syndrome. Rev Endocr Metab Disord 2016;17:51-60. 10.1007/s11154-016-9346-3 [DOI] [PubMed] [Google Scholar]
- 10.Horimatsu T, Kim HW, Weintraub NL. The Role of Perivascular Adipose Tissue in Non-atherosclerotic Vascular Disease. Front Physiol 2017;8:969. 10.3389/fphys.2017.00969 [DOI] [PMC free article] [PubMed] [Google Scholar]
- 11.Nosalski R, Guzik TJ. Perivascular adipose tissue inflammation in vascular disease. Br J Pharmacol 2017;174:3496-513. 10.1111/bph.13705 [DOI] [PMC free article] [PubMed] [Google Scholar]
- 12.Piacentini L, Werba JP, Bono E, et al. Genome-Wide Expression Profiling Unveils Autoimmune Response Signatures in the Perivascular Adipose Tissue of Abdominal Aortic Aneurysm. Arterioscler Thromb Vasc Biol 2019;39:237-49. 10.1161/ATVBAHA.118.311803 [DOI] [PubMed] [Google Scholar]
- 13.Zhang B, Horvath S. A general framework for weighted gene co-expression network analysis. Stat Appl Genet Mol Biol 2005;4:Article17. [DOI] [PubMed]
- 14.van Dam S, Vosa U, van der Graaf A, et al. Gene co-expression analysis for functional classification and gene-disease predictions. Brief Bioinform 2018;19:575-92. [DOI] [PMC free article] [PubMed] [Google Scholar]
- 15.Wang M, Wang L, Pu L, et al. LncRNAs related key pathways and genes in ischemic stroke by weighted gene co-expression network analysis (WGCNA). Genomics 2020;112:2302-8. 10.1016/j.ygeno.2020.01.001 [DOI] [PubMed] [Google Scholar]
- 16.Pei G, Chen L, Zhang W. WGCNA Application to Proteomic and Metabolomic Data Analysis. Methods Enzymol 2017;585:135-58. 10.1016/bs.mie.2016.09.016 [DOI] [PubMed] [Google Scholar]
- 17.Maffei VJ, Kim S, Blanchard Et, et al. Biological Aging and the Human Gut Microbiota. J Gerontol A Biol Sci Med Sci 2017;72:1474-82. 10.1093/gerona/glx042 [DOI] [PMC free article] [PubMed] [Google Scholar]
- 18.Langfelder P, Horvath S. WGCNA: an R package for weighted correlation network analysis. BMC Bioinformatics 2008;9:559. 10.1186/1471-2105-9-559 [DOI] [PMC free article] [PubMed] [Google Scholar]
- 19.Huang da W , Sherman BT, Lempicki RA. Systematic and integrative analysis of large gene lists using DAVID bioinformatics resources. Nat Protoc 2009;4:44-57. 10.1038/nprot.2008.211 [DOI] [PubMed] [Google Scholar]
- 20.Jensen MD, Ryan DH, Apovian CM, et al. 2013 AHA/ACC/TOS guideline for the management of overweight and obesity in adults: a report of the American College of Cardiology/American Heart Association Task Force on Practice Guidelines and The Obesity Society. J Am Coll Cardiol 2014;63:2985-3023. 10.1016/j.jacc.2013.11.004 [DOI] [PubMed] [Google Scholar]
- 21.Lehman SJ, Massaro JM, Schlett CL, et al. Peri-aortic fat, cardiovascular disease risk factors, and aortic calcification: the Framingham Heart Study. Atherosclerosis 2010;210:656-61. 10.1016/j.atherosclerosis.2010.01.007 [DOI] [PMC free article] [PubMed] [Google Scholar]
- 22.Lenk GM, Tromp G, Weinsheimer S, et al. Whole genome expression profiling reveals a significant role for immune function in human abdominal aortic aneurysms. BMC Genomics 2007;8:237. 10.1186/1471-2164-8-237 [DOI] [PMC free article] [PubMed] [Google Scholar]
- 23.Rush C, Nyara M, Moxon JV, et al. Whole genome expression analysis within the angiotensin II-apolipoprotein E deficient mouse model of abdominal aortic aneurysm. BMC Genomics 2009;10:298. 10.1186/1471-2164-10-298 [DOI] [PMC free article] [PubMed] [Google Scholar]
- 24.Spin JM, Hsu M, Azuma J, et al. Transcriptional profiling and network analysis of the murine angiotensin II-induced abdominal aortic aneurysm. Physiol Genomics 2011;43:993-1003. 10.1152/physiolgenomics.00044.2011 [DOI] [PMC free article] [PubMed] [Google Scholar]
- 25.Furusho A, Aoki H, Ohno-Urabe S, et al. Involvement of B Cells, Immunoglobulins, and Syk in the Pathogenesis of Abdominal Aortic Aneurysm. J Am Heart Assoc 2018;7:e007750. 10.1161/JAHA.117.007750 [DOI] [PMC free article] [PubMed] [Google Scholar]
- 26.Meng X, Yang J, Dong M, et al. Regulatory T cells in cardiovascular diseases. Nat Rev Cardiol 2016;13:167-79. 10.1038/nrcardio.2015.169 [DOI] [PubMed] [Google Scholar]
- 27.Biros E, Moran CS, Rush CM, et al. Differential gene expression in the proximal neck of human abdominal aortic aneurysm. Atherosclerosis 2014;233:211-8. 10.1016/j.atherosclerosis.2013.12.017 [DOI] [PubMed] [Google Scholar]
- 28.Blomkalns AL, Gavrila D, Thomas M, et al. CD14 directs adventitial macrophage precursor recruitment: role in early abdominal aortic aneurysm formation. J Am Heart Assoc 2013;2:e000065. 10.1161/JAHA.112.000065 [DOI] [PMC free article] [PubMed] [Google Scholar]
- 29.Chatterjee TK, Stoll LL, Denning GM, et al. Proinflammatory phenotype of perivascular adipocytes: influence of high-fat feeding. Circ Res 2009;104:541-9. 10.1161/CIRCRESAHA.108.182998 [DOI] [PMC free article] [PubMed] [Google Scholar]
- 30.Li MW, Mian MO, Barhoumi T, et al. Endothelin-1 overexpression exacerbates atherosclerosis and induces aortic aneurysms in apolipoprotein E knockout mice. Arterioscler Thromb Vasc Biol 2013;33:2306-15. 10.1161/ATVBAHA.113.302028 [DOI] [PubMed] [Google Scholar]
- 31.Folkesson M, Vorkapic E, Gulbins E, et al. Inflammatory cells, ceramides, and expression of proteases in perivascular adipose tissue adjacent to human abdominal aortic aneurysms. J Vasc Surg 2017;65:1171-9.e1. 10.1016/j.jvs.2015.12.056 [DOI] [PubMed] [Google Scholar]
- 32.Liu CL, Ren J, Wang Y, et al. Adipocytes promote interleukin-18 binding to its receptors during abdominal aortic aneurysm formation in mice. Eur Heart J 2020;41:2456-68. 10.1093/eurheartj/ehz856 [DOI] [PMC free article] [PubMed] [Google Scholar]
- 33.Sakaue T, Suzuki J, Hamaguchi M, et al. Perivascular Adipose Tissue Angiotensin II Type 1 Receptor Promotes Vascular Inflammation and Aneurysm Formation. Hypertension 2017;70:780-9. 10.1161/HYPERTENSIONAHA.117.09512 [DOI] [PubMed] [Google Scholar]
- 34.Zhang ZB, Ruan CC, Lin JR, et al. Perivascular Adipose Tissue-Derived PDGF-D Contributes to Aortic Aneurysm Formation During Obesity. Diabetes 2018;67:1549-60. 10.2337/db18-0098 [DOI] [PubMed] [Google Scholar]
- 35.Sun Y, Li J, Xiao N, et al. Pharmacological activation of AMPK ameliorates perivascular adipose/endothelial dysfunction in a manner interdependent on AMPK and SIRT1. Pharmacol Res 2014;89:19-28. 10.1016/j.phrs.2014.07.006 [DOI] [PubMed] [Google Scholar]
- 36.Chen Y, Xu X, Zhang Y, et al. Diosgenin regulates adipokine expression in perivascular adipose tissue and ameliorates endothelial dysfunction via regulation of AMPK. J Steroid Biochem Mol Biol 2016;155:155-65. 10.1016/j.jsbmb.2015.07.005 [DOI] [PubMed] [Google Scholar]
- 37.Skiba DS, Nosalski R, Mikolajczyk TP, et al. Anti-atherosclerotic effect of the angiotensin 1-7 mimetic AVE0991 is mediated by inhibition of perivascular and plaque inflammation in early atherosclerosis. Br J Pharmacol 2017;174:4055-69. 10.1111/bph.13685 [DOI] [PMC free article] [PubMed] [Google Scholar]
- 38.Mikolajczyk TP, Nosalski R, Skiba DS, et al. 1,2,3,4,6-Penta-O-galloyl-β-d-glucose modulates perivascular inflammation and prevents vascular dysfunction in angiotensin II-induced hypertension. Br J Pharmacol 2019;176:1951-65. 10.1111/bph.14583 [DOI] [PMC free article] [PubMed] [Google Scholar]
- 39.Chew DK, Conte MS, Khalil RA. Matrix metalloproteinase-specific inhibition of Ca2+ entry mechanisms of vascular contraction. J Vasc Surg 2004;40:1001-10. 10.1016/j.jvs.2004.08.035 [DOI] [PubMed] [Google Scholar]
- 40.Chew DK, Orshal JM, Khalil RA. Elastase-induced suppression of endothelin-mediated Ca2+ entry mechanisms of vascular contraction. Hypertension 2003;42:818-24. 10.1161/01.HYP.0000086200.93184.8E [DOI] [PubMed] [Google Scholar]
- 41.Chew DK, Orshal JM, Khalil RA. Elastase promotes aortic dilation by inhibiting Ca2+ influx into vascular smooth muscle. J Cardiovasc Pharmacol 2004;43:504-13. 10.1097/00005344-200404000-00005 [DOI] [PubMed] [Google Scholar]
- 42.Chen S, Yang D, Lei C, et al. Identification of crucial genes in abdominal aortic aneurysm by WGCNA. PeerJ 2019;7:e7873. 10.7717/peerj.7873 [DOI] [PMC free article] [PubMed] [Google Scholar]
- 43.Negri L, Lattanzi R, Giannini E, et al. Bv8/Prokineticin proteins and their receptors. Life Sci 2007;81:1103-16. 10.1016/j.lfs.2007.08.011 [DOI] [PubMed] [Google Scholar]
- 44.Giannini E, Lattanzi R, Nicotra A, et al. The chemokine Bv8/prokineticin 2 is up-regulated in inflammatory granulocytes and modulates inflammatory pain. Proc Natl Acad Sci U S A 2009;106:14646-51. 10.1073/pnas.0903720106 [DOI] [PMC free article] [PubMed] [Google Scholar]
- 45.He X, Shen C, Lu Q, et al. Prokineticin 2 Plays a Pivotal Role in Psoriasis. EBioMedicine 2016;13:248-61. 10.1016/j.ebiom.2016.10.022 [DOI] [PMC free article] [PubMed] [Google Scholar]
- 46.Li Y, Su Y, Zhou T, et al. Activation of the NLRP3 Inflammasome Pathway by Prokineticin 2 in Testicular Macrophages of Uropathogenic Escherichia coli- Induced Orchitis. Front Immunol 2019;10:1872. 10.3389/fimmu.2019.01872 [DOI] [PMC free article] [PubMed] [Google Scholar]
- 47.Choke E, Cockerill GW, Laing K, et al. Whole genome-expression profiling reveals a role for immune and inflammatory response in abdominal aortic aneurysm rupture. Eur J Vasc Endovasc Surg 2009;37:305-10. 10.1016/j.ejvs.2008.11.017 [DOI] [PubMed] [Google Scholar]
- 48.Chuang HC, Wang X, Tan TH. MAP4K Family Kinases in Immunity and Inflammation. Adv Immunol 2016;129:277-314. 10.1016/bs.ai.2015.09.006 [DOI] [PubMed] [Google Scholar]
- 49.Alzabin S, Bhardwaj N, Kiefer F, et al. Hematopoietic progenitor kinase 1 is a negative regulator of dendritic cell activation. J Immunol 2009;182:6187-94. 10.4049/jimmunol.0802631 [DOI] [PubMed] [Google Scholar]
- 50.Shui JW, Boomer JS, Han J, et al. Hematopoietic progenitor kinase 1 negatively regulates T cell receptor signaling and T cell-mediated immune responses. Nat Immunol 2007;8:84-91. 10.1038/ni1416 [DOI] [PubMed] [Google Scholar]
- 51.Castellino FJ, Ploplis VA. Structure and function of the plasminogen/plasmin system. Thromb Haemost 2005;93:647-54. 10.1160/TH04-12-0842 [DOI] [PubMed] [Google Scholar]
- 52.Carmeliet P, Moons L, Lijnen R, et al. Urokinase-generated plasmin activates matrix metalloproteinases during aneurysm formation. Nat Genet 1997;17:439-44. 10.1038/ng1297-439 [DOI] [PubMed] [Google Scholar]
- 53.Qian HS, Gu JM, Liu P, et al. Overexpression of PAI-1 prevents the development of abdominal aortic aneurysm in mice. Gene Ther 2008;15:224-32. 10.1038/sj.gt.3303069 [DOI] [PubMed] [Google Scholar]
- 54.Gschwandtner M, Derler R, Midwood KS. More Than Just Attractive: How CCL2 Influences Myeloid Cell Behavior Beyond Chemotaxis. Front Immunol 2019;10:2759. 10.3389/fimmu.2019.02759 [DOI] [PMC free article] [PubMed] [Google Scholar]
- 55.Najem MY, Couturaud F, Lemarie CA. Cytokine and chemokine regulation of venous thromboembolism. J Thromb Haemost 2020;18:1009-19. 10.1111/jth.14759 [DOI] [PubMed] [Google Scholar]
- 56.Da Ros F, Carnevale R, Cifelli G, et al. Targeting Interleukin-1beta Protects from Aortic Aneurysms Induced by Disrupted Transforming Growth Factor beta Signaling. Immunity 2017;47:959-73.e9. 10.1016/j.immuni.2017.10.016 [DOI] [PubMed] [Google Scholar]
Associated Data
This section collects any data citations, data availability statements, or supplementary materials included in this article.
Supplementary Materials
The article’s supplementary files as


