Abstract
Background
To determine the clinical value of hepatobiliary phase (HBP) hypointensity for noninvasive diagnosis of hepatocellular carcinoma (HCC).
Methods
A total of 246 high-risk patients with 263 selected nodules (126 HCCs, 137 non-HCCs) undergoing gadobenate dimeglumine (Gd-BOPTA)-enhanced magnetic resonance imaging (MRI) were included in the study. Imaging-based diagnoses of small (≤3 cm) and large (>3 cm) HCCs were made using the following 4 criteria: (I) non-rim arterial phase hyper-enhancement (APHE) plus hypointensity on the portal venous phase (PVP); (II) non-rim APHE plus hypointensity on the PVP and/or transitional phase (TP); (III) non-rim APHE plus hypointensity on the PVP and/or TP and/or HBP; (IV) criterion 3 plus non-LR-1/2/M. Based on typical imaging features, LR-1, LR-2, or LR-M (if definitely benign, probably benign, malignant but not HCC specific, respectively) were defined according to the Liver Imaging Reporting and Data System (LI-RADS). Sensitivities and specificities of imaging criteria were calculated and compared using McNemar’s test.
Results
Among the diagnostic criteria for small HCCs, criterion 3 and 4, which included HBP hypointensity, showed significantly higher sensitivities (96.4% and 94.6%, respectively) than criterion 1 (58.9%, P<0.001 for both). Moreover, criterion 4, which included HBP hypointensity and ancillary features, showed significantly higher specificity (94.7%) than criterion 3 (66.7%, P<0.001) and comparable specificity to criterion 1 (97.4%, P=0.375), achieving the highest accuracies (94.7%). The diagnostic performance of criterion 4 for large HCCs was similar to that for small HCCs.
Conclusions
HBP hypointensity acquired from Gd-BOPTA-MRI can improve sensitivity and maintain high specificity in the diagnosis of both small and large HCCs after excluding benignities or non-HCC malignancies according to characteristic imaging features.
Keywords: Hepatocellular carcinoma (HCC), magnetic resonance imaging (MRI), hepatobiliary phase (HBP), gadobenate dimeglumine
Introduction
Liver cancer, with hepatocellular carcinoma (HCC) constituting 75–85% of its total incidence, was predicted to be the sixth most commonly diagnosed cancer and the fourth leading cause of cancer death worldwide in 2018, with about 841,000 new cases and 782,000 deaths annually (1). Unlike most solid cancers, HCC can be diagnosed and treated based solely on noninvasive imaging without biopsy confirmation using arterial phase hyperenhancement (APHE) and washout on the portal venous phase (PVP) or delayed phase (2,3). Recently, several meta-analyses have suggested that dynamic contrast-enhanced magnetic resonance imaging (MRI) may be more sensitive than dynamic contrast-enhanced computed tomography (CT) for HCC diagnosis (4-7). Furthermore, 2 meta-analyses have found that MRI paired with hepatobiliary contrast agents to be of higher sensitivity than when paired with extracellular agents, particularly in small HCCs (6,8). In contrast to conventional extracellular contrast agent, a hepatobiliary contrast agent is selectively taken up by functioning hepatocytes through specific organic anion transporting polypeptide (OATP) transporters located on the hepatocyte surface, allowing the acquisition of hepatobiliary phase (HBP) images (9-11).
As most HCCs (80–90%) demonstrate hypointensity in the HBP, this feature may contribute to the differentiation of HCC from benign hepatic nodules developed in chronic liver diseases (12,13). However, until now, there has been no established consensus regarding the value of HBP hypointensity during liver MRI. In East Asia, to achieve early detection of HCC, some guidelines attach importance to the use of HBP hypointensity, even as an alternative to the washout appearance of HCCs (14-16). Meanwhile, in the West, where transplantation is the major curative treatment for HCC developing in the cirrhotic liver, the practice guidelines suggest that washout should be determined on the PVP in hepatobiliary-contrast-enhanced MRI, rather than on the transitional phase (TP) or HBP, so as to obtain the highest specificity (17,18).
In fact, prior studies have suggested that HBP hypointensity is highly sensitive and specific for HCC when combining with non-rim APHE (19-21). In particular, Joo and Kim et al. showed that HBP hypointensity acquired from gadoxetic acid (Gd-EOB-DTPA)-enhanced MRI was an effective alternative to washout after exclusion of nodules suggestive of benignity or non-HCC malignancy according to characteristic imaging features, like hemangioma and intrahepatic cholangiocarcinoma. This procedure enabled a highly sensitive diagnosis with little loss in specificity for HCC (22,23). In these studies, however, 2 reference standards might have led to incorporation bias, especially for malignant lesions confirmed by imaging features. Moreover, whether HBP hypointensity on MRI using another hepatobiliary contrast agent like gadobenate dimeglumine (Gd-BOPTA) is helpful for small and/or large HCC diagnoses remains unknown. Thus, as an extension to Joo and Kim et al.’s study, we aimed to investigate the diagnostic performance of HBP hypointensity for the detection of small and large HCCs by using a more strict inclusion criteria in which all malignancies were confirmed pathologically.
Methods
Study participants
This single-center retrospective cohort study was approved by the Institutional Review Board, who determined the requirement for informed consent could be waived. Between January 2016 and January 2018, the research team searched the radiologic diagnoses of MRI scans with keywords “lesion”, “nodular”, “mass”, “tumor”, or “carcinoma” of “liver”, which, according to our abdominal radiologists, are all the most frequently used words in the reports on hepatic lesions found on the local picture archiving and communication system (PACS). In total, 6,031 abdominal gadobenate Gd-BOPTA)-enhanced MRI scans were extracted.
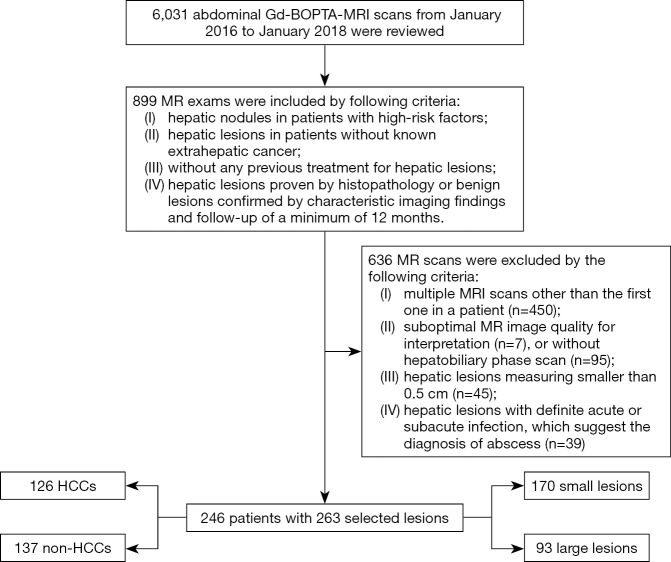
The electronic medical records and MR images were reviewed by 1 radiologist with 3 years of experience in the interpretation of abdominal MRI. In sum, 899 MR exams satisfied the following criteria: (I) hepatic nodules in patients with high-risk factors, namely histopathological or clinical diagnosis of liver cirrhosis or chronic hepatitis B viral infection according to the Liver Imaging Reporting and Data System (LI-RADS) 2018 (18); (II) hepatic lesions in patients without known extrahepatic cancer; (III) without any previous treatment for hepatic lesions, such as surgery, trans-arterial chemoembolization (TACE), or radiofrequency ablation; (IV) hepatic lesions confirmed by histopathology or benign lesions confirmed by characteristic imaging and follow-up of a minimum of 12 months. Subsequently, 636 MRI scans were gradually excluded due to the following criteria: (I) multiple MRI scans were excluded in favor of the first scan in a patient, as some benign lesions might have been followed up by undergoing more than one MRI scan (n=450); (II) suboptimal MR image quality for interpretation (n=7), or without HBP scan (n=95); (III) hepatic lesions measuring smaller than 0.5 cm (n=45); (IV) hepatic lesions with definite acute or subacute infection, which suggest the diagnosis of abscess (n=39). To avoid data clustering, for patients with multiple lesions, the radiologist selected the largest one if hepatic lesions had similar diagnoses. Finally, a total of 246 consecutive patients with 263 qualifying lesions comprising 170 small lesions and 93 large lesions were included for image analysis (Figure 1).
Figure 1.
Flowchart of inclusion and exclusion criteria for patients. HCC, hepatocellular carcinoma.
Reference standard
Of the 263 qualifying lesions, 126 HCCs were all confirmed pathologically (17 cases by biopsy, 109 cases by surgery), and the remaining 137 lesions were determined to be non-HCCs. Of the 137 non-HCC lesions, 16 malignant lesions (4 cases by biopsy, 12 cases by surgery) were all confirmed by histopathology including combined hepatocellular and cholangiocarcinomas (cHCC-CCs) (n=2), intrahepatic cholangiocarcinomas (ICCs) (n=10), metastases (n=2), and neuroendocrine neoplasms (n=2), while 121 non-HCC benign lesions were confirmed by histopathology (n=17) or by characteristic imaging findings and follow-up of a minimum of 12 months (n=104) (Table 1). After measuring the largest outer-edge-to-outer-edge dimension of the lesions, the radiologist divided them into small (≤3 cm) and large (>3 cm) lesions groups.
Table 1. Lesion confirmation of non-HCC benign lesions.
| Non-HCC benign lesions | Confirmed by imaging and follow-up | Number of lesions |
|---|---|---|
| Hemangioma | Classic enhancement pattern on dynamic contrast-enhanced MRI, peripheral nodular enhancement in AP followed by progressive centripetal filling in the delay phase, and marked hyperintensity on T2-weighted MR imaging, without interval change during follow-up | 35 |
| APS | Isointensity on dynamic MRI other than AP images, isointensity on the HBP, and no change or a decrease in size during follow-up | 28 |
| FNH or FNH-like nodules | APHE plus iso- or hypersignal intensity during the portal-venous phase, at least partial hyperintensity compared to the liver parenchyma in the hepatobiliary phase, and no interval change | 9 |
| RN-DN | Hyperintensity on T1-weighted imaging and isointensity or hypointensity on T2-weighted imaging, isointensity in AP image or APHE without discernible “washout”, and no interval change during follow-up | 32 |
HCC, hepatocellular carcinoma; AP, arterial phase; APS, arterioportal shunt; FNH, focal nodular hyperplasia; RN, regenerative nodule; DN, dysplastic nodule; AP, arterial phase; APHE, arterial phase hyperenhancement; HBP, hepatobiliary phase.
Image acquisition
MR images were acquired by the 3.0T MR imaging system (Magnetom Verio; Siemens Healthcare, Erlangen, Germany) equipped with an 8-channel body phased-array coil. The routine MR sequences included a breath-hold in- and opposed-phase T1-weighted gradient-echo sequence, a respiratory-triggered T2-weighted fat-saturated turbo spin echo sequence, and diffusion-weighted imaging (DWI) performed with respiratory triggering by using a single-shot echoplanar imaging sequence (b values of 50 and 800 sec/mm2). Dynamic MR images were acquired before and after contrast agent administration. A weight-based dose of 0.1mmol/kg of gadobenate dimeglumine (Multihance, Bracco Imaging S.p.A) was intravenously administered by a using power injector at 2 mL/s, and subsequently followed by a 20-mL saline flush. Dynamic images, including unenhanced, arterial phase (AP) (20–25 seconds), PVP (60–70 seconds), TP (2 minutes), and delayed HBP (80–100 minutes), were obtained using a T1-weighted three-dimensional volumetric interpolated breath-hold sequences with the same parameters.
Imaging analysis
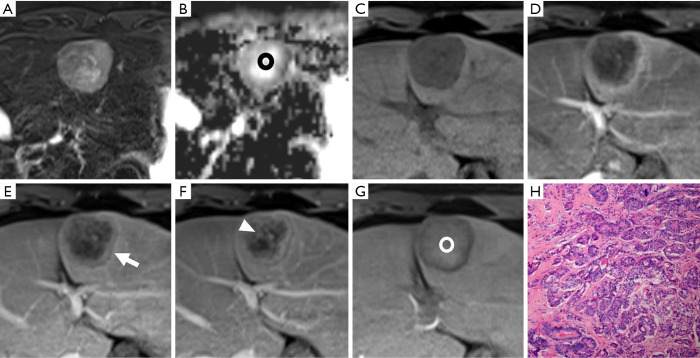
All MR images were reviewed independently by another 2 experienced abdominal radiologists (with 30 and 4 years of experience in the interpretation of liver MRI) who were blinded to the clinical data and the final diagnosis of the lesions. For each target lesion, each radiologist evaluated the following parameters in both the small and large hepatic lesion groups: (I) non-rim APHE, referring to signal intensity (SI) of whole or partial lesions, was unequivocally greater than the surrounding liver parenchyma with non-rim appearance in the AP; (II) for non-rim APHE nodules, hypointensity on the PVP, TP, and HBP was qualitatively defined when any part of the nodule showing arterial hyper-enhancement presented a corresponding hypointense area relative to the surrounding liver; (III) the largest outer-edge-to-outer-edge dimension of an observation was measured in a clearly visible phase and appropriate plane; (IV) lesions of typical imaging features suggesting benignity were designated as LR-1 or LR-2 according to LI-RADS (18,24,25), whereas LR-M was determined if the lesion exhibited any of rim APHE, peripheral “washout”, delayed central enhancement, targetoid TP or HBP appearance, or targetoid restriction, which indicated non-HCC malignancy (Figure 2).
Figure 2.
A histopathologically confirmed intrahepatic cholangiocarcinoma (ICC) in a 44-year-old male patient. A hepatic lesion located in the left lobe of the liver shows mild-to-moderate hyperintensity on T2-weighted imaging and targetoid restriction (black ring) on an apparent diffusion coefficient (ADC) map (A,B). On pre- (C) and post-contrast (D,E,F,G) enhanced images, the nodule demonstrates rim arterial phase hyper-enhancement (D), peripheral “washout” on portal venous phase (arrow), delayed central enhancement (triangle) on transitional phase, and targetoid HBP appearance (white ring). The pathological result (H) is poorly differentiated intrahepatic cholangiocarcinoma (magnification, 10×20).
In addition to the results of image review, the 2 radiologists applied 4 different imaging criteria for HCC diagnosis which were as follows: (I) non-rim APHE plus hypointensity on PVP; (II) non-rim APHE plus hypointensity on PVP and/or TP; (III) non-rim APHE plus hypointensity on PVP and/or TP and/or HBP; (IV) non-rim APHE, hypointensity on PVP and/or TP and/or HBP plus non-LR-1/2/M. When any interobserver disagreement arose, the reviewers reevaluated the images together and reached a consensus.
Statistical analysis
The degree of agreement between the two reviewers was assessed by using Cohen k statistics as follows: excellent (k=0.81–1.0), good (k=0.61–0.80), moderate (k=0.41–0.60), fair (k=0.21–0.40), and poor (k=0–0.20). Sensitivity, specificity, and accuracy were calculated for each imaging diagnostic criterion of HCC in small and large lesions group, respectively. Thereafter, sensitivities and specificities of the imaging criteria were compared each other using McNemar’s test. The diagnostic performance of each criterion was also compared by using ROC analysis. Statistical analyses were performed using SPSS software version 25.0. A P value of less than 0.05 was considered to indicate statistical significance.
Results
Patient characteristics
A total of 263 nodules composed of 126 HCCs (mean size, 5.3 cm; range, 0.8–21.1 cm) and 137 non-HCCs (mean size, 2.0 cm; range, 0.5-17.2 cm) were found in 246 patients. The clinical characteristics of the 246 patients are summarized in Table 2. There were 202 males (82.1%) and 44 females (17.9%), with a mean age of 50.0 years (range, 20–83 years). Hepatitis B was the predominant risk factor (n=232, 94.3%), followed by alcoholism (n=6, 2.5%). Elevated serum alpha-fetoprotein (>20 ng/mL) was found in 76 patients. There were 56 HCCs (mean size, 2.0±0.57 cm) and 114 non-HCCs (mean size, 1.2±0.61 cm) in the small hepatic lesion group, while 70 HCCs (mean size, 7.9±4.15 cm) and 23 non-HCCs (mean size, 6.2±3.2 cm) were found in the large lesion group.
Table 2. Clinical characteristics.
| Variables | Total (n=246) |
|---|---|
| Mean age (y) | 50.0±11.6 |
| Sex, n (%) | |
| Male | 202 (82.1) |
| Female | 44 (17.9) |
| Risk factors, n (%) | |
| Hepatitis B | 232 (94.3) |
| Hepatitis C | 4 (1.6) |
| Alcoholism | 6 (2.5) |
| Cryptogenic cirrhosis | 4 (1.6) |
| AFP level (ng/mL) | |
| >20 | 76 (30.9) |
| ≤20 | 170 (69.1) |
| Number of nodules, n (%) | |
| 1 | 231 (93.9) |
| 2 | 13 (5.3) |
| 3 | 2 (0.8) |
| Mean size of nodules (cm) | |
| HCC | 5.3 |
| Non-HCC | 2.0 |
Data are mean ± standard deviation or number (percentage). AFP, alpha-fetoprotein; HCC, hepatocellular carcinoma.
Diagnostic performance of imaging criteria for small hepatic lesions
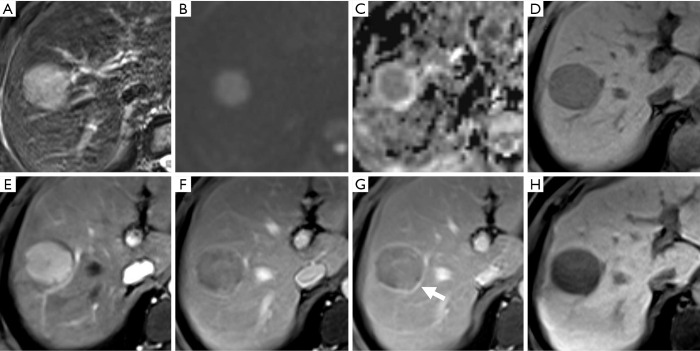
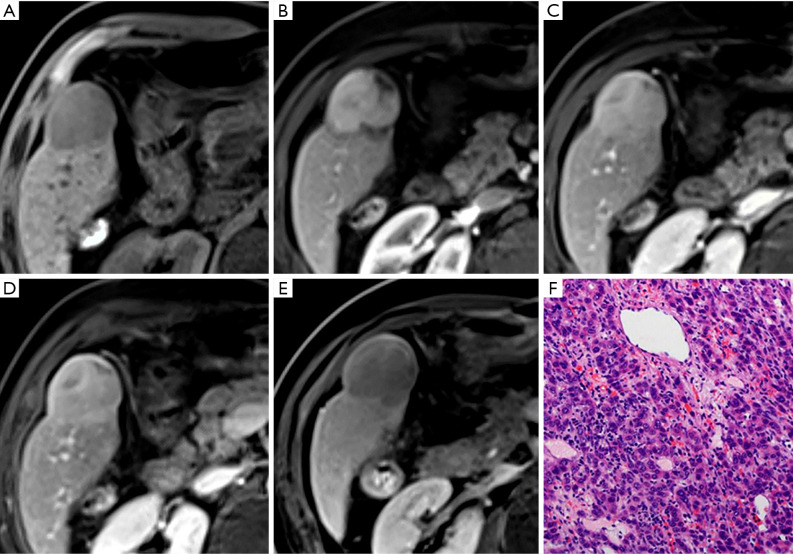
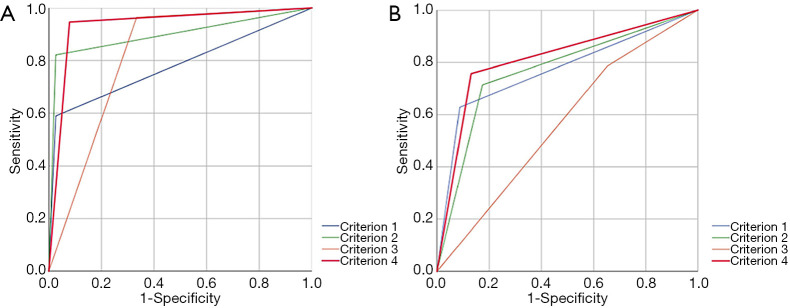
Interobserver agreement was good to excellent for all imaging features (k=0.611–0.852), especially for criterion 1 (k=0.852) of small hepatic lesions. The sensitivity, specificity, and accuracy of each imaging criterion for small lesions were calculated and are listed in Table 3. Of the 114 non-HCCs, only 3 lesions showed non-rim APHE and hypointensity on PVP (criterion 1), including 1 cHCC-CC and 2 dysplastic nodules (DN). Most nodules (33/36) which met criterion 1 were HCCs (Figure 3). Thus, imaging criterion 1 provided the highest specificity (97.4%) but the lowest sensitivity (58.9%). Although most small HCCs (55/56) showed non-rim APHE, 22 of them showed no “washout” in PVP, and 9 HCCs showed hyper or isointensity in TP, while these lesions all showed HBP hypointensity expect for 1 HCC (Figure 4). Therefore, non-rim APHE plus hypointensity on PVP and/or TP and/or HBP (criterion 3) showed significantly higher sensitivity (96.4%) than criterion 2 (non-rim APHE plus hypointensity on PVP and/or TP) (82.1%, P=0.008) and criterion 1 (P<0.001), but had lower specificity (66.4%) than both criterion 1 (P<0.001) and criterion 2 (97.4%, P<0.001). As many hemangiomas and ICCs can demonstrate HBP hypointensity, after excluding classical hallmarks of hemangioma/ICC designated as LR-1, LR-2, or LR-M, criterion 4 (non-rim APHE plus hypointensity on PVP and/or TP and/or HBP plus non-LR-1/2/M) showed significantly higher specificity (94.7%) than criterion 3 (P<0.001) and comparable specificity to criterion 1 (P=0.375), achieving the highest accuracies (94.7%). Figure 5 presents the receiver operating characteristic (ROC) curves of the 4 imaging criteria. In the diagnosis of small HCC, criterion 4 showed excellent discriminative power with area under curve (AUC) of 0.934, with criteria 1–3 demonstrating AUCs of 0.781, 0.898, and 0.815, respectively.
Table 3. Diagnostic performance of different imaging criteria of small hepatocellular carcinoma.
| Imaging criteria | Sensitivity | Specificity | Accuracy (%) | |||||||
|---|---|---|---|---|---|---|---|---|---|---|
| Value (%) | P1 | P2 | P3 | Value (%) | P1 | P2 | P3 | |||
| Non-rim APHE + hypointensity on PVP | 58.9 (33/56) | – | – | – | 97.4 (111/114) | – | – | – | 84.7 (144/170) | |
| Non-rim APHE + hypointensity on PVP and/or TP | 82.1 (46/56) | <0.001 | – | – | 97.4 (111/114) | >0.999 | – | – | 92.4 (157/170) | |
| Non-rim APHE + hypointensity on PVP and/or TP and/or HBP | 96.4 (54/56) | <0.001 | 0.008 | – | 66.7 (76/114) | <0.001 | <0.001 | – | 76.5 (130/170) | |
| Non-rim APHE + hypointensity on PVP and/or TP and/or HBP + non-LR-1/2/M | 94.6 (53/56) | <0.001 | 0.016 | >0.999 | 94.7 (108/114) | 0.375 | 0.375 | <0.001 | 94.7 (161/170) | |
Percentages were calculated according to the numbers in parentheses. P1, P2, and P3 values mean the comparison of sensitivity or specificity between criteria 1, 2, 3, and other criteria, respectively. APHE, arterial phase hyperenhancement; PVP, portal venous phase; TP, transitional phase; HBP, hepatobiliary phase. LR-1/2/M was designated in accordance to LI-RASD 2018.
Figure 3.
A moderately differentiated hepatocellular carcinoma (HCC) in a 42-year-old male patient with chronic hepatitis B. There is a well-defined nodule showing mild-moderate hyperintensity on T2-weighted imaging and hyperintensity on diffusion-weighted imaging with corresponding hypointensity on the apparent diffusion coefficient (ADC) map (A,B,C). On non-enhanced (D) and contrast-enhanced images, the lesion shows non-rim arterial phase hyper-enhancement (E) and hypointensity relative to the liver parenchyma in the portal venous phase (F), which met criterion 1 and can be correctly diagnosed as an HCC. On the subsequent transitional phase and hepatobiliary phase images (G,H), the nodular lesion shows hypointensity with “enhancing capsule” (arrow) and also satisfies the other imaging criteria.
Figure 4.
A nodule located in hepatic segment V shows hypointensity on non-enhanced T1-weighted imaging (A), arterial phase hyper-enhancement (B) and persistent enhancement in the portal venous phase (C) and transitional phase (D). However, about 90 minutes after contrast administration, this lesion shows hypointensity in the hepatobiliary phase (E). The appearance of this lesion does not meet criteria 1 and 2 but does meet criteria 3 and 4. The histologic result is a moderately differentiated hepatocellular carcinoma (magnification, 10×20) (F) in a 51-year-old male.
Figure 5.
The receiver operating characteristic (ROC) curve and area under the curve (AUC) of 4 imaging criteria: (A) for diagnosis of small hepatocellular carcinomas (HCCs); (B) for diagnosis of large HCCs.
Diagnostic performance of imaging criteria for large hepatic lesions
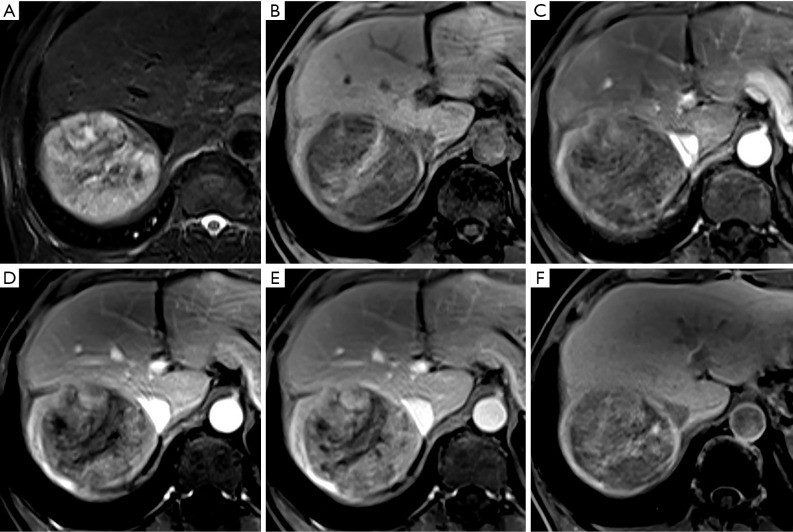
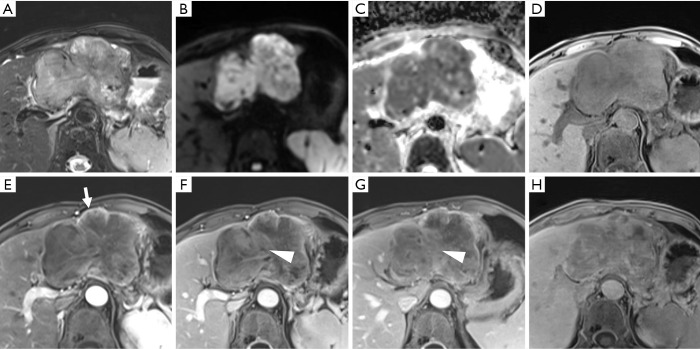
The result of interobserver agreement was good to excellent for all imaging features (k=0.702–0.899), especially for criterion 1 (k=0.899) of the large hepatic lesions group. A portion of large HCCs (15/70) showed hypointensity in the AP (non-APHE) in this group (Figure 6). Eight HCCs were determined as LR-M according to their imaging characteristics (Figure 7). As shown in Table 4, using criterion 1 (non-rim APHE and “washout” on PVP) for large HCC diagnosis led to the lowest sensitivity (62.9%, 44/70). All large HCCs demonstrated hypointensity in the HBP. Criterion 3 and 4, which included HBP hypointensity, presented significantly higher sensitivities (78.6% and 75.7%, respectively) than criterion 1. In comparison to criterion 3 (34.8%), criterion 4 (91.3%), including HBP hypointensity and non-LR-1/2/M, demonstrated significantly higher specificity (P<0.001). Of particular note, the specificity of criterion 4 was the same as criterion 1 (91.3%, P>0.999). Criterion 4 also showed the highest accuracy among these imaging criteria (79.6%). As shown in Figure 5, for diagnosis of large HCC, criterion 4 presented the best diagnostic performance with AUC of 0.813, followed by criteria 1–3 with AUCs of 0.771, 0.770, and 0.567, respectively. The results above were similar to those of the small lesion group.
Figure 6.
A moderately differentiated hepatocellular carcinoma (HCC) in a 66-year-old male patient with chronic hepatitis B. A mass showing moderate hyperintensity on T2-weighted imaging (A), and hypointensity in the arterial phase (C) [non-arterial phase hyper-enhancement (APHE)] is seen in the right lobe of the liver. This lesion also shows heterogeneous hypointensity relative to the liver parenchyma in pre-contrast image (B), the portal venous phase (D), transitional phase (E), and hepatobiliary phase (F) images. Criteria 1–4, which include APHE, will lead to a missed diagnosis of HCC.
Figure 7.
A histopathologically confirmed poorly differentiated hepatocellular carcinoma in a 71-year-old male patient with chronic hepatitis B. A mass in left lobe of the liver shows mild-to-moderate T2 hyperintensity (A), restricted diffusion (B,C), hypointensity on pre-contrast image (D), rim arterial phase hyperenhancement (E) (arrow), delayed central enhancement (F,G) (triangle), and hepatobiliary phase hypointensity (H). These imaging features would lead to incorrect designation as LR-M, suggesting intrahepatic cholangiocarcinoma.
Table 4. Diagnostic performance of different imaging criteria of large hepatocellular carcinoma.
| Imaging criteria | Sensitivity | Specificity | Accuracy (%) | |||||||
|---|---|---|---|---|---|---|---|---|---|---|
| Value (%) | P1 | P2 | P3 | Value (%) | P1 | P2 | P3 | |||
| Non-rim APHE + hypointensity on PVP | 62.9 (44/70) | – | – | – | 91.3 (21/23) | – | – | – | 69.7 (65/93) | |
| Non-rim APHE + hypointensity on PVP and/or TP | 71.4 (50/70) | 0.031 | – | – | 82.6 (19/23) | 0.500 | – | – | 74.2 (69/93) | |
| Non-rim APHE + hypointensity on PVP and/or TP and/or HBP | 78.6 (55/70) | 0.001 | 0.063 | – | 34.8 (8/23) | <0.001 | 0.001 | – | 67.7 (63/93) | |
| Non-rim APHE + hypointensity on PVP and/or TP and/or HBP + non-LR-1/2/M | 75.7 (53/70) | 0.004 | 0.250 | 0.500 | 91.3 (21/23) | >0.999 | 0.500 | <0.001 | 79.6 (74/93) | |
Percentages were calculated according to numbers in parentheses. P1, P2, and P3 values mean the comparison of sensitivity or specificity between criteria 1, 2, 3, and other criteria, respectively. APHE, arterial phase hyperenhancement; PVP, portal venous phase; TP, transitional phase; HBP, hepatobiliary phase. LR-1/2/M was designated in accordance to LI-RASD 2018.
Discussion
This study analyzed the diagnostic performance of different imaging criteria for small and large HCCs, with the results being similar between the small and large hepatic lesion groups. Non-rim APHE and “washout” in PVP (criterion 1) have been suggested as a non-invasive diagnostic criteria of HCC due to their high specificity (2,3,17). In this study, criterion 1 provided the highest specificity at 97.4% of small HCCs and 91.3% of large HCCs, but had the lowest sensitivity. Criteria that included HBP hypointensity (criterion 3 and 4) were shown to provide a significantly higher sensitivity than those criteria that did not. Other studies have similarly reported that HBP hypointensity exhibits high sensitivity in the diagnosis of HCC (6,8,26), though our results showed more moderately high sensitivity (78.6%) for criterion 3 (non-rim APHE plus hypointensity on PVP and/or TP and/or HBP) in the large lesion group, which might have been caused by a relatively large number of non-APHE HCCs (15/70).
In the literature, the specificities of HBP hypointensity in the diagnosis of HCC have been variable (20,27,28). Hemangioma, intrahepatic cholangiocarcinoma, and combined hepatocellular-cholangiocarcinoma, which may present HBP hypointensity, may lead to false-positive diagnoses solely on the basis of imaging criteria that include HBP hypointensity causing lower specificity. Therefore, criterion 4, which excluded observations of LR-1, LR-2, and LR-M, showed significantly higher specificity than criterion 3 and demonstrated comparable specificity to criterion 1 without significant difference. Our results were in line with recent studies (22,23).
In sum, HBP hypointensity plays a pivotal role in the diagnosis of both small and large HCC in high-risk patients. Compared with the traditional imaging criterion (AP hyperenhancement and washout on the PVP or delayed phase) (2,3), it can significantly improve the sensitivity of diagnosis with little loss in specificity for HCC. However, HBP hypointensity, which favors malignancy but not HCC in particular, is currently confined to being an ancillary feature in LI-RADS. A recent article has pointed out the pitfalls and problems of the LI-RADS that should be addressed (29), which include some ancillary features like HBP hypointensity factoring more prominently in the diagnosis of HCC. It is anticipated that HBP hypointensity may be elevated to being a major feature with the appropriate combination of complimentary features.
Diagnostic and management strategies for HCC vary geographically. In East Asia, where the incidence of HCC is the highest (1), early detection of HCC is crucial, and high sensitivity for HCC diagnosis is valued even at the cost of an “acceptable” decrease in specificity (30). The high sensitivity of HBP hypointensity should be considered for the diagnosis of HCC in these regions. The newly proposed Korea practice guidelines suggest that on multiphase MRI paired with a hepatobiliary contrast agent, washout can be considered present not only during the PVP or delayed phase, but also during the HBP (16). By comparison, in the West, where deceased donor liver transplantation is a major treatment option for HCC, high specificity for HCC diagnosis is of value to ensure appropriate organ allocation (31). For this reason, criterion 1, which provided the highest specificity but at an expense of low sensitivity, can be reasonably used in this region.
Prior studies reported that approximately 6–15% of HCCs demonstrate iso- or hyperintensity (“paradoxical uptake”) on the HBP (12,32-34). However, there were rare HCCs (1/126) that exhibited iso- or hyperintensity on HBP in the current study. This discordance may be attributed to different study cohorts and using different contrast agents. Though studies have worked on differentiation of intrahepatic cholangiocarcinoma from HCC (35,36), it was still difficult to achieve in some cases. In this study, 8 HCCs were erroneously determined as LR-M based on their imaging characteristics.
HBP was captured during gadobenate dimeglumine (Gd-BOPTA)-enhanced MRI in this study. Published reports on the use of Gd-BOPTA are much less common than those on the use of gadoxetic acid (Gd-EOB-DTPA). One reason may be that its HBP is late (1–2 hours) compared with that of Gd-EOB-DTPA, which requires a second MR scan. Another reason may be that approximately 50% of the dose of gadoxetic acid (Gd-EOB-DTPA) is taken up by the hepatocytes and excreted into the bile ducts, while about 5% of Gd-BOPTA is excreted in the biliary system, which may result in a relatively weak liver SI and biliary tree enhancement (37). In our institution, Gd-BOPTA is conventionally used and HBP is obtained by a second MR scan about 90 minutes after contrast agent administration. Although there are few publications comparing the 2 contrast agents (38,39), our study demonstrated the definitive power of HBP acquired from Gd-BOPTA in the diagnosis of HCC. According to the European Society of Gastrointestinal and Abdominal Radiology (ESGAR) consensus statement on liver-specific contrast agents (2016), there are no data indicating the diagnostic superiority of one agent over the other (40).
This study had other limitations which might have contributed to selection bias, including its retrospective and single-center nature and the possibility that patients with lesions that were missed by the initial interpreting radiologist were overlooked for this study. However, in our institution, liver MR exams were performed conventionally for high-risk patients or after detections of suspicious nodules during ultrasound surveillance; moreover, images were all interpreted by abdominal radiologists with 10 years of experience or more, which might have minimized the rate of missed diagnosis. Second, 2 different reference standards were used in this study, which might have led to misclassification bias. However, to prevent this, we used strict reference standards where all the selected malignant lesions were confirmed pathologically and partial benign lesions were determined by follow-up of a minimum of 12 months. Finally, we did not analyze non-APHE hepatic lesions that could have been seen in some large HCCs, as the optimal criterion may not suitable for all high-risk hepatic lesions in HCC diagnosis.
In conclusion, after excluding nodules considered to be benignities or non-HCC malignancies according to characteristic imaging features, HBP hypointensity captured during Gd-BOPTA-MRI can improve sensitivity while maintaining high specificity in the diagnosis of both small and large HCCs for high-risk patients.
Supplementary
The article’s supplementary files as
Acknowledgments
Funding: This study received funding from Joint Funds for the innovation of science and Technology, Fujian Province (CN) (Award Number: 2019Y9125); the Fujian Provincial Health and Family Planning Commission (CN) (Award Number: 2017-CX-27), Special Fund of Fujian Provincial Department of Finance (BPB-lym2019).
Ethical Statement: The authors are accountable for all aspects of the work in ensuring that questions related to the accuracy or integrity of any part of the work are appropriately investigated and resolved. This single-center retrospective cohort study was approved by the Institutional Review Board (No. [2016]118 and No. [2019]283), who determined the requirement for informed consent could be waived.
Footnotes
Conflicts of Interest: All authors have completed the ICMJE uniform disclosure form (available at http://dx.doi.org/10.21037/atm-20-1096). The authors have no conflict of interest to declare.
References
- 1.Bray F, Ferlay J, Soerjomataram I, et al. Global cancer statistics 2018: GLOBOCAN estimates of incidence and mortality worldwide for 36 cancers in 185 countries. CA Cancer J Clin 2018;68:394-424. 10.3322/caac.21492 [DOI] [PubMed] [Google Scholar]
- 2.Heimbach JK, Kulik LM, Finn RS, et al. AASLD guidelines for the treatment of hepatocellular carcinoma. Hepatology 2018;67:358-80. 10.1002/hep.29086 [DOI] [PubMed] [Google Scholar]
- 3.Marrero JA, Kulik LM, Sirlin CB, et al. Diagnosis, Staging, and Management of Hepatocellular Carcinoma: 2018 Practice Guidance by the American Association for the Study of Liver Diseases. Hepatology 2018;68:723-50. 10.1002/hep.29913 [DOI] [PubMed] [Google Scholar]
- 4.Ai Z, Han Q, Huang Z, et al. The value of multiparametric histogram features based on intravoxel incoherent motion diffusion-weighted imaging (IVIM-DWI) for the differential diagnosis of liver lesions. Ann Transl Med 2020;8:1128. 10.21037/atm-20-5109 [DOI] [PMC free article] [PubMed] [Google Scholar]
- 5.Chou R, Cuevas C, Fu R, et al. Imaging Techniques for the Diagnosis of Hepatocellular Carcinoma: A Systematic Review and Meta-analysis. Ann Intern Med 2015;162:697-711. 10.7326/M14-2509 [DOI] [PubMed] [Google Scholar]
- 6.Lee YJ, Lee JM, Lee JS, et al. Hepatocellular carcinoma: diagnostic performance of multidetector CT and MR imaging-a systematic review and meta-analysis. Radiology 2015;275:97-109. 10.1148/radiol.14140690 [DOI] [PubMed] [Google Scholar]
- 7.Wu Y, White GM, Cornelius T, et al. Deep learning LI-RADS grading system based on contrast enhanced multiphase MRI for differentiation between LR-3 and LR-4/LR-5 liver tumors. Ann Transl Med 2020;8:701. 10.21037/atm.2019.12.151 [DOI] [PMC free article] [PubMed] [Google Scholar]
- 8.Hanna RF, Miloushev VZ, Tang A, et al. Comparative 13-year meta-analysis of the sensitivity and positive predictive value of ultrasound, CT, and MRI for detecting hepatocellular carcinoma. Abdom Radiol (NY) 2016;41:71-90. 10.1007/s00261-015-0592-8 [DOI] [PubMed] [Google Scholar]
- 9.Kreft BP, Baba Y, Tanimoto A, et al. Orally administered manganese chloride: enhanced detection of hepatic tumors in rats. Radiology 1993;186:543-8. 10.1148/radiology.186.2.8421762 [DOI] [PubMed] [Google Scholar]
- 10.Ni Y, Marchal G, Yu J, et al. Prolonged positive contrast enhancement with Gd-EOB-DTPA in experimental liver tumors: potential value in tissue characterization. J Magn Reson Imaging 1994;4:355-63. 10.1002/jmri.1880040322 [DOI] [PubMed] [Google Scholar]
- 11.Ni Y, Marchal G. Enhanced magnetic resonance imaging for tissue characterization of liver abnormalities with hepatobiliary contrast agents: an overview of preclinical animal experiments. Top Magn Reson Imaging 1998;9:183-95. 10.1097/00002142-199806000-00004 [DOI] [PubMed] [Google Scholar]
- 12.Narita M, Hatano E, Arizono S, et al. Expression of OATP1B3 determines uptake of Gd-EOB-DTPA in hepatocellular carcinoma. J Gastroenterol 2009;44:793-8. 10.1007/s00535-009-0056-4 [DOI] [PubMed] [Google Scholar]
- 13.Kitao A, Zen Y, Matsui O, et al. Hepatocellular carcinoma: signal intensity at gadoxetic acid-enhanced MR Imaging--correlation with molecular transporters and histopathologic features. Radiology 2010;256:817-26. 10.1148/radiol.10092214 [DOI] [PubMed] [Google Scholar]
- 14.Omata M, Cheng AL, Kokudo N, et al. Asia-Pacific clinical practice guidelines on the management of hepatocellular carcinoma: a 2017 update. Hepatol Int 2017;11:317-70. 10.1007/s12072-017-9799-9 [DOI] [PMC free article] [PubMed] [Google Scholar]
- 15.Kudo M, Izumi N, Kokudo N, et al. Management of hepatocellular carcinoma in Japan: Consensus-Based Clinical Practice Guidelines proposed by the Japan Society of Hepatology (JSH) 2010 updated version. Dig Dis 2011;29:339-64. 10.1159/000327577 [DOI] [PubMed] [Google Scholar]
- 16.Korean Liver Cancer A , National Cancer C. 2018 Korean Liver Cancer Association-National Cancer Center Korea Practice Guidelines for the Management of Hepatocellular Carcinoma. Gut Liver 2019;13:227-99. 10.5009/gnl19024 [DOI] [PMC free article] [PubMed] [Google Scholar]
- 17.European Association for the Study of the Liver . Electronic address eee, European Association for the Study of the L. EASL Clinical Practice Guidelines: Management of hepatocellular carcinoma. J Hepatol 2018;69:182-236. 10.1016/j.jhep.2018.03.019 [DOI] [PubMed] [Google Scholar]
- 18.Liver Imaging Reporting and Data System version 2018. Accessed July 30, 2018. Available online: https://www.acr.org/Clinical-Resources/Reporting-and-Data-Systems/LI-RADS
- 19.Choi SH, Byun JH, Lim YS, et al. Diagnostic criteria for hepatocellular carcinoma ≤3 cm with hepatocyte-specific contrast-enhanced magnetic resonance imaging. J Hepatol 2016;64:1099-107. 10.1016/j.jhep.2016.01.018 [DOI] [PubMed] [Google Scholar]
- 20.Renzulli M, Biselli M, Brocchi S, et al. New hallmark of hepatocellular carcinoma, early hepatocellular carcinoma and high-grade dysplastic nodules on Gd-EOB-DTPA MRI in patients with cirrhosis: a new diagnostic algorithm. Gut 2018;67:1674-82. 10.1136/gutjnl-2017-315384 [DOI] [PubMed] [Google Scholar]
- 21.Song JS, Choi EJ, Hwang SB, et al. LI-RADS v2014 categorization of hepatocellular carcinoma: Intraindividual comparison between gadopentetate dimeglumine-enhanced MRI and gadoxetic acid-enhanced MRI. Eur Radiol 2019;29:401-10. 10.1007/s00330-018-5559-z [DOI] [PubMed] [Google Scholar]
- 22.Joo I, Lee JM, Lee DH, et al. Retrospective validation of a new diagnostic criterion for hepatocellular carcinoma on gadoxetic acid-enhanced MRI: can hypointensity on the hepatobiliary phase be used as an alternative to washout with the aid of ancillary features? Eur Radiol 2019;29:1724-32. 10.1007/s00330-018-5727-1 [DOI] [PubMed] [Google Scholar]
- 23.Kim DH, Choi SH, Kim SY, et al. Gadoxetic Acid-enhanced MRI of Hepatocellular Carcinoma: Value of Washout in Transitional and Hepatobiliary Phases. Radiology 2019;291:651-7. 10.1148/radiol.2019182587 [DOI] [PubMed] [Google Scholar]
- 24.Chernyak V, Fowler KJ, Kamaya A, et al. Liver Imaging Reporting and Data System (LI-RADS) Version 2018: Imaging of Hepatocellular Carcinoma in At-Risk Patients. Radiology 2018;289:816-30. 10.1148/radiol.2018181494 [DOI] [PMC free article] [PubMed] [Google Scholar]
- 25.Tang A, Bashir MR, Corwin MT, et al. Evidence Supporting LI-RADS Major Features for CT- and MR Imaging-based Diagnosis of Hepatocellular Carcinoma: A Systematic Review. Radiology 2018;286:29-48. 10.1148/radiol.2017170554 [DOI] [PMC free article] [PubMed] [Google Scholar]
- 26.Joo I, Kim H, Lee JM. Cancer stem cells in primary liver cancers: pathological concepts and imaging findings. Korean J Radiol 2015;16:50-68. 10.3348/kjr.2015.16.1.50 [DOI] [PMC free article] [PubMed] [Google Scholar]
- 27.Golfieri R, Grazioli L, Orlando E, et al. Which is the best MRI marker of malignancy for atypical cirrhotic nodules: hypointensity in hepatobiliary phase alone or combined with other features? Classification after Gd-EOB-DTPA administration. J Magn Reson Imaging 2012;36:648-57. 10.1002/jmri.23685 [DOI] [PubMed] [Google Scholar]
- 28.Kwon HJ, Byun JH, Kim JY, et al. Differentiation of small (</=2 cm) hepatocellular carcinomas from small benign nodules in cirrhotic liver on gadoxetic acid-enhanced and diffusion-weighted magnetic resonance images. Abdom Imaging 2015;40:64-75. 10.1007/s00261-014-0188-8 [DOI] [PubMed] [Google Scholar]
- 29.Kim YY, Choi JY, Sirlin CB, et al. Pitfalls and problems to be solved in the diagnostic CT/MRI Liver Imaging Reporting and Data System (LI-RADS). Eur Radiol 2019;29:1124-32. 10.1007/s00330-018-5641-6 [DOI] [PubMed] [Google Scholar]
- 30.Korean Society of Abdominal R. Diagnosis of Hepatocellular Carcinoma with Gadoxetic Acid-Enhanced MRI : 2016 Consensus Recommendations of the Korean Society of Abdominal Radiology. Korean J Radiol 2017;18:427-43. 10.3348/kjr.2017.18.3.427 [DOI] [PMC free article] [PubMed] [Google Scholar]
- 31.Tang A, Fowler KJ, Chernyak V, et al. LI-RADS and transplantation for hepatocellular carcinoma. Abdom Radiol (NY) 2018;43:193-202. 10.1007/s00261-017-1210-8 [DOI] [PubMed] [Google Scholar]
- 32.Kitao A, Matsui O, Yoneda N, et al. Hypervascular hepatocellular carcinoma: correlation between biologic features and signal intensity on gadoxetic acid-enhanced MR images. Radiology 2012;265:780-9. 10.1148/radiol.12120226 [DOI] [PMC free article] [PubMed] [Google Scholar]
- 33.Lee S, Kim SH, Park CK, et al. Comparison between areas with Gd-EOB-DTPA uptake and without in hepatocellular carcinomas on Gd-EOB-DTPA-enhanced hepatobiliary-phase MR imaging: pathological correlation. J Magn Reson Imaging 2010;32:719-25. 10.1002/jmri.22291 [DOI] [PubMed] [Google Scholar]
- 34.Lee SA, Lee CH, Jung WY, et al. Paradoxical high signal intensity of hepatocellular carcinoma in the hepatobiliary phase of Gd-EOB-DTPA enhanced MRI: initial experience. Magn Reson Imaging 2011;29:83-90. 10.1016/j.mri.2010.07.019 [DOI] [PubMed] [Google Scholar]
- 35.Min JH, Kim YK, Choi SY, et al. Differentiation between cholangiocarcinoma and hepatocellular carcinoma with target sign on diffusion-weighted imaging and hepatobiliary phase gadoxetic acid-enhanced MR imaging: Classification tree analysis applying capsule and septum. Eur J Radiol 2017;92:1-10. 10.1016/j.ejrad.2017.04.008 [DOI] [PubMed] [Google Scholar]
- 36.Kim R, Lee JM, Shin CI, et al. Differentiation of intrahepatic mass-forming cholangiocarcinoma from hepatocellular carcinoma on gadoxetic acid-enhanced liver MR imaging. Eur Radiol 2016;26:1808-17. 10.1007/s00330-015-4005-8 [DOI] [PubMed] [Google Scholar]
- 37.Seale MK, Catalano OA, Saini S, et al. Hepatobiliary-specific MR contrast agents: role in imaging the liver and biliary tree. Radiographics 2009;29:1725-48. 10.1148/rg.296095515 [DOI] [PubMed] [Google Scholar]
- 38.Park Y, Kim SH, Kim SH, et al. Gadoxetic acid (Gd-EOB-DTPA)-enhanced MRI versus gadobenate dimeglumine (Gd-BOPTA)-enhanced MRI for preoperatively detecting hepatocellular carcinoma: an initial experience. Korean J Radiol 2010;11:433-40. 10.3348/kjr.2010.11.4.433 [DOI] [PMC free article] [PubMed] [Google Scholar]
- 39.Dioguardi Burgio M, Picone D, Cabibbo G, et al. MR-imaging features of hepatocellular carcinoma capsule appearance in cirrhotic liver: comparison of gadoxetic acid and gadobenate dimeglumine. Abdom Radiol (NY) 2016;41:1546-54. 10.1007/s00261-016-0726-7 [DOI] [PubMed] [Google Scholar]
- 40.Neri E, Bali MA, Ba-Ssalamah A, et al. ESGAR consensus statement on liver MR imaging and clinical use of liver-specific contrast agents. Eur Radiol 2016;26:921-31. 10.1007/s00330-015-3900-3 [DOI] [PMC free article] [PubMed] [Google Scholar]
Associated Data
This section collects any data citations, data availability statements, or supplementary materials included in this article.
Supplementary Materials
The article’s supplementary files as


