

Abstract

Binding of Nile Blue (NB) with calf thymus DNA has been studied using molecular modeling, spectroscopic, and thermodynamic techniques. Our study revealed that NB binds to the DNA helix by two types of modes (groove binding and intercalation) simultaneously. The thermodynamic study showed that the overall binding free energy is a combination of several negative and positive free energy changes. The binding was favored by negative enthalpy and positive entropy changes (due to the release of water from the DNA helix). The docking study validated all experimental evidence and showed that NB binds to a DNA minor groove at low concentrations and switches to intercalation mode at higher concentrations.
Introduction
Genetic material deoxyribo nucleic acid (DNA) is one of the most important molecules in the cellular system. At present, the search for novel DNA-targeted therapeutic agents become an important area of research.1−6 Because of the diversity in DNA sequences the search for a sequence-specific DNA binder is an interesting topic of research.7,8 DNA binder molecules generally bind to DNA either by covalent mode9,10 or noncovalent mode.11−13 Among the two types of binding modes, noncovalent mode is safer because of low toxicity. Noncovalent binder molecules may bind by groove binding mode, intercalation mode, and electrostatic mode. Several researchers studied the anticancer14,15 and antimicrobial16−18 properties of noncovalent DNA binder molecules. Binding of dyes to DNA is an important area of research because of their sensing/imagery and phototherapeutic applications.19−22 The fluorescent nature of dyes may be used for specification, staining, and photosensitization of DNA molecules.23−25 They can also retard DNA replication and act as a cytotoxic agent against carcinoma cells.26,27 They also show antimicrobial activity by inhibiting DNA synthesis.28,29 In our previous study, we showed that the rhodamine group of dyes are good DNA binder molecules,30−32 which motivated us to continue the study with Nile Blue A (NB) (Figure 1).
Figure 1.

Structure of Nile Blue.
NB is a highly fluorescent dye belonging to the naphthoxazinium group, frequently used for histological staining of biological samples and as a coloring agent in DNA electrophoresis techniques.33 The dye is also used as a staining agent for tumor localization34,35 and photosensitized agent for photodynamic therapy of cancer.36,37 It was also observed that some of these groups of dyes can suppress tumor growth.38,39
Few researchers studied the interaction of NB with DNA in the primary level.34,40−43 Dezhampanah et al.(40) studied the binding of Nile Blue to DNA by spectroscopic methods. Ju et al.(43) showed that NB can be used as an electrochemical indicator for the preparation of DNA sensors because of its electrostatic interaction. A comparative interaction study of NB with DNA, micelles, and reverse micelles shows that NB has greater affinity toward micelles than that of DNA.41 Gattuso et al.(42) studied the photosensitization properties of Nile Blue and its derivative Nile Red. Binding modes of Nile Blue and Nile Red had been assessed by them even though no free energy calculation is reported.
In this study, we reported the interaction of Nile Blue with calf thymus DNA (CT-DNA) using several spectroscopic methods like absorbance, fluorescence, and circular dichoric studies. We also determined the thermodynamic parameters, and the obtained results were validated using molecular modeling.44
Results and Discussion
Binding Studies Using Absorption Spectroscopy
The absorption spectrum of NB in 10 mM citrate-phosphate (CP) buffer of pH 7.0 shows absorbance in the range of 500–750 nm with a peak at 635 nm (Figure 2a) may be because of the π → π* or n → π* transition (band gap 1.84 eV Figure S1). With increasing concentrations of CT-DNA absorbance of NB decreases gradually with a very little bathochromic shift (3 nm) and reaches the saturation point, which indicates that the entire dye binds with the DNA helix (band gap 1.82 eV Figure S1). The binding constant for the overall interaction was determined by the Benesi Hildebrand plot (inset of Figure 2a) using the following equation
| 1 |
where ΔA is the change in absorbance, ΔA0 is the change in absorbance at saturation, [DNA] is the concentration of DNA, and K is the binding constant.
Figure 2.
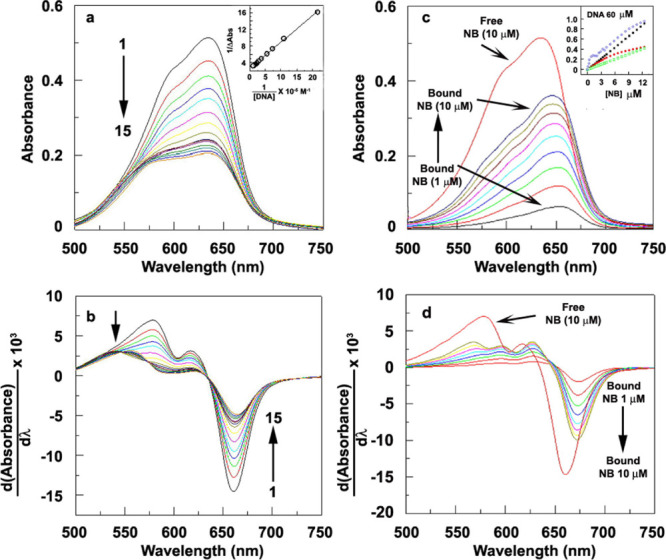
(a) Absorbance spectra of NB (10 μM) with increasing concentration of CT-DNA; inset: Benesi Hildebrand plot, (b) corresponding derivative spectra of (a), (c) absorbance spectra of NB (increasing concentration 1–10 μM) in the presence of 60 μM of CT-DNA, (d) corresponding derivative spectra of (c), inset of (c): fraction of bound NB (blue circles), calculated absorbance of free NB (black points), calculated absorbance of fully bound NB (green points), and experimental absorbance (red point) against the concentration of NB.
From the plot, we obtained the overall binding constant, 4.27 × 10⁵ (M–1) at room temperature (298 K). The corresponding binding free energy was obtained −7.73 kcal/mol (Table 1) using the following equation
| 2 |
where ΔG is the Gibbs free energy, R is the universal gas constant (taken as 2 cal/mol K), T is the absolute temperature (298 K), and K is the binding constant.
Table 1. Binding Constants at Different Salt Concentrations Determined by a Spectrophotometric Process and Analyzed by Scatchard Analysisa.
| salt concentration (Na+) (mM) | binding constant K × 10–5 (M–1) | ΔGt (cal/mol) | ΔGpe (cal/mol) | ΔGobs (cal/mol) | ΔSpe = −ΔGpe/T | number of Na+ release = TΔSpe/950 |
|---|---|---|---|---|---|---|
| 10 | 4.27 | –5778 | –1949 | –7727 | 6.54 | 2 |
| 20 | 2.91 | –5843 | –1655 | –7498 | 5.55 | 1.75 |
| 50 | 1.37 | –5781 | –1268 | –7049 | 4.25 | 1.33 |
Average of four determinations. Binding constants (K) were determined in CP buffer containing 5, 10, and 25 mM Na2HPO4, pH 7.0 at 25.0 °C.
Previous studies20,21,30−32 revealed that during DNA intercalation and groove binding, the saturation of absorbance occurs at a high [DNA]/[dye] ratio (more than 1). Here, the lack of fitting of the curve by noncooperative Scatchard analysis because of the unnaturally low [DNA]/[dye] ratio led us to search the binding phenomenon in detail (other than the conventional concept).
Integrated absorption spectra may be unsuccessful in picking up more than one type of binding occurring simultaneously.45,46 From the derivative spectra (Figure 2b), we observed that free NB shows two positive peaks at 579 and 617 nm and a negative peak at 661 nm. With the increasing concentration of DNA, the intensity of all peaks decreases. Initially, at lower DNA concentrations, a clear isosbestic point was observed at 636 nm (curve 1–7 in Figure 2b). At a higher DNA concentration curve (8–15), some changes in the spectral pattern were observed and two newer isosbestic points at 546 and 574 nm were observed. This may be an indication of the formation of another type of binding except the initial type of binding.
For a detailed analysis, the absorbance of NB was recorded in the presence of a fixed concentration of DNA (60 μM) (Figure 2c). It was observed that free NB shows a peak at 635 nm with a little hump at 597 nm (thick red curve in Figure 2c). In the presence of DNA, NB shows peak at 654 nm with no hump or another peak at a very low concentration (1 μM). With increasing concentration of the [NB]/[DNA] ratio, the peaks shift toward a lower wavelength and reaches 646 nm at 10 μM of NB. A (bathochromic and hypochromic) shift of the peak in comparison to free dye and the presence of the isosbestic point clearly indicates that the dye remains bounded to DNA at that concentration. Neither aggregation47 of NB nor the distortion of DNA was observed during the study (Figures S2 and S3).
The gradual changes in the peak pattern were explored by derivative spectra in detail (Figure 2d). Figure 2d shows two positive peaks at 579 and 617 nm and a negative peak at 661 nm for free DNA (thick red curve). At a very low concentration (1 μM) of NB, we observed a negative peak at 673 nm and tow positive humps at 630 and 595 nm. A clear isosbestic point was also observed at 650 nm. After the addition of 4 μM of dye, the pattern of the peak started to change with a sifting of the isosbestic point 650–641 nm and formation of the weak hump at 568 nm. It clearly indicates the change in the binding pattern (which was absent in the binding study with ethidium saturated DNA, Figure S6).
The inset of Figure 2c shows the fraction of bound NB (blue points) against the total added NB concentration. Figure shows that initially the fraction of bound NB cooperatively increases with the increase in the concentration of Nile Blue, which clearly indicates that binding happens in a cooperative manner. We determined the binding parameters for this portion separately (Figure S4) and found the binding constant, cooperativity factor, and excluded binding sites were 2680, 240, and 56.66 M–1, respectively. At a higher concentration of added NB, the binding switches to a noncooperative direction with an overall binding constant of 4.27 × 10⁵ M–1 (determined using Benesi–Hildebrand plot, inset: Figure 2a).
Ionic Strength Dependence of the Binding
To determine the effect of the salt concentration on binding, binding constants were determined at three different salt concentrations of [Na+], 10, 20, and 50 mM using the non-Bensi Hildebrand plot as stated above.
The relationship between binding constant K and [Na+] was determined using the following relation given by Record and co-workers48
| 3 |
where Z is the apparent charge on the bound ligand and ψ is the fraction of the [Na+] bound per DNA phosphate. The plot of ln K versus ln[Na+] gives a straight line with a slope (Zψ) of −0.71, indicating the decrease of binding with increasing [Na+] concentration. The overall binding free energy may have several contributions, and from this study, we are able to segregate the overall binding free energy into two parts; nonpolyelectrolytic contribution (ΔGt) and the polyelectrolytic contribution (ΔGpe)48,49 using the following equation
| 4 |
polyelectrolytic contribution (ΔGpe) was determined using the following equation48
| 5 |
where, Zψ is the slope of ln K versus ln[Na+] plot, R is the universal gas constant (2 cal/mol K), T is the absolute temperature (here 298 K), and [Na+] is the concentration of the sodium ion in buffer.
From our study, we observed that the non-polyelectrolytic contribution is more than that of the polyelectrolytic contribution (Figure 3b). In each buffer. the nonpolyelectrolytic contributions are more or less the same, whereas the polyelectrolytic contribution decreases with increasing salt concentration (Table 1). The polyelectrolytic contribution is because of the release of Na+ ions from the outer side of the DNA helix during the binding of positively charged ligand in a nonenthalpic process.50 The increase in the entropic term (TΔSpe) for the polyelectrolytic process is 4 kJ/mol (950 cal/mol) per salt link. From entropic data (TΔSpe) obtained, we calculated the release of the Na+ ion is 2, 1.75, and 1.33 for 10, 20, and 50 mM buffer, respectively (Table 1). The release of the decreasing amount of Na+ from the DNA helix with increasing salt concentration indicates that the Na+ ion retards the positively charged ligand to come to the DNA helix (due to the decrease of the negative charge in the outer side phosphate of DNA).
Figure 3.

(a) ln K vs ln[Na+] plot. (b) Solid parts and hatched parts indicate nonpolyelectrolytic (ΔGt) and the polyelectrolytic (ΔGpe) free energy changes, respectively. In all cases, the values of K obtained from the Benesi Hildebrand plot.
Fluorescence Spectroscopic Study
Nile Blue is a highly fluorescent compound and gives an emission spectrum in the range of 600–750 nm with a peak at 672 nm (Figure 4a) when exited at 560 nm. In the presence of DNA, the intensity of the fluorescence emission spectrum decreases, may be due to the absorption of the low amount of light because of binding in the DNA helix. Here, added DNA acts as a quencher molecule. The relation between the fluorescence intensity and concentration of DNA (quencher) is obtained from the Stern–Volmer plot as given below
| 6 |
where F0 and F are the fluorescence intensities for free and bound NB, Ksv is the Stern–Volmer constant, Kq is the bimolecular quenching rate coefficient, τ is the lifetime of the emissive excited state of Nile Blue without a quencher, and [Q] is the concentration of the quencher (DNA).
Figure 4.

(a) Fluorescence spectra of NB with increasing concentration of DNA (1–15), inset; Stern Volmer plot, (b) derivative fluorescence spectra of NB with increasing concentration of DNA (1–5), (c) Benesi Hildebrnad plot for the binding of NB to DNA, and (d) quantum yield of NB in the presence of DNA.
Our study shows that Ksv for the binding of NB to DNA is 0.141 × 10⁶ M–1 lit. Oliveria et al.(51) determined that the τ value for Nile Blue in water is 0.76 ns. Using that value (τ = 0.76 nano second), we calculated the value of Kq during the binding of DNA is 1.86 × 10¹⁴ M–1 lit s–1. The high value of Kq indicates that the binding is static in nature, which was also supported by Chen et al.(34)
Here, also we studied the derivative spectra to investigate more than one type of binding. From the spectra (Figure 4b), we observed that free NB gives a positive peak at 656 nm and negative peak at 688 nm. With increasing concentration of DNA, the intensity of both the peaks decreases and a clear isosbestic point was formed near 674 nm initially. At high concentrations of the DNA, peak intensity still decreases but an isosbestic point shift from 674 to 669 nm indicates that there may be two types of binding phenomenon. The overall binding constant determined using a Benesi Hildebrand plot (Figure 4c) is 1.71 × 10⁵ M–1, which is in good agreement with that of the absorbance study.
Previous studies showed a quantum yield of NB in water is 0.01.51 It was observed (Figure 4d) that the quantum yield of NB decreases with increasing concentration of DNA. The decrease in fluorescence emission and quantum yield in DNA-bound Nile Blue may be because of photosensitization that opens up other nonradiative decay channels.42 A slight change in the quantum yield after and before 4 μM DNA may indicate a shifting of mode of binding.
Conformational Aspects of Binding
The conformational change of the DNA helix during binding with NB was studied using intrinsic CD spectra (Figure 5a). From our study, we observed that free DNA shows a large positive peak at 273 nm and a negative peak at 243 nm, which is evidence for the canonical B-form structure of free DNA.31 The positive band is because of the stacking between base pairs, whereas the negative band is because of the helical structure of DNA. NB is optically inactive planer dye and no CD spectrum was obtained in the range of 800–200 nm. With increasing concentration of NB, both the peaks of the DNA change, which clearly indicates that both base pair stacking and helicity of DNA change during binding. The increase of the positive peak and decreasing in the negative peak is clear indication of the increase of the base pair stacking and positive twisting of the DNA helix (supported by docking study, vide infra), which was also supported by Chen et al.(34)
Figure 5.

(a) Intrinsic CD spectra of DNA with increasing concentration of CT-DNA and (b) free energy change of the DNA helix with increasing concentration of NB. Inset; absorbance of CT-DNA at 260 nm with the increasing concentration of NB.
Conformational free energy change30 was determined by the absorption variation of DNA at 260 nm in the presence of NB (Figure 5b). This study clearly indicates the increase in stacking between the base pair with the increase in the NB concentration (Figure 5b inset).34 We also determine the free energy change during binding and obtained a value of 1.56 ± 0.07 kcal/mol. This value is slightly less than that obtained from the docking study (vide infra). This may be due to the extra stability of the DNA helix in the presence of [Na+] during the experimental study.
Isothermal Titration Calorimetric Studies
After obtaining the overall binding free energy change, salt-dependent free energy change, and conformational free energy change, we determined other thermodynamic parameters like enthalpy change (ΔH), entropy change (ΔS), and number of binding sites (N) using an isothermal titration calorimetric (ITC) study (Figure 6).31 Our study shows that the reaction is exothermic in nature (upper panel of Figure 6). The evolved heat during the reaction is corrected by the dilution of DNA in buffer at same reaction conditions. The dilution of NB with buffer was neglected because of very small heat change and very little dilution (cell volume 400 μL, and siring volume 40 μL). The normalized heat change for the interaction of NB with DNA is shown in the lower panel of Figure 6. The obtained data were fitted by one site fitting model.
Figure 6.

Representative ITC profile for the titration of CT DNA into a solution of NB in 10 mM CP buffer, pH 7.0 at 25.0 °C. In the top panel, the heat burst curves are the result of successive injection of aliquots of the DNA into the NB. The bottom panel represents the corresponding normalized heat signals versus molar ratio. The control heat bursts of titration of the dye into buffer are presented in the top panel (curves offset of clarity).
Our study shows the binding constant (K) is (5.13 ± 0.86) × 105 M–1, enthalpy change (ΔH) is −2.16 ± 0.013 kcal/mol, entropy change (ΔS) is 18.90 kcal/mol K, and binding site size (1/N) is 3.12 bases, which is in good agreement with other studies. The negative enthalpy change indicates a good association or formation of newer bond/π–π stacking during the interaction. The positive value of entropy changes is the indication of the release of associated water molecules.
Heat Capacity Change
Heat capacity change (ΔCp) and hydrophobic free energy change play an important role to study the small molecule–DNA interaction. Figure 7a represents the variation of the ΔH values against the temperature (Table 2).
Figure 7.

(a) Enthalpy change vs temperature plot and (b) enthalpy entropy compensation plot. (The circles indicate overall compensation, the red squares indicate the nonpolyelectrolytic contributions and blue triangle indicates the polyelectrolytic contribution for the compensation study) during the binding of NB to DNA.
Table 2. Temperature-Dependent Binding Data Obtained from ITC Experimentsa.
| temperature (K) | K × 105 (M–1) | ΔH (cal/mol) | ΔCp (cal/mol K) | ΔGhyd (cal/mol) | ΔSASA (Å)2 |
|---|---|---|---|---|---|
| 288 | 7.06 | –615 | –160.5 ± 3.17 | –12840 ± 253.6 | 584 ± 11.52 |
| 293 | 5.50 | –2165 | |||
| 308 | 3.50 | –3825 |
All the data in this table are derived from the ITC studies and are average of four determinations. T, K, and ΔH denote absolute temperature, binding constant, and enthalpy change, respectively. Gibbs free energy change (ΔG) was determined using the equations ΔG = −RT ln K.
Figure 7a indicates enthalpy changes at different temperatures obtained from the ITC study. The intercept and slopes of Figure 7a indicate enthalpy change at absolute zero (ΔH0) and heat capacity change (ΔCp) during binding, and their values were 45.63 ± 0.95 kcal/mol and −160 ± 3.17 cal/mol K, respectively.
The contribution for hydrophobic free energy change was determined using the following equation48
| 7 |
The calculated hydrophobic free energy change for this study was near about −12.84 kcal/mol, which was in good agreement with that obtained from the docking study (vide infra). The high value of the hydrophobic free energy change (ΔGhyd) indicates deep penetration of NB into the DNA helix.
Enthalpy Entropy Compensation
The enthalpy–entropy compensation study is used to explore the effect of the solvent during the binding of macromolecules.52,53Figure 7b (ITC study at deferent temperature) indicates that with the increase in temperature, free energy change remains more or less the same while enthalpy of binding becomes a more negative value (may be due to the large conformational changes for making and breaking of bonds). The constant value of Gibbs free energy change during this process is the result of the compensation of enthalpy changes (toward negative value) by entropy changes (toward positive values). The overall entropy changes may be divided into two parts, nonpolyelectrolytic (ΔSnp), and polyelectrolytic (ΔSpe) (Table 3). As the polyelectrolytic free energy change (ΔGpe) is an isoenthalpic process (vide supra), TΔSpe does not contribute in the compensation mechanism.50
Table 3. Enthalpy and Entropy Related Data Used for the Enthalpy–Entropy Compensation Plota.
| temp (K) | ΔG (cal/mol) | ΔH (cal/mol) | ΔS cal/mol K | ΔSnp cal/mol K | ΔSpe cal/mol K | number of water release = ΔSnp/5.27 |
|---|---|---|---|---|---|---|
| 288 | –7757 | –615 | 24.80 | 18.04 | 6.76 | 3.42 |
| 298 | –7878 | –2165 | 19.17 | 12.63 | 6.54 | 2.4 |
| 308 | –7864 | –3825 | 13.11 | 6.78 | 6.33 | 1.28 |
All the free energy changes (ΔG), enthalpy changes (ΔH), and entropy changes (ΔS) in this table are derived from the ITC study. The values of the polyelectrolytic entropy changes (ΔSpe) are determined from the absorbance study using the relationship ΔSpe = ΔGpe/T. Nonpolyelectrolytic entropy changes (ΔSnp) are determined using the equation ΔSnp = ΔS – ΔSpe at given temperate.
Figure 7b indicates the change of TΔS against ΔH. A slope of 0.96 for both overall TΔS and nonpolyelectrolytic entropic term (TΔSnp) indicates full compensation between the enthalpy and entropic terms. The increase in entropy may be because of the release of water from the DNA helix with the change of temperature. Our study shows that the amount of released water (Supporting Information, calculation S1) decreases with increasing temperature, which may be due to the increase of space for water (slight unwinding of the DNA helix). No change in the polyelectrolytic entropic term (TΔSpe) with the change of ΔH clearly shows that polyelectrolytic entropy does not take part in the compensation mechanism.
The above obtained thermodynamic free energies play a significant role in the binding phenomenon. The following equation shows the relationship among the free energy contributions.54,55
| 8 |
where ΔGobs is the observed binding free energy, calculated from the DNA binding constant (K) using a standard Gibbs equation. ΔGconf is the free energy change for the conformational change, ΔGt+r is the free energy contribution because of the restriction of translational and rotational freedom, ΔGhyd is the hydrophobic free energy change, ΔGpe is the electrostatic free energy contribution caused because of the release of condensed counterions from DNA, ΔGmol is the free energy contribution from the formation of weak noncovalent bonds including hydrogen bonds, van der Waals interactions, and other weak forces upon complex formation. For the DNA–NB interaction, the obtained value of ΔGobs is −7.73 kcal/mol. Calculated conformational free energy change (ΔGconf) is about 1.56 kcal/mol. The free energy change is because of the loss of translational and rotational freedom (taken as 15 kcal/mol).31,56 We also calculated hydrophobic free energy change (ΔGhyd = −12.84 ± 0.25 kcal/mol) and polyelectrolytic free energy change (ΔGpe = −1.95 kcal/mol). The value of these free energy contributions are placed in eq 8, and the following equation has been obtained.
 |
9 |
With an assumption of ΔGobs = −7.73 kcal/mol, we calculated a value of ΔGmol = −9.50 kcal/mol. All the calculated free energy contributions are plotted in Figure 8. The high value of ΔGmol indicates the formation of hydrogen bonds or van der Waals bonds during complexation, which was also observed by molecular docking (vide infra).
Figure 8.

Different types of free energy contributions for the NB–DNA interaction.
Our study shows NB–DNA complexation is mainly driven by the highly negative hydrophobic free energy change (ΔGhyd) because of the deep penetration of NB into the DNA helix. This free energy value may be more prominent for intercalation mode over groove binding mode. The negative molecular free energy change (ΔGmol) (due to the formation of the bond between NB and DNA) and polyelectrolytic free energy change (ΔGpe) (due to the release of salt from the outer side phosphate of DNA during the binding of the positive charged ligand toward DNA) is also responsible for spontaneous complexation. The polyelectrolytic free energy change may be more prominent over intercalation during binding. Two nonspontaneous phenomena, the change of conformation of DNA helix and restriction of rotational and transitional degrees of freedom of ligand, also occurred. These were reflected by the positive values of ΔGcon and ΔGr+t, respectively. These positive free energy changes compensated by the above-mentioned negative free energy changes make the overall free energy negative (−7.73 kcal/mol).
Quenching Study with the Ferrocyanide Ion
The change of fluorescence properly of a complex in the presence of [Fe(CN)6]4– was an important study for the determination of binding mode of a ligand into DNA. [Fe(CN)6]4– ions act as a quencher, as fluorescent molecules can transfer energy to this. If the molecule is unable to transfer energy to the [Fe(CN)6]4– ion (due to intercalation), or amount of energy transfer decreases (due to groove binding, partial intercalator, etc.), no change of fluorescence intensity or decease of change of fluorescent intensity is observed, respectively. Figure 9b shows transfer of energy from free and bound NB to the [Fe(CN)6]4– (quencher) ion. The Stern–Volmer quenching constant (as eq 6) for free NB is (2.05 ± 0.08) × 102 M–1 lit (Figure 9a), which indicates a sufficient amount of energy transfer from free NB to [Fe(CN)6]4– ion. For bound NB, initially a decrease of fluorescence intensity was observed, which may be due to the presence of unbound NB or groove bound NB. After that a very negligible fluorescence intensity change was observed (Ksv = 0.135 ± 0.02 × 10² M–1 lit), which clearly indicates the deep penetration of NB into the DNA helix. However, a nonzero value of Ksv leads us to explore the nonintercalative binding mode.
Figure 9.

Fluorescence spectra of (a) free NB and (b) bound NB with increasing concentration of the [Fe(CN)6]4– ion. Inset: F0/F value vs concentration of the [Fe(CN)6]4– ion.
Displacement of Ethidium Bromide and DAPI
Ethidium bromide (EtBr) is a classic intercalator used as a fluorescence probe for DNA.56 The displacement of EtBr from DNA by any other ligand clearly indicates that the ligand is also an intercalator.57 For our study, we prepared an EtBr–DNA complex by the titration method (up to saturation). The complex was incubated at 25 °C for 30 min. Then, fluorescence spectra of this complex were taken within 680–550 nm range. The complex shows a peak at 592 nm (whereas free EtBr shows peak at 605 nm) when exited at 510 nm.
With the increase in NB, the fluorescence intensity of the EtBr–DNA complexes decreases, indicating the displacement of EtBr by NB (Figure 10a). The inset of Figure 10a reveals that the fluorescence intensity decreases by about 80% at 4 μM and 50% at 2.20 μM (C50 value) of NB.
Figure 10.

Fluorescence spectra of (a) EtBr–DNA complex with increasing concentration of NB (curve 1–11). Inset: percentage of fluorescence intensity vs NB concentration, (b) DAPI–DNA complex with increasing concentration of NB (curve 1–8). Inset: percentage of fluorescence intensity vs NB concentration, and (c) DAPI–DNA–EtBr complex with increasing concentration of NB (curve 1–4).
The apparent binding constant for this experiment was determined using the following formula56
| 10 |
where Kapp is the apparent binding constant of the NB–DNA complex, C50 is the concentration of the NB concentration for 50% quenching of fluorescence intensity, and KEtBr is the affinity constant of the EtBr–CT-DNA complex, which is taken as 6.58 × 10⁴ M–1 (determined by Tajmir-Riahi and coworkers).58
From eq 9, we calculated the apparent binding constant for NB–DNA complex is 3.77 × 10⁴ M–1 (binding free energy −6.28 kcal/mol), which is much less than that of the overall binding constant (vide supra). This may be because of the competitive binding of NB with EtBr. From our previous studies, we proposed that more than one type of interaction may happen and this experiment clearly indicates that one of the binding modes is intercalation.
Free NB is further able to bind to the EtBr–DNA complex (Figures S6 and S7) by a noncompetitive manner. This indicates that the EtBr–DNA complex has a space for NB which may be a minor groove or major groove. As the size of NB is very small to fit to a major groove, the proposed space may be a minor groove.
4′,6-Diamidino-2-phenylindole (DAPI) is a minor groove binder59−61 molecule and other groove binder molecules are able to displace DAPI from the DAPI–DNA complex.
Free DAPI shows a fluorescence peak near 455 nm when excited at 359 nm, and the intensity of fluorescence increases when it forms a complex with CT-DNA. Figure 10b shows that the fluorescence intensity of the DAPI–DNA complex with increasing concentration of NB. The decrease in the fluorescence intensity clearly indicates the displacement of bound DAPI by adding NB (C50 value is 1.09 μM). To support our observation (NB simultaneously bound to minor groove and intercalate), we extended our study with the DAPI–DNA–EtBr complex. The fluorescence spectrum of the DAPI–DNA–EtBr complex (excited at 359 nm) shows two peaks near 450 and 600 nm (Figure 10c). These peaks may be because of bound DAPI and bound EtBr, respectively. As the concentration of NB increases, the intensity of both the peaks decreases. This study clearly indicates NB can simultaneously displace DAPI and EtBr from DNA, which in turn confirms that NB can bind to the intercalation site and minor groove simultaneously.
Docking Study
Docking study is an important tool to validate the experimental data for clear understanding of the DNA-small molecule interaction.31,32,62 As the exact sequence of CT-DNA is unknown, the 9-acridin polypeptide-(5′CGCGAATTCGCG3′)(3′GCGCTTAAGCGC5′) complex was used for the docking study (1G3X. pdb).62
We replaced the inbuilt ligand (intercalated 9-acridin polypeptide) with NB and observed it fit satisfactorily in between the DNA base pairs, with a free energy change (scoring function) in the range of −9.06 to −11.80 kcal/mol (Table S1).
To observe the detailed conformational changes if any, we prepared B-form DNA with the same sequence and energy was minimized. NB was placed in the same position as that of the pdb crystal and again energy was minimized (MD simulation 100 ps). From docking calculation we observed that a docked form of DNA showed more or less the same conformation as that of NB bounded to that of the pdb crystal, though free energy slightly decreases and is in the range of −8.07 to −10.50 kcal/mol (Table S2).
From the binding study, we observed that NB fitted well in between the DNA base pairs (Figure 11a), and the distance between base pairs increases to 8.08 Å because of intercalation. We also observed that intermolecular π–π stacking, π-positive charge stacking, and hydrogen bonds (between the NH2 group of NB and O– of phosphate of DNA) play a significant role to stabilize the NB–DNA complex (Figure 11b,c). Figure 11d reveals the conformational change of DNA during binding. The free DNA (silver color) has a standard B-form canonical structure. After binding of NB, base pairs present in the intercalation site depart from each other. The height of the DNA helix decreases and width of the intercalation site increases during this phenomenon. From docking study, we observed that conformational free energy was in the range of 2.20–2.40 kcal/mol, which is also discussed in the previous portion (CD study) (Tables S1 and S2).
Figure 11.

(a) NB intercalates in between DNA (pdb crystal). (b) NB intercalates into a DNA build sequence, showing hydrogen bonding, π–π stacking, and π-positive stacking. (c) Two dimensional picture of binding of NB. Inset; corresponding 3D picture. (d) Comparison of the free DNA helix (silver color) and bound DNA helix (red color).
Change in solvent accessible surface areas (ΔSASAs) is another important parameter for the theoretical calculation of hydrophobic free energy change (ΔGhyd) during complex formation. From previous study, we know31,48,63
| 11 |
Our calculated ΔSASA values for downloaded pdb crystal and build sequence were 482 and 457 (Å)2 (Table 4), which correspond to ΔCp values of −132.55 and −125.67 cal mol–1 K–1 (ΔGhyd values −10.06 and −10.05 kcal/mol), respectively. We observed that in both cases the values were much less than that of the experimental value (ΔCp = −160.5 cal/mol K and ΔGhyd = −12.84 kcal/mol) obtained from the ITC experiment (vide supra). This again motivated us for a detailed inspection.
Table 4. Thermodynamic Parameters for Different Types of Binding Obtained from the Docking Studya.
| sl | name | ΔG (kcal/mol) | ΔGcon (kcal/mol) | ΔSASA (Å)2 | ΔGhyd (kcal/mol) | ΔCp (cal/mol K) |
|---|---|---|---|---|---|---|
| 1 | intercalation in the pdb crystal | –9.06 | 1.87 | 482 | 10.60 | 132.55 |
| 2 | intercalation in the build sequence | –8.02 | 2.1 | 457 | 10.05 | 125.675 |
| 3 | groove binding build sequence | –7.34 | 0.9 | 637 | 14.01 | 175.175 |
| 4 | DNA groove binding after intercalation | –6.34 | 2.2 | 519 | 11.41 | 142.725 |
| 5 | DNA intercalation after groove bindingb | –8.93 | 1.2 | 634 | 13.95 | 174.35 |
All the values taken from the probable value corresponding to lowest rmsd.
Closer to the experimental value.
From our experimental observation and the theoretical proposal published by Gattuso et al.,42 it is clear that NB binds to the intercalation site and minor groove of DNA simultaneously. For this purpose, we observed the structural changes of the DNA helix in every step of binding. Free DNA has a purely B-form canonical structure. The base pairs are arranged symmetrically and distance between each base pair is near about 3.6 Å (Figure 12a). When NB is added to the minor groove, a slight unwinding happens (conformational free energy in the range of 0.1–1.4 kcal/mol) with binding free energy in the range of −7.34 to −11.01 kcal/mol (Figure 12b). At the same time, the distance between base pairs increases (near about 3.89–3.99 Å), indicating decrease in stacking between base pairs. As NB is fitted into the intercalation site (Figure 12c), immense twisting occurs (free energy change in the range of 2.2–2.4 kcal/mol), and at the same time, distance between base pairs increases up to 8.08 Å to incarcerate NB in between them. The distance between adjacent base pairs decreases to 3.4 Å, which clearly indicates the retarding of the intercalating agent in that space (excluded binding site).
Figure 12.

(a) Free DNA, (b) NB bound to the minor groove of DNA, (c) NB intercalate into the free DNA, (d) groove binding of NB to the intercalated DNA, (e) intercalation of NB to the groove bound DNA, and (f) comparison for change in helicity for the phenomenon a → b → e (silver → blue → red).
To validate the previously proposed simultaneous binding modes, first we docked a NB into the minor groove of the intercalated DNA (Table S3). It was observed that the second NB did not fit well to the minor groove of distorted (intercalated) DNA and tried to push out the first NB already intercalated (Figure 12d). The binding free energy is also less than that of the intercalation to free DNA only (Table S3). This experiment proved the intercalation of a NB disparate another NB to bind to the minor groove (noncooperative).
We again tried to intercalate NB into the groove-bound DNA. For this purpose, we first docked NB into the minor groove of DNA (Table S4). We found that because of the binding of NB in the minor groove, the DNA helix was slightly unwound and stacking energy between base pairs decreased (height increase from 3.67 to 3.99 Å) (Figure 12b). After that another NB molecules is intercalated into the groove-bound DNA. It was observed that the second NB intercalates more easily to the groove-bound DNA than that of free DNA (Figure 12e) and binding free energy increased (in the range of −8.93 to −11.57 kcal/mol) in comparison to free DNA (range −8.07 to −10.50 kcal/mol). Though the conformational free energy decreased in comparison to free DNA (Table S5), the combined free energy change of groove binding and intercalation is 2.1 kcal/mol [corresponding to the lowest root mean square deviation (rmsd) value], which is in good agreement with earlier studies (experimental and theoretical, vide supra). Figure 12f shows the conformational change of the DNA helix from free DNA (silver color) to a dual bound form (red color) through a groove binding form (blue color). The details of the conformational change are given in Table S6 (Supporting Information). To determine the ΔGhyd value, ΔSASA was also calculated. We found that the ΔSASA value of the combined binding (first groove binding then intercalation) is 634 (Å)2, which correspond to ΔCp and ΔGhyd values are −174.35 cal/mol K and −13.95 kcal/mol, respectively. These values are in good comparison with that of the obtained experimental values (−160.5 cal/mol K and −12.84 kcal/mol).
Conclusions
The spectroscopic and thermodynamic studies clearly suggest that NB has good affinity toward CT-DNA. The binding is static in nature and driven by the negative enthalpy change and positive entropy change. The overall binding free energy is composed of several negative and positive free energy changes. Among them, the negative free energy changes are (I) hydrophobic free energy change (ΔGhyd) because of the hydrophobic interaction between the NB and DNA helix, (II) polyelectrolytic free energy changes (ΔGpe) because of the interaction of positive NB and the negative DNA helix, and (III) molecular free energy change (ΔGmol) because of the formation of hydrogen bonds and van der Waals interactions, whereas the positive free energy changes are (I) rotational and transition free energy change (ΔGr+t) because of the restriction of degree of freedom of molecules and (II) conformational free energy change (ΔGcon) because of conformational change of the DNA helix. The entropy change also has two components, nonpolyelectrolytic (ΔSnp) and polyelectrolytic (ΔSpe). The nonpolyeletrolytic entropy changes are because of the release of the outer side solvent and polyelectrolytic entropy changes are because of the release of bound Na+ ion from the DNA helix. The variation of temperature shows that ΔG remains more or less same with the variation of temperature. However, the value of ΔH decreases and TΔS increases with increasing temperature. The unaffected value of ΔG is due to the fact that ΔH and TΔS compensate each other during the temperature variation.
Absorbance and fluorescence studies showed that more than one type of binding may happen during the interaction. Quenching experiment (ferrocyanide as a quencher), EtBr displacement, and DAPI displacement clearly indicate NB can intercalate and bind to a minor groove of DNA simultaneously. Circular dichroic and spectroscopic studies show a significant conformational change of the DNA helix during the binding phenomenon. Almost all the experimental results are further validated by docking calculation and a good agreement was observed.
Overall our study concluded that initially at very low concentrations NB binds to the minor groove of DNA in a cooperative manner and forms a space between the base pairs by the conformational change of the DNA helix. Later on at higher concentrations, NB intercalates into the DNA base pairs without affecting the molecules bound to the minor groove. We hope our study will be helpful to enrich the literature for the study of such types of simultaneous multiple binding phenomena in future.
Experimental Section
Materials
CT-DNA, DAPI, and NB were purchased from Sigma-Aldrich Corporation (St. Louis, MO, USA). A spectrophotometer was used to determine their concentrations. Molar extinction coefficients of CT-DNA (ε = 6600 M–1 cm–1 at 260 nm)30 (expressed in terms of nucleotide phosphates) and DAPI (ε = 27,000 M–1 cm–1 at 353 nm) were used to determine concentrations in solution. The concentration of NB was measured in 100% ethanol using molar extinction coefficients 76,800 M–1 cm–1 at 627.5 nm.43 The same concentration was also measured in CP buffer pH 7.0, [Na+] 10 mM and found that the molar extinction coefficient in that medium is 54,185 M–1 cm–1 at 635 nm. No deviation from Beer’s law was observed in the concentration range at 0–12 μM for NB used in our study.
All the experiments were conducted in CP buffer medium (10 mM [Na+]) at pH 7.0, containing 5.0 mM Na2HPO4. The pH of the medium was adjusted using citric acid.31 The pH values of the solutions were measured with a calibrated Orion-Ross combined electrode system (model 81-02). All buffer solutions were filtered through Millipore filters (Millipore, India Pvt. Ltd., Bangalore, India) of 0.45 μM, before use.
Absorbance Spectral Studies
A Shimadzu PharmaSpec UV-1700 spectrophotometer connected with a PC (Shimadzu Corporation, Tokyo, Japan) equipped with a thermoelectrically controlled cell holder (model TCC 240A) under stirring at 25 ± 0.1 °C in quartz cells of 1.00 cm path length.
Fluorescence Spectral Studies
Fluorescence spectral studies were measured on a PerkinElmer LS55 spectrofluorimeter (Waltham, Massachusetts, United States) equipped with a thermoelectrically controlled cell holder in matched quartz cells with 1.00 cm path length under stirring at 25 ± 0.5 °C.
Circular Dichroic Studies
All circular dichroic measurements were performed by a JASCO: J-815 spectropolarimeter (Japan Spectroscopic Ltd., Japan) controlled by a PC. A rectangular quartz cell having 1 cm path length was used for all CD measurements performing at 25 ± 0.5 °C as reported earlier.32,33
ITC Studies
To study the heat capacity change and enthalpy of binding, ITC experiments were performed using a VP ITC calorimeter as reported earlier.32 Aliquots of degassed CT-DNA solution (500 μM) were injected from a rotating syringe (1500 rpm) into the isothermal sample chamber containing the Nile Blue solution (15 μM).
Docking Studies
Docking calculations44,64 were performed using MOE 2009 and Autodock (Supporting Information) software. For docking calculations, the dyes were placed into DNA, and MD simulation up to 100 pico seconds (interval of 0.5 ps) was run (ensemble NPT and algorithm NPA). The MD simulation was also extended to 10 ns using GROMACS software (see Supporting Information for details). The lowest energy pose was taken for further study in each case. Calculations for binding scores were conducted using Alpha PMI as the placement methodology; receptor + solvent were taken for the binding pocket (receptor). The docked poses obtained thus were further refined using the force field refinement method available in the MOE program. Molecular descriptors were determined to validate thermodynamic parameters having the pose of lowest rmsd44,64 values. The details of conformational free energy changes were determined using a 3DNA web interface (Supporting Information).
Acknowledgments
M.M. and M.M.I. wish to thank Department of Science & Technology and Biotechnology (DST), Govt. of West Bengal for their financial support (Project no. 756 (Sanc.)/ST/P/S&T/9G-34/2013). The authors would like to thank Prof. Subrata Mukhopadhyay, Department of Chemistry, Jadavpur University and Asif Hasan, Department of Education (post graduating), ABS academy, Durgapur for their valuable help. Authors also acknowledge the partial financial help of Aliah University.
Supporting Information Available
The Supporting Information is available free of charge at https://pubs.acs.org/doi/10.1021/acsomega.0c04775.
Additional results, Tauc plot, band gap determination of free and bound NB, absorbance of NB and DNA after complexation, absorbance study of NB in the presence of high concentrations of DNA, Scatchard plot for cooperative binding of initial binding, representative picture for the release of water molecules, docking study for the intercalation of NB to 1G3X crystal, docking study for the intercalation of NB to free the DNA sequence, docking study for the binding of NB to the minor groove of intercalated DNA, docking study for the minor groove binding of NB to free DNA, docking study for the intercalation of NB to groove-bound DNA sequence, groove binding study of NB, representative picture for the intercalation of EB and groove binding, representation of overall binding of NB with duplex DNA, representation of variations of minor groove binding poses, snapshots of drug in intercalation mode, representation of RMSD, and details of experimental methods (PDF)
Movie S1: MD simulations for the docking of a DNA oligomer CGATCG containing NB at intercalator site and minor groove up to 10 nanoseconds. Studies were conducted to find out if the complex is stable while drug is in dual binding mode. The results obtained from MD simulations suggest that the overall complex is stable during the entire 10 nanosecond simulation (MPG)
Movie S2: MD simulations for the docking of a DNA oligomer CGATCG containing NB at intercalator site and minor groove up to 10 nanoseconds. Studies were conducted to find out if the complex is stable while drug is in dual binding mode. The results obtained from MD simulations suggest that the overall complex is stable during the entire 10 nanosecond simulation (MPG)
Author Contributions
The manuscript was written through contributions of all the authors. All the authors have given approval to the final version of the manuscript.
The authors declare no competing financial interest.
Supplementary Material
References
- Dawson M. A.; Kouzarides T. Cancer Epigenetics: From Mechanism to Therapy. Cell 2012, 150, 12–27. 10.1016/j.cell.2012.06.013. [DOI] [PubMed] [Google Scholar]
- Pati H.; Forrest L.; Townes H.; Lingerfelt B.; McNulty L.; Lee M. Unexpected Syntheses of seco-Cyclopropyltetrahydroquinolines From a Radical 5-Exo-Trig Cyclization Reaction: Analogs of CC-1065 and the Duocarmycins. Molecules 2004, 9, 125–133. 10.3390/90300125. [DOI] [PMC free article] [PubMed] [Google Scholar]
- Sarkar D.; Das P.; Basak S.; Chattopadhyay N. Binding Interaction of Cationic Phenazinium Dyes with Calf Thymus DNA: A Comparative Study. J. Phys. Chem. B 2008, 112, 9243–9249. 10.1021/jp801659d. [DOI] [PubMed] [Google Scholar]
- Li C.-Z.; Liu Y.; Luong J. H. T. Impedance Sensing of DNA Binding Drugs Using Gold Substrates Modified with Gold Nanoparticles. Anal. Chem. 2005, 77, 478–485. 10.1021/ac048672l. [DOI] [PubMed] [Google Scholar]
- Wanunu M.; Sutin J.; Meller A. DNA Profiling Using Solid-State Nanopores: Detection of DNA-Binding Molecules. Nano Lett. 2009, 9, 3498–3502. 10.1021/nl901691v. [DOI] [PMC free article] [PubMed] [Google Scholar]
- Cheng B.; Cai X. Q.; Miao Q.; Wang Z. H.; Hu M. L. Selective Interactions Between 5-fluorouracil Prodrug Enantiomers and DNA Investigated with Voltammetry and Molecular Docking Simulation. Int. J. Electrochem. Sci. 2014, 9, 1597–1607. [Google Scholar]
- Yang F.; Nickols N. G.; Li B. C.; Marinov G. K.; Said J. W.; Dervan P. B. Antitumor Activity of a Pyrrole-imidazole Polyamide. Proc. Natl. Acad. Sci. U.S.A. 2013, 110, 1863–1868. 10.1073/pnas.1222035110. [DOI] [PMC free article] [PubMed] [Google Scholar]
- Dervan P. Molecular recognition of DNA by small molecules. Bioorg. Med. Chem. 2001, 9, 2215–2235. 10.1016/s0968-0896(01)00262-0. [DOI] [PubMed] [Google Scholar]
- Almaqwashi A. A.; Zhou W.; Naufer M. N.; Riddell I. A.; Yilmaz Ö. H.; Lippard S. J.; Williams M. C. DNA intercalation facilitates efficient DNA-targeted covalent binding of phenanthriplatin. J. Am. Chem. Soc. 2019, 141, 1537–1545. 10.1021/jacs.8b10252. [DOI] [PMC free article] [PubMed] [Google Scholar]
- Palom Y.; Suresh Kumar G.; Tang L.-Q.; Paz M. M.; Musser S. M.; Rockwell S.; Tomasz M. Relative toxicities of DNA cross-links and monoadducts: new insights from studies of decarbamoyl mitomycin C and mitomycin C. Chem. Res. Toxicol. 2002, 15, 1398–1406. 10.1021/tx020044g. [DOI] [PubMed] [Google Scholar]
- Kellett A.; Molphy Z.; Slator C.; McKee V.; Farrell N. P. Molecular methods for assessment of non-covalent metallodrug–DNA interactions. Chem. Soc. Rev. 2019, 48, 971–988. 10.1039/c8cs00157j. [DOI] [PMC free article] [PubMed] [Google Scholar]
- Geng L.; Yu X.; Li Y.; Wang Y.; Wu Y.; Ren J.; Xue F.; Yi T. Instant hydrogel formation of terpyridine-based complexes triggered by DNA via non-covalent interaction. Nanoscale 2019, 11, 4044–4052. 10.1039/c8nr08532c. [DOI] [PubMed] [Google Scholar]
- Zhao B.; Watanabe G.; Morten M. J.; Reid D. A.; Rothenberg E.; Lieber M. R. The essential elements for the noncovalent association of two DNA ends during NHEJ synapsis. Nat. Commun. 2019, 10, 3588. 10.1038/s41467-019-11507-z. [DOI] [PMC free article] [PubMed] [Google Scholar]
- Anu D.; Naveen P.; VijayaPandiyan B.; Frampton C. S.; Kaveri M. V. An unexpected mixed valence tetranuclear copper (I/II) complex: Synthesis, structural characterization, DNA/protein binding, antioxidant and anticancer properties. Polyhedron 2019, 167, 137–150. 10.1016/j.poly.2019.04.021. [DOI] [Google Scholar]
- Tanzadehpanah H.; Mahaki H.; Samadi P.; Karimi J.; Moghadam N. H.; Salehzadeh S.; Dastan D.; Saidijam M. Anticancer activity, calf thymus DNA and human serum albumin binding properties of Farnesiferol C from Ferula pseudalliacea. J. Biomol. Struct. Dyn. 2019, 37, 2789–2800. 10.1080/07391102.2018.1497543. [DOI] [PubMed] [Google Scholar]
- Mansour A. M.; Radacki K. Antimicrobial properties of half-sandwich Ir (iii) cyclopentadienyl complexes with pyridylbenzimidazole ligands. Dalton Trans. 2020, 49, 4991. 10.1039/d0dt00451k. [DOI] [PubMed] [Google Scholar]
- Lungu C. N.; Bratanovici B. I.; Grigore M. M.; Antoci V.; Mangalagiu I. I. Hybrid imidazole-pyridine derivatives: An approach to novel anticancer DNA intercalators. Curr. Med. Chem. 2020, 27, 154–169. 10.2174/0929867326666181220094229. [DOI] [PubMed] [Google Scholar]
- Palmucci J.; Mahmudov K. T.; Guedes da Silva M. F. C.; Marchetti F.; Pettinari C.; Petrelli D.; Vitali L. A.; Quassinti L.; Bramucci M.; Lupidi G.; Pombeiro A. J. L. DNA and BSA binding, anticancer and antimicrobial properties of Co (II), Co (II/III), Cu (II) and Ag (I) complexes of arylhydrazones of barbituric acid. RSC Adv. 2016, 6, 4237–4249. 10.1039/c5ra20157h. [DOI] [Google Scholar]
- Pindur U.; Fischer G. DNA complexing minor groove-binding ligands: perspectives in antitumour and antimicrobial drug design. Curr. Med. Chem. 1996, 3, 379–406. [Google Scholar]
- Saha I.; Kumar G. S. Spectroscopic characterization of the interaction of phenosafranin and safranin O with double stranded, heat denatured and single stranded calf thymus DNA. J. Fluoresc. 2011, 21, 247–255. 10.1007/s10895-010-0712-3. [DOI] [PubMed] [Google Scholar]
- Kumar M.; Kaushik M.; Chaudhary S.; Kukreti S. Spectroscopic studies of the binding interactions of phenothiazininum dyes (Thionine Acetate, Azure A and Azure B) with Calf-thymus DNA. J. Drug Metab. Toxicol. 2016, 7, 1–7. 10.4172/2157-7609.1000214. [DOI] [Google Scholar]
- Shahabadi N.; Akbari A.; Jamshidbeigi M.; Khodarahmi R. Synthesis, Characterization, Molecular Modeling, and DNA Interaction Studies of Copper Complex Containing Food Additive Carmoisine Dye. Nucleosides, Nucleotides Nucleic Acids 2016, 35, 315–333. 10.1080/15257770.2016.1163378. [DOI] [PubMed] [Google Scholar]
- Afzal M.; Ghosh S.; Das S.; Chattopadhyay N. Endogenous activation-induced delivery of a bioactive photosensitizer from a micellar carrier to natural DNA. J. Phys. Chem. B 2016, 120, 11492–11501. 10.1021/acs.jpcb.6b08283. [DOI] [PubMed] [Google Scholar]
- Maurye P.; Basu A.; Biswas J. K.; Bandyopadhyay T. K. Electrophoresis-staining apparatus for DNA agarose gels with solution exchange and image acquisition. Instrum. Sci. Technol. 2017, 45, 49–61. 10.1080/10739149.2016.1206926. [DOI] [Google Scholar]
- Zarrintaj P.; Ahmadi Z.; Hosseinnezhad M.; Saeb M. R.; Laheurte P.; Mozafari M. Photosensitizers in medicine: Does nanotechnology make a difference?. Mater. Today: Proc. 2018, 5, 15836–15844. 10.1016/j.matpr.2018.05.082. [DOI] [Google Scholar]
- Shi C.; Wu J. B.; Pan D. Review on near-infrared heptamethine cyanine dyes as theranostic agents for tumor imaging, targeting, and photodynamic therapy. J. Biomed. Opt. 2016, 21, 050901. 10.1117/1.jbo.21.5.050901. [DOI] [PubMed] [Google Scholar]
- Cheng H.-B.; Cui Y.; Wang R.; Kwon N.; Yoon J. The development of light-responsive, organic dye based, supramolecular nanosystems for enhanced anticancer therapy. Coord. Chem. Rev. 2019, 392, 237–254. 10.1016/j.ccr.2019.04.004. [DOI] [Google Scholar]
- Venugopal N.; Krishnamurthy G.; Bhojya Naik H. S.; Manohara J. D. DNA Binding, Molecular Docking and Antimicrobial Evaluation of Novel Azo Dye Ligand and Their Metal Complexes. J. Inorg. Organomet. Polym. Mater. 2020, 30, 2608–2625. 10.1007/s10904-019-01394-8. [DOI] [Google Scholar]
- El-Ghamry H. A.; Fathalla S. K.; Gaber M. Synthesis, structural characterization and molecular modelling of bidentate azo dye metal complexes: DNA interaction to antimicrobial and anticancer activities. Appl. Organomet. Chem. 2018, 32, e4136 10.1002/aoc.4136. [DOI] [Google Scholar]
- Islam M. M.; Chakraborty M.; Pandya P.; Al Masum A.; Gupta N.; Mukhopadhyay S. Binding of DNA with Rhodamine B: Spectroscopic and molecular modeling studies. Dyes Pigm. 2013, 99, 412–422. 10.1016/j.dyepig.2013.05.028. [DOI] [Google Scholar]
- Masum A. A.; Chakraborty M.; Pandya P.; Halder U. C.; Islam M. M.; Mukhopadhyay S. Thermodynamic study of rhodamine 123-calf thymus DNA interaction: determination of calorimetric enthalpy by optical melting study. J. Phys. Chem. B 2014, 118, 13151–13161. 10.1021/jp509326r. [DOI] [PubMed] [Google Scholar]
- Al Masum A.; Chakraborty M.; Ghosh S.; Laha D.; Karmakar P.; Islam M. M.; Mukhopadhyay S. Biochemical activity of a fluorescent dye rhodamine 6G: Molecular modeling, electrochemical, spectroscopic and thermodynamic studies. J. Photochem. Photobiol., B 2016, 164, 369–379. 10.1016/j.jphotobiol.2016.10.002. [DOI] [PubMed] [Google Scholar]
- Yang Y.-I.; Hong H.-Y.; Lee I.-S.; Bai D.-G.; Yoo G.-S.; Choi J.-K. Detection of DNA using a visible dye, Nile blue, in electrophoresed gels. Anal. Biochem. 2000, 280, 322–324. 10.1006/abio.2000.4537. [DOI] [PubMed] [Google Scholar]
- Chen Q.-y.; Li D.-h.; Yang H.-h.; Zhu Q.-z.; Xu J.-g.; Zhao Y. Interaction of a novel red-region fluorescent probe, Nile blue, with DNA and its application to nucleic acids assay. Analyst 1999, 124, 901–906. 10.1039/a901174i. [DOI] [PubMed] [Google Scholar]
- Van Staveren H. J.; Speelman O. C.; Witjes M. J. H.; Cincotta L.; Star W. M. Fluorescence Imaging and Spectroscopy of Ethyl Nile Blue A in Animal Models of (Pre) malignancies. Photochem. Photobiol. 2001, 73, 32–38. . [DOI] [PubMed] [Google Scholar]
- Georgakoudi I.; Foster T. H. Effects of the subcellular redistribution of two nile blue derivatives on photodynamic oxygen consumption. Photochem. Photobiol. 1998, 68, 115–122. 10.1111/j.1751-1097.1998.tb03261.x. [DOI] [PubMed] [Google Scholar]
- Lin C.-W.; Shulok J. R.; Kirley S. D.; Bachelder C. M.; Flotte T. J.; Sherwood M. E.; Cincotta L.; Foley J. W. Photodynamic destruction of lysosomes mediated by Nile blue photosensitizers. Photochem. Photobiol. 1993, 58, 81–91. 10.1111/j.1751-1097.1993.tb04907.x. [DOI] [PubMed] [Google Scholar]
- Morgan J.; Potter W. R.; Oseroff A. R. Comparison of photodynamic targets in a carcinoma cell line and its mitochondrial DNA-deficient derivative. Photochem. Photobiol. 2000, 71, 747–757. . [DOI] [PubMed] [Google Scholar]
- Singh G.; Espiritu M.; Shen X. Y.; Hanlon J. G.; Rainbow A. J. In vitro induction of PDT resistance in HT29, HT1376 and SK-NMC cells by various photosensitizers. Photochem. Photobiol. 2001, 73, 651–656. . [DOI] [PubMed] [Google Scholar]
- Dezhampanah H.; Firouzi R.; Darvishi S. Spectroscopic and molecular docking investigation of polynucleotides and DNA binding affinity to Nile blue dye. Biotech. Histochem. 2019, 94, 290–297. 10.1080/10520295.2018.1562090. [DOI] [PubMed] [Google Scholar]
- Mitra R. K.; Sinha S. S.; Pal S. K. Interactions of Nile Blue with micelles, reverse micelles and a genomic DNA. J. Fluoresc. 2008, 18, 423–432. 10.1007/s10895-007-0282-1. [DOI] [PubMed] [Google Scholar]
- Gattuso H.; Besancenot V.; Grandemange S.; Marazzi M.; Monari A. From non-covalent binding to irreversible DNA lesions: nile blue and nile red as photosensitizing agents. Sci. Rep. 2016, 6, 28480. 10.1038/srep28480. [DOI] [PMC free article] [PubMed] [Google Scholar]
- Ju H.; Ye Y.; Zhu Y. Interaction between nile blue and immobilized single-or double-stranded DNA and its application in electrochemical recognition. Electrochim. Acta 2005, 50, 1361–1367. 10.1016/j.electacta.2004.08.024. [DOI] [Google Scholar]
- Hevener K. E.; Zhao W.; Ball D. M.; Babaoglu K.; Qi J.; White S. W.; Lee R. E. Validation of Molecular Docking Programs for Virtual Screening against Dihydropteroate Synthase. J. Chem. Inf. Model. 2009, 49, 444–460. 10.1021/ci800293n. [DOI] [PMC free article] [PubMed] [Google Scholar]
- Wahbi A. M.; Ebel S. The use of the first-derivative curves of absorption spectra in quantitative analysis. Anal. Chim. Acta 1974, 70, 57–63. 10.1016/s0003-2670(01)82910-x. [DOI] [Google Scholar]
- Redasani V. K.; Patel P. R.; Marathe D. Y.; Chaudhari S. R.; Shirkhedkar A. A.; Surana S. J. A Review on derivative UV-spectrophotometry analysis of drugs in pharmaceutical formulations and biological samples review. J. Chil. Chem. Soc. 2018, 63, 4126–4134. 10.4067/s0717-97072018000304126. [DOI] [Google Scholar]
- Debnath C.; Shil A.; Hussain S. A.; Bhattacharjee D. Effect of DNA in controlling the H-dimeric sites of Nile Blue Chloride (NBC) in ultra-thin film. Mater. Today: Proc. 2018, 5, 2345–2351. 10.1016/j.matpr.2017.09.240. [DOI] [Google Scholar]
- Record M. T.; Anderson C. F.; Lohman T. M. Thermodynamic analysis of ion effects on the binding and conformational equilibria of proteins and nucleic acids: the roles of ion association or release, screening, and ion effects on water activity. Q. Rev. Biophys. 1978, 11, 103–178. 10.1017/s003358350000202x. [DOI] [PubMed] [Google Scholar]
- Islam M. M.; Chowdhury S. R.; Kumar G. S. Spectroscopic and calorimetric studies on the binding of alkaloids berberine, palmatine and coralyne to double stranded RNA polynucleotides. J. Phys. Chem. B 2009, 113, 1210–1224. 10.1021/jp806597w. [DOI] [PubMed] [Google Scholar]
- Dragan A. I.; Read C. M.; Crane-Robinson C. Enthalpy–entropy compensation: the role of solvation. Eur. Biophys. J. 2017, 46, 301–308. 10.1007/s00249-016-1182-6. [DOI] [PMC free article] [PubMed] [Google Scholar]
- Oliveira H. P. M. D.; Gehlen M. H. Time resolved fluorescence anisotropy of basic dyes bound to poly (methacrylic acid) in solution. J. Braz. Chem. Soc. 2003, 14, 738–743. 10.1590/s0103-50532003000500007. [DOI] [Google Scholar]
- Jen-Jacobson L.; Engler L. E.; Jacobson L. A. Structural and Thermodynamic strategies for site-specific DNA binding proteins. Structure 2000, 8, 1015–1023. 10.1016/s0969-2126(00)00501-3. [DOI] [PubMed] [Google Scholar]
- Chaires J. B. A thermodynamic signature for drug-DNA binding mode. Arch. Biochem. Biophys. 2006, 453, 26–31. 10.1016/j.abb.2006.03.027. [DOI] [PubMed] [Google Scholar]
- Chaires J. B. Energetic of drug DNA interactions. Biopolymers 1997, 44, 201–215. . [DOI] [PubMed] [Google Scholar]
- Haq I. Thermodynamics of drug DNA interactions. Arch. Biochem. Biophys. 2002, 403, 1–15. 10.1016/s0003-9861(02)00202-3. [DOI] [PubMed] [Google Scholar]
- Leng F.; Chaires J. B.; Waring M. J. Energetics of echinomycin binding to DNA. Nucleic Acids Res. 2003, 31, 6191–6197. 10.1093/nar/gkg826. [DOI] [PMC free article] [PubMed] [Google Scholar]
- Szumilak M.; Merecz A.; Strek M.; Stanczak A.; Inglot T.; Karwowski B. DNA interaction studies of selected polyamine conjugates. Int. J. Mol. Sci. 2016, 17, 1560. 10.3390/ijms17091560. [DOI] [PMC free article] [PubMed] [Google Scholar]
- Nafisi S.; Saboury A. A.; Keramat N.; Neault J.-F.; Tajmir-Riahi H.-A. Stability and structural features of DNA intercalation with ethidium bromide, acridine orange and methylene blue. J. Mol. Struct. 2007, 827, 35–43. 10.1016/j.molstruc.2006.05.004. [DOI] [Google Scholar]
- Tanious F. A.; Veal J. M.; Buczak H.; Ratmeyer L. S.; Wilson W. D. DAPI (4’, 6-diamidino-2-phenylindole) binds differently to DNA and RNA: minor-groove binding at AT sites and intercalation at AU sites. Biochemistry 1992, 31, 3103–3112. 10.1021/bi00127a010. [DOI] [PubMed] [Google Scholar]
- Trotta E.; D’Ambrosio E.; Del Grosso N.; Ravagnan G.; Cirilli M.; Paci M. 1H NMR study of [d (GCGATCGC)] 2 and its interaction with minor groove binding 4’, 6-diamidino-2-phenylindole. J. Biol. Chem. 1993, 268, 3944–3951. 10.1016/s0021-9258(18)53563-8. [DOI] [PubMed] [Google Scholar]
- Ali M. S.; Farah M. A.; Al-Lohedan H. A.; Al-Anazi K. M. Comprehensive exploration of the anticancer activities of procaine and its binding with calf thymus DNA: a multi spectroscopic and molecular modelling study. RSC Adv. 2018, 8, 9083–9093. 10.1039/c7ra13647a. [DOI] [PMC free article] [PubMed] [Google Scholar]
- Jafari F.; Baghayi H.; Lavaee P.; Hadizadeh F.; Soltani F.; Moallemzadeh H.; Mirzaei S.; Aboutorabzadeh S. M.; Ghodsi R. Design, synthesis and biological evaluation of novel benzo-and tetrahydrobenzo-[h] quinoline derivatives as potential DNA-intercalating antitumor agents. Eur. J. Med. Chem. 2019, 164, 292–303. 10.1016/j.ejmech.2018.12.060. [DOI] [PubMed] [Google Scholar]
- Ha J.-H.; Spolar R. S.; Record M. T. Jr. Role of the hydrophobic effect in stability of site-specific protein-DNA complexes. J. Mol. Biol. 1989, 209, 801–816. 10.1016/0022-2836(89)90608-6. [DOI] [PubMed] [Google Scholar]
- Haque R.; Mohammad M.; Islam M. M. Molecular docking an important tool for drug desining. Mod. Apro. Drug Des. 2018, 1, 1–9. 10.31031/MADD.2018.01.000518. [DOI] [Google Scholar]
Associated Data
This section collects any data citations, data availability statements, or supplementary materials included in this article.