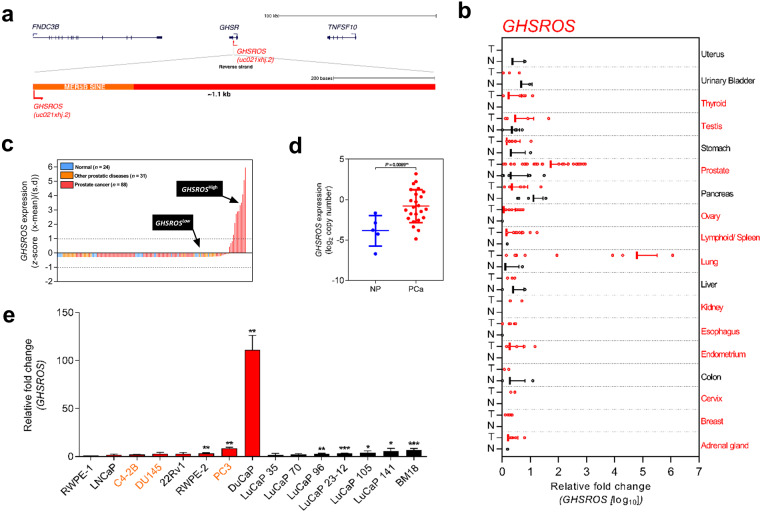
Figure 1. Overview of the lncRNA GHSROS and its expression in cancer.
(A) The GHSR and GHSROS gene loci. GHSR exons (black), GHSROS exon (red), repetitive elements (orange), introns (lines). (B) GHSROS expression in 19 cancers (TissueScan Cancer Survey Tissue qPCR panel). N (black) denotes normal tissue; T tumor (red). For each cancer, data are expressed as mean fold change using the comparative 2−ΔΔCt method against a non-malignant control tissue. Normalized to β-actin (ACTB). (C) Relative gene expression of GHSROS in OriGene cDNA panels of tissues from normal prostate (n = 24; blue), primary prostate cancer (n = 88; red), and other prostatic diseases (n = 31; orange). Determined by qRT-PCR, normalized to ribosomal protein L32 (RPL32), and represented as standardized expression values (Z-scores). (D) GHSROS expression in an Andalusian Biobank prostate tissue cohort. Absolute expression levels were determined by qRT-PCR and adjusted by a normalization factor calculated from the expression levels of three housekeeping genes (HPRT, ACTB, and GAPDH). NP denotes non-malignant prostate. *P ≤ 0.05, Mann–Whitney-Wilcoxon test. (E) Expression of GHSROS in immortalized, cultured cell lines and patient-derived xenograft (PDX) lines. Mean ± s.e.m. (n = 3). *P ≤ 0.05, **P ≤ 0.01, *** P ≤ 0.001, Student’s t-test. Normalized as in (b) to the RWPE-1 non-malignant cell line. Androgen-independent lines are labeled in orange.

