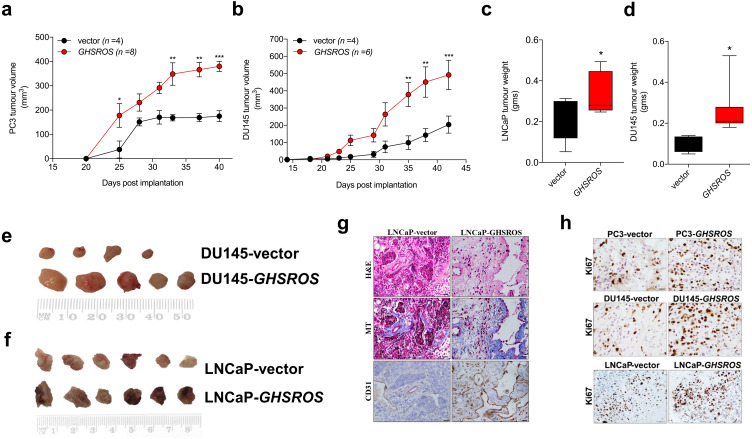
Figure 4. GHSROS promotes human prostate cancer cell line growth in vivo.
(A) Time course for PC3-GHSROS (n = 8) and vector control (n = 4) xenograft tumor volumes. (B) DU145-GHSROS (n = 6) and vector control (n = 4). Mean ± s.e.m. *P ≤ 0.05, **P ≤ 0.01, ***P ≤ 0.001, two-way ANOVA with Bonferonni’s post hoc analysis. Tumors were measured with digital calipers. (C) Tumor weights of LNCaP ( GHSROS-overexpressing n = 9, vector n = 8) or (D) DU145. *P ≤ 0.05, Mann–Whitney-Wilcoxon test. (E) Size comparisons of DU145 (top panel) and (F) LNCaP (bottom panel) xenografts overexpressing GHSROS or empty vector. (G) Representative morphology of LNCaP xenografts overexpressing GHSROS or empty vector. Tissue was stained with hematoxylin and eosin (H&E), Masson’s Trichrome (MT; collagen; blue) and CD31 (endothelial marker; brown immunoreactivity). Scale bar = 20 µm. (H) Representative Ki67 immunostaining of PC3 xenografts, DU145 xenografts, and LNCaP xenografts. Scale = 20 µm.

