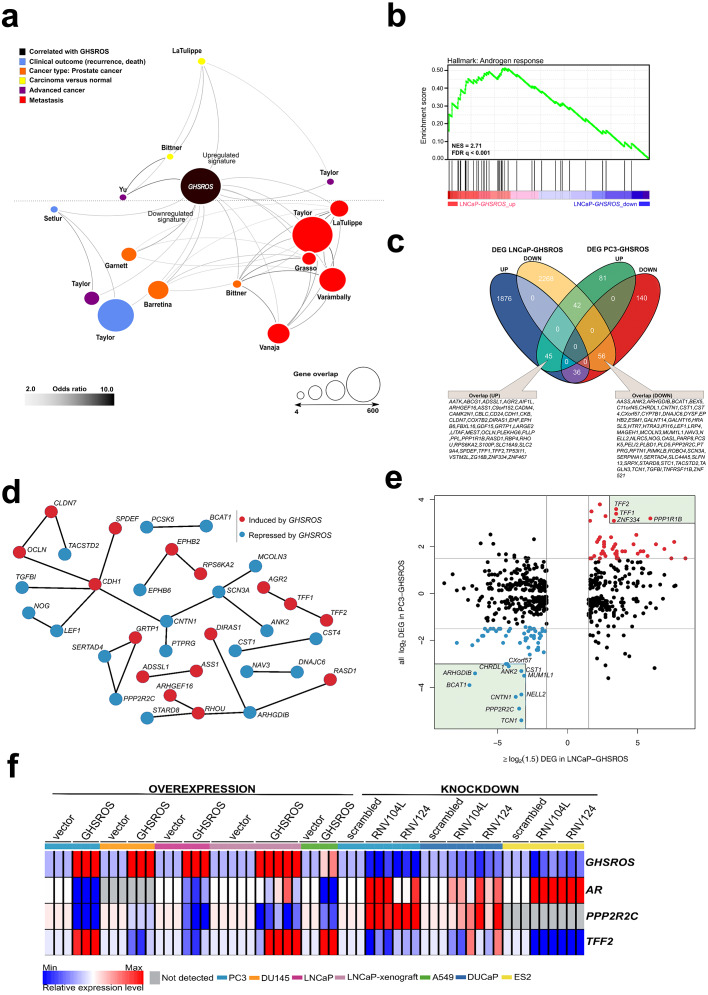
Figure 5. GHSROS overexpression modulates the expression of cancer-associated genes.
(A) Oncomine network representation of genes differentially expressed by cultured PC3-GHSROS cells visualized using Cytoscape. Node sizes (gene overlap) reflect the number of genes per molecular concept. Nodes are colored according to concept categories indicated in the left corner. Edges connect enriched nodes (odds ratio ≥ 3.0) and darker edge shading indicates a higher odds ratio. (B) Gene set enrichment analysis (GSEA) of genes differentially expressed by LNCaP-GHSROS xenografts reveals enrichment for the androgen response. The normalized enrichment score (NES) and GSEA false-discovery corrected P-value (Q) are indicated. (C) Venn diagram of differentially expressed genes (DEG) in LNCaP-GHSROS and PC3-GHSROS cells. Symbols of 101 overlapping genes are indicated in text boxes. (D) Interaction of 101 genes differentially expressed in PC3-GHSROS and LNCaP-GHSROS cells (see (C)). Lines represent protein-protein interaction networks from the STRING database. Genes induced (red) or repressed (blue) by GHSROS-overexpression are indicated. (E) Gene expression scatter plot comparing GHSROS-overexpressing PC3 and LNCaP cells. Differentially expressed genes (DEGs) in both datasets shown in red (induced) and blue (repressed); of which ≥ 8-fold (log2 cutoff at −3 and 3) DEGs are highlighted by a green box. (F) Heat map of gene expression in GHSROS-perturbed cells. Each row shows the relative expression of a single gene and each column a sample (biological replicate). Fold-enrichment of each gene normalized to RPL32 and compared to empty vector control (overexpression) or scrambled control (LNA-ASO knockdown). Fold-changes were log2-transformed and are displayed in the heat map as the relative expression of a gene in a sample compared to all other samples (Z-score).

