

Abstract
Purpose
To identify baseline characteristics of adults with chronic low back pain (cLBP) that predict response (i.e., a clinically important improvement) and/or modify treatment effect across three nonpharmacologic interventions.
Design
Secondary analysis of a randomized controlled trial.
Setting
Academic safety net hospital and seven federally qualified community health centers.
Subjects
Adults with cLBP (N = 299).
Methods
We report patient characteristics that were predictors of response and/or modified treatment effect across three 12-week treatments: yoga, physical therapy [PT], and a self-care book. Using preselected characteristics, we used logistic regression to identify predictors of “response,” defined as a ≥30% improvement in the Roland Morris Disability Questionnaire. Then, using “response” as our outcome, we identified baseline characteristics that were treatment effect modifiers by testing for statistical interaction (P < 0.05) across two comparisons: 1) yoga-or-PT vs self-care and 2) yoga vs PT.
Results
Overall, 39% (116/299) of participants were responders, with more responders in the yoga-or-PT group (42%) than the self-care (23%) group. There was no difference in proportion responding to yoga (48%) vs PT (37%, odds ratio [OR] = 1.5, 95% confidence interval = 0.88 − 2.6). Predictors of response included having more than a high school education, a higher income, employment, few depressive symptoms, lower perceived stress, few work-related fear avoidance beliefs, high pain self-efficacy, and being a nonsmoker. Effect modifiers included use of pain medication and fear avoidance beliefs related to physical activity (both P = 0.02 for interaction). When comparing yoga or PT with self-care, a greater proportion were responders among those using pain meds (OR = 5.3), which differed from those not taking pain meds (OR = 0.94) at baseline. We also found greater treatment response among those with lower (OR = 7.0), but not high (OR = 1.3), fear avoidance beliefs around physical activity.
Conclusions
Our findings revealed important subgroups for whom referral to yoga or PT may improve cLBP outcomes.
Keywords: Chronic Low Back Pain, Yoga, Physical Therapy, Primary Care, Predictor of Response, Effect Modification, Health Disparities
Introduction
Recent clinical practice guidelines from the American College of Physicians recommend multiple nonpharmacologic treatments as safe and effective first-line therapy for chronic low back pain (cLBP) [1]. However, patients may respond differently to treatments [2]. Determining who benefits from what treatment will help guide care. This information may be particularly useful in primary care settings where patients and providers are potentially overwhelmed by a long list of similarly effective treatment options [3, 4].
Yoga, a mind and body practice that includes postures, breathing, meditation, and relaxation, is increasingly popular in the United States and is often practiced in groups [5]. The most common nonpharmacologic referral from primary care physicians for adults with cLBP is to physical therapy (PT), where physical therapists tailor treatment to individuals during one-on-one sessions [6]. Aerobic exercise and strength training are important and common components of PT. While systematic reviews suggest that yoga [7, 8] and PT [9] improve back-related pain and physical function, there is little guidance on which approach may be most effective for a particular patient.
One focus of this paper is to identify those patient characteristics that predict a clinically meaningful improvement in cLBP, which we call “predictors of response.” This is in part based on the National Institutes of Health (NIH) Task Force on Research Standards for Chronic Low Back Pain, which recommended the use of responder analyses to identify individuals who have a clinically meaningful improvement, for example, a 30% improvement in back-related physical function [10–12]. Baseline characteristics can be used to predict negative or positive clinical outcomes [13]. For example, in studies of PT, predictors of negative outcomes (e.g., chronicity, no improvement) include referred leg pain, catastrophizing, fear, anxiety, and depression [14]. Similarly, predictors of positive outcomes have been identified in studies of yoga [15, 16] and particular PT treatments, for example, flexion/extension exercises [17–19]. This implies that some factors may generally predict favorable outcomes, although this information may not help clinicians choose between treatments.
It may be more interesting and useful to understand whether characteristics can define subgroups that may respond differently to particular treatments, which we term “effect modification.” Thus, a second focus of this paper is to identify treatment effect modifiers, which are baseline characteristics that influence outcomes by interacting with the treatment received. Characteristics that are treatment effect modifiers can be used to delineate subgroups of patients that are more or less likely to achieve a 30% improvement (i.e., response) in physical function across different interventions (e.g., yoga, PT, and self-care) [13]. Identifying subgroups that guide treatment is a longstanding priority for low back pain research agendas [10, 20]. Such subgroups can help inform common questions in primary care settings: Which patients will do well with self-care only? Who may need more structured or supervised treatment? Who will do better with a particular treatment (e.g., yoga or PT)? Yet, treatment effect modification analyses are challenging, as they require measurement of baseline factors of interest and a large sample size. Thus, few clinical trials have evaluated effect modifiers of cLBP treatments [21, 22], and information on effect modifiers from clinical trials comparing similarly effective nonpharmacologic treatments is particularly scant.
The Back to Health randomized controlled trial, which recruited participants with cLBP from low-income and racially diverse communities, found yoga to be noninferior to PT for improving back-specific physical function and reducing pain [23, 24]. The purpose of these secondary analyses was to address two additional important clinical questions: First, what pretreatment characteristics are important predictors of response in this understudied and underserved population? Second, what pretreatment characteristics are effect modifiers in the following two comparisons: 1) yoga or PT compared with a self-care book and 2) yoga vs PT.
Methods
Study Design
This is a secondary analysis of a three-arm clinical trial where adults with cLBP were randomized to yoga, PT, or self-care in a 2:2:1 ratio [23, 24]. The sample size for the original study (N = 320) was determined by power calculations for the primary aim, which tested whether yoga was noninferior to physical therapy on pain and back-related physical function outcomes. The methods [23] and primary results [24] are described in detail elsewhere and summarized briefly below. Participants were recruited from predominantly low-income racially diverse neighborhoods in Boston, Massachusetts. This study was approved by the Boston University Medical Campus Institutional Review Board. All participants provided written informed consent.
Participants
The complete set of inclusion and exclusion criteria were reported previously [23]. Eligible participants were English-speaking adults (ages 18–64) who had low back pain persisting ≥12 weeks with an average pain intensity in the previous week ≥4 on an 11-point numerical rating scale. Individuals with suspected or confirmed specific causes of back pain were excluded, for example, spinal stenosis, radiculopathy, or those who had red flags indicating serious pathology (e.g., cancer, infection). Individuals were also excluded if they had an active or planned workers’ compensation, disability, or personal injury claim. For this secondary analysis, we additionally excluded 21 participants with missing data at 12 weeks on our main outcome, the Roland Morris Disability Questionnaire.
Study Interventions
Our manualized hatha yoga intervention consisted of 12 group-based weekly 75-minute classes incorporating poses, relaxation/meditation exercises, yoga breathing, and yoga philosophy [23–26]. Thirty minutes of daily home practice was encouraged and supported with supplies (yoga mat, blocks, instructional DVD/manual).
Our manualized PT intervention consisted of 15 one-on-one 60-minute appointments over 12 weeks [23, 24]. During each appointment, the physical therapist utilized the Treatment-Based Classification Method and supervised aerobic exercise [27, 28]. Participants with a high score on the Fear Avoidance Beliefs Questionnaire (FABQ) work subscale (>29) received The Back Book [29], a brief educational resource. Physical therapists reinforced its principles to lower fear avoidance [29]. Physical therapists provided written instructions and supplies for exercises to be practiced daily at home [23]. Participants were encouraged by physical therapists to log these prescribed exercises and the number of repetitions completed.
Participants receiving the self-care intervention were provided a copy of The Back Pain Helpbook [30], a comprehensive resource describing evidence-based self-management strategies for cLBP, including stretching, strengthening, and the role of psychological and social factors. Every three weeks, participants received a one- to two-page newsletter summarizing assigned chapters and a five- to 10-minute check-in telephone call from staff.
Data Collection
For this exploratory analysis, we identified patient-level characteristics from multiple domains (sociodemographic, general health, back-related, psychological, and treatment expectations) [31]. Data were collected with surveys administered by study staff blinded to treatment. We restricted our investigation to characteristics previously identified, or clinically plausible, as predictors of response or effect modifiers [13, 21, 22]. Characteristics were measured before randomization with valid and reliable instruments [13, 23].
Sociodemographic Characteristics
Baseline sociodemographic characteristics were age (18–44, 45–65), sex, race (white, nonwhite), ethnicity (Hispanic, non-Hispanic), household income (≤$30,000, >$30,000), education (high school or less, more than high school), and current employment (employed, unemployed).
General Health Measures
General health characteristics were obesity (body mass index [BMI] >30 kg/m2), current smoker, and any exercise in the previous week. We characterized participants as having multiple chronic comorbidities if they self-reported two or more of the following conditions: hypertension, osteoarthritis, neck pain, fibromyalgia, depression, other psychiatric disorder, diabetes, or chronic obstructive pulmonary disease.
Back-Related Measures
We used the 11-point numeric rating scale (0–10) to identify participants with moderate (4–6) or severe (≥7) back pain [32, 33]. We defined medication use as any use of one or more medications in the following categories in the previous week: nonsteroidal anti-inflammatory drugs (NSAIDs), acetaminophen, muscle relaxants, or an opioid medication. Participants reported the number of days of any back pain in the previous three months and activity-limiting back pain in the past month. Each of these measures was dichotomized at the median number of days.
Psychological Measures
Baseline psychological factors included symptoms of depression (≥10 on PHQ-8 [34]) and anxiety (≥10 on the Generalized Anxiety Disorder 7-item questionnaire [GAD-7] [35]). Perceived Stress Scale values were dichotomized using the median score to identify those with elevated perceived stress (≥17 on PSS-10) [36]. Fear avoidance relating to physical activity (>13 on FABQ-PA) and work (>29 on FABQ-W) was identified [37]. Using the Pittsburgh Sleep Quality Index (PSQI) [38], we identified participants with poor sleep (score >5). We classified participants as having maladaptive pain coping skills, using a score ≥14 on the catastrophizing subscale of the Coping Strategies Questionnaire (CSQ) [39], and low to moderate pain self-efficacy, using a score <40 on the Pain Self-Efficacy Questionnaire (PSEQ) [40, 41].
Treatment Expectations
Participants were asked before randomization whether they expected each of the treatment arms would be helpful for their cLBP using an 11-point scale. Those who responded 9 or 10 were considered to have high expectations. We identified concordance in expectations with treatment allocation, for example, someone who expected PT would be helpful and was then randomized to PT.
Definition of a Clinically Important Response
The 23-item modified Roland Morris Disability Questionnaire (RMDQ) is a validated, widely used measure of back-specific physical function, where higher values indicate worse function [42]. Participant response was calculated as the percent change in Roland Morris score from baseline to 12-week follow-up. We defined “response” as achieving a minimal clinically important difference on the RMDQ (≥30% improvement) [11, 12]. The reference group in all analyses was individuals not meeting this response threshold.
Data Analysis
We compared the proportion of responders by baseline characteristics using chi-square and t tests for categorical and continuous variables, respectively. Possible predictors of “response” were selected based on a nominal univariate P value of <0.1. Odds ratios with 95% confidence intervals were calculated for each selected predictor after adjusting for age, baseline RMDQ, and treatment group.
To assess for effect modification, we developed separate logistic regression models for each baseline characteristic to predict “response” as the outcome. Models were adjusted for baseline age and RMDQ and included an interaction term (characteristic*treatment). Each model adjusted for age and baseline RMDQ. We assessed for effect modification in the two following comparisons: 1) yoga or PT vs self-care book or 2) yoga vs PT. We chose these comparisons as they reflect questions patients often ask their primary care providers and have the potential to inform shared decision-making (as illustrated in Appendix Figure 1). For the two comparisons, we generated separate predictor-stratified estimates (odds ratios) of response for each baseline characteristic assessed. To account for zero responders in certain subgroups, where estimates could not be obtained with a standard logistic regression model, we employed Firth’s penalty to estimate the odds ratio and approximate confidence bounds [43, 44]. A statistically significant interaction term (P < 0.05) indicated effect modification. A P value of 0.05 to 0.20 indicated exploratory evidence for effect modification [21, 22].
SAS, version 9.4 (SAS Institute, Cary, NC, USA), was used for all analyses.
Results
Sample Characteristics
Among 299 participants with follow-up data, most were nonwhite (82%), female (66%), and had an annual income of $30,000 or less (64%) (Appendix Table 1). Roughly half were currently employed (45%) at the beginning of the study. The characteristics of those with complete data on RMDQ at 12 weeks (N = 299) were generally similar to those with missing outcome data (N = 21) on sociodemographic and health characteristics, although participants with complete data were more likely to be female than those with missing data (66% vs 38%, P = 0.01) (Appendix Table 2).
Treatment Characteristics
Details on attendance of sessions and home practice participation have been reported previously [24]. Briefly, the median attendance was seven visits and seven sessions for yoga and PT participants, respectively. During the 12-week intervention phase, yoga participants reported practicing at home four days per week (median = 27 minutes). Similarly, PT participants reported practicing home exercises four days per week (median = 4 exercises).
Predictors of a Clinically Important Response
Thirty-nine percent (116/299) of all study participants experienced a clinically meaningful improvement in back-specific physical function at 12 weeks (Figure 1). Predictors of response included being a nonsmoker (vs current smoker, 47% vs 21%, P < 0.0001), not using pain medication (vs using any, 54% vs 32%, P < 0.0001), being employed (vs unemployed, 52% vs 28%, P < 0.0001), income >$30,000 (vs ≤$30,000, 54% vs 31%, P = 0.0002), low/moderate depressive symptoms on the PHQ-8 (vs high, 48% vs 23%, P = 0.0005), lower perceived stress on the PSS-10 (vs higher, 46% vs 32%, P = 0.004), fewer work-related fear avoidance beliefs on the FABQ-W (vs high, 43% vs 17%, P = 0.001), high pain self-efficacy on the PSEQ (vs low/moderate, 49% vs 31%, P = 0.001), and receiving treatment they expected would be helpful, that is, concordance (vs not, 47% vs 33%, P = 0.02) (Appendix Table 3).
Figure 1.

Flow diagram of postintervention response comparisons for yoga, physical therapy, and self-care.
Table 1 shows odds ratios for important factors adjusted for age, baseline RMDQ, and treatment group. These variables are presented out of all the a priori risk factors based on a univariate P value <0.1, and due to having the largest absolute value standardized beta estimates in a multivariate model that included all potential predictors.
Table 1.
Predictors of 30% improvement in back-specific physical function on the Roland Morris Disability Questionnaire among 299 participants
| Baseline Characteristics | Responders, No. (%) | Adjusted,* OR (95% CI) |
|---|---|---|
| Age, per year aged | – | 0.97 (0.95–1.00) |
| Roland Morris, per 1-point increase | – | 0.97 (0.92–1.02) |
| Education | ||
| High school or less | 32/116 (28) | 1.0 |
| More than high school | 81/180 (45) | 2.1 (1.2–3.5) |
| Annual income | ||
| ≤$30,000 | 54/175 (31) | 0.45 (0.26–0.78) |
| >$30,000 | 53/99 (54) | 1.0 |
| Employment | ||
| No | 46/164 (28) | 1.0 |
| Yes | 70/135 (52) | 2.5 (1.5–4.2) |
| Comorbid conditions | ||
| 0–1 | 79/158 (50) | 1.0 |
| ≥2 | 37/141 (26) | 0.43 (0.26–0.71) |
| Current smoker | ||
| No | 97/208 (47) | 1.0 |
| Yes | 19/91 (21) | 0.31 (0.17–0.57) |
| Pain medication use | ||
| None | 48/89 (54) | 1.0 |
| Any | 68/210 (32) | 0.46 (0.27–0.78) |
| Depression symptoms, PHQ-8 | ||
| Low/moderate, 0–9 | 93/192 (48) | 1.0 |
| High, ≥10 | 23/102 (23) | 0.28 (0.15–0.51) |
| Perceived stress, PSS-10 | ||
| Low (<17) | 64/138 (46) | 1.0 |
| High (≥17) | 50/157 (32) | 0.51 (0.31–0.85) |
| Fear avoidance, FABQ physical activity | ||
| Low/moderate, 0–13 | 56/141 (40) | 1.0 |
| High, >13 | 57/155 (37) | 0.85 (0.52–1.4) |
| Fear avoidance, FABQ work | ||
| Low/moderate, 0–29 | 105/246 (43) | 1.0 |
| High-risk, >29 | 7/42 (17) | 0.32 (0.14–0.77) |
| Pain self-efficacy, PSEQ | ||
| Low/moderate (<40) | 51/166 (31) | 0.46 (0.27–0.79) |
| High (≥40) | 65/132 (49) | 1.0 |
| Expectations, concordant | ||
| Received a less “helpful” treatment | 60/180 (33) | 1.0 |
| Received a “helpful” treatment | 56/119 (47) | 1.5 (0.94–2.5) |
| Treatment group | ||
| Yoga | 60/125 (48) | 3.3 (1.6–6.7) |
| PT | 42/113 (37) | 2.2 (1.1–4.5) |
| Self-care | 14/60 (23) | 1.0 |
| Treatment group comparisons of interest | ||
| Yoga or PT vs self-care | – | 2.7 (1.4–5.2) |
| Yoga vs PT | – | 1.5 (0.88–2.6) |
CI = confidence interval; FABQ = Fear Avoidance Beliefs Questionnaire; OR = odds ratio; PHQ-8 = Patient Health Questionnaire; PSEQ = Pain Self-Efficacy Questionnaire; PSS-10 = 10-item Perceived Stress Scale.
Adjusted for baseline age, baseline Roland Morris score, and treatment group.
Treatment Effect Modifiers
In Figure 2, we provide four illustrative examples of baseline characteristics that are neither a predictor of response nor a treatment effect modifier (Figure 2a), that are a predictor of response only (Figure 2b), that are an effect modifier only (Figure 2c), and that are both a predictor of response and an effect modifier (Figure 2d). Table 2 presents the results of separate adjusted regression models to determine treatment effect modification in the following two comparisons.
Figure 2.

Characteristics that are predictors of response and/or treatment effect modifiers, or neither, when comparing yoga or PT with self-care. For each panel, the baseline characteristic is shown as a potential predictor of response on the left and a potential treatment effect modifier on the right. The corresponding P values are from logistic regression models adjusted for age and baseline back-specific physical function on the Roland Morris Disability Questionnaire. In panel a, sex was neither a predictor of response (P = 0.46) nor a treatment effect modifier (P for interaction = 0.69). In panel b, the number of chronic conditions was a predictor of response (P < 0.001) but not a treatment effect modifier (P for interaction = 0.21). In panel c, higher fear avoidance beliefs around physical activity was not a predictor of response (P = 0.60) but was a treatment effect modifier (P for interaction = 0.02). In panel d, baseline pain medicine use was both a predictor of response (P < 0.001) and a treatment effect modifier (P for interaction = 0.02).
Table 2.
Treatment effect modification of 30% improvement in back-specific physical function in 299 participants
| Responders, No. (%) |
||||||||
|---|---|---|---|---|---|---|---|---|
| Characteristic | Sample | Yoga | PT | S-C | Yoga/PT vs S-C | P Value† | Yoga vs PT | P Value† |
| (N = 299) | (N = 125) | (N = 113) | (N = 61) | OR (95% CI)* | OR (95% CI)* | |||
| Education‡ | 0.14 | 0.80 | ||||||
| ≤High school | 116 | 19/49 (39) | 13/49 (27) | 0/18 (0) | 19.5 (1.1–360.3)‡ | 1.6 (0.69–3.9) | ||
| > High school | 180 | 39/74 (53) | 28/63 (44) | 14/43 (33) | 2.0 (0.97–4.2) | 1.4 (0.71–2.9) | ||
| Annual income | 0.55 | 0.78 | ||||||
| ≤$30,000 | 175 | 28/75 (37) | 20/62 (32) | 6/38 (16) | 2.4 (0.82–7.0) | 1.7 (0.68–4.2) | ||
| >$30,000 | 99 | 27/43 (63) | 19/38 (50) | 7/18 (39) | 2.9 (1.1–7.5) | 1.2 (0.58–2.5) | ||
| Employment | 0.39 | 0.64 | ||||||
| No | 135 | 22/66 (33) | 19/66 (29) | 5/32 (16) | 2.4 (0.86–6.7) | 1.2 (0.57–2.5) | ||
| Yes | 164 | 38/59 (64) | 23/47 (49) | 929 (31) | 3.3 (1.4–8.2) | 2.0 (0.87–4.4) | ||
| Comorbid conditions | 0.21 | 0.51 | ||||||
| 0–1 | 158 | 42/72 (58) | 26/58 (45) | 11/28 (39) | 1.8 (0.76–4.2) | 1.7 (0.85–3.6) | ||
| ≥2 | 141 | 18/53 (34) | 16/55 (29) | 3/33 (9) | 4.8 (1.4–16.9) | 1.2 (0.53–2.8) | ||
| Smoker at baseline‡ | 0.25 | 0.69 | ||||||
| No | 208 | 50/89 (56) | 33/76 (43) | 14/43 (33) | 2.2 (1.1–4.6) | 1.6 (0.85–3.0) | ||
| Yes | 91 | 10/36 (28) | 9/37 (24) | 0/18 (0) | 13.3 (0.71–248.7)‡ | 1.3 (0.43–3.6) | ||
| Pain medication use | 0.02 | 0.54 | ||||||
| None | 89 | 24/40 (60) | 15/33 (45) | 9/16 (56) | 0.94 (0.31–2.9) | 1.9 (0.75–5.0) | ||
| Any | 210 | 36/85 (42) | 27/80 (34) | 5/45 (11) | 5.3 (2.0–14.2) | 1.3 (0.70–2.6) | ||
| Depression symptoms | 0.36 | 0.99 | ||||||
| Low/moderate | 192 | 47/82 (57) | 33/71 (46) | 13/39 (33) | 2.5 (1.2–5.3) | 1.6 (0.85–3.2) | ||
| High | 102 | 13/41 (32) | 9/41 (22) | 1/20 (5) | 7.0 (0.87–56.1) | 1.7 (0.61–4.5) | ||
| Perceived stress | 0.94 | 0.73 | ||||||
| Low | 138 | 33/60 (55) | 23/50 (46) | 8/28 (29) | 2.8 (1.1–7.0) | 1.4 (0.65–3.2) | ||
| High | 157 | 26/63 (41) | 18/62 (29) | 6/32 (19) | 2.6 (0.99–7.1) | 1.7 (0.82–3.7) | ||
| Fear avoidance, PA | 0.02 | 0.87 | ||||||
| Low/moderate | 155 | 29/55 (53) | 23/55 (42) | 4/31 (13) | 7.0 (2.2–21.8) | 1.5 (0.69–3.3) | ||
| High | 141 | 30/69 (43) | 18/57 (32) | 9/29 (31) | 1.3 (0.56–3.2) | 1.6 (0.77–3.5) | ||
| Fear avoidance, work | 0.44 | 0.56 | ||||||
| Low/moderate | 246 | 58/110 (53) | 34/85 (40) | 13/51 (25) | 3.0 (1.5–6.1) | 1.7 (0.92–3.0) | ||
| High | 42 | 2/14 (14) | 4/19 (21) | 1/9 (11) | 1.4 (0.14–14.3) | 0.8 (0.12–5.0) | ||
| Pain self-efficacy | 0.21 | 0.75 | ||||||
| Low/moderate | 166 | 27/70 (39) | 17/64 (27) | 7/32 (22) | 1.9 (0.73–4.7) | 1.8 (0.83–3.7) | ||
| High | 132 | 33/55 (60) | 25/48 (52) | 7/29 (24) | 4.3 (1.7–11.2) | 1.5 (0.65–3.3) | ||
| Expectations, yoga | 0.14 | 0.11 | ||||||
| Low/moderate | 178 | 28/73 (38) | 25/69 (36) | 10/36 (28) | 1.7 (0.75–4.0) | 1.0 (0.51–2.1) | ||
| High | 121 | 32/52 (62) | 17/44 (39) | 4/25 (16) | 4.8 (1.6–14.8) | 2.5 (1.1–5.8) | ||
| Expectations, PT | 0.36 | 0.40 | ||||||
| Low/moderate | 158 | 32/66 (48) | 18/58 (31) | 9/34 (26) | 1.9 (0.82–4.5) | 1.9 (0.88–4.0) | ||
| High | 141 | 28/59 (47) | 24/55 (44) | 5/27 (19) | 3.6 (1.3–10.1) | 1.2 (0.56–2.5) | ||
| Expectation, self-care‡ | 0.21 | 0.35 | ||||||
| Low/moderate | 223 | 50/97 (52) | 29/77 (38) | 14/49 (29) | 2.1 (1.0–4.3) | 1.8 (0.94–3.3) | ||
| High | 73 | 10/27 (37) | 12/34 (35) | 0/12 (0) | 15.0 (0.76–295.6)‡ | 0.97 (0.34–2.8) | ||
| Expectations, concordant‡ | 0.06 | 0.33 | ||||||
| No | 180 | 28/73 (38) | 18/58 (31) | 14/49 (29) | 1.5 (0.70–3.0) | 1.2 (0.58–2.6) | ||
| Yes | 119 | 32/52 (62) | 24/55 (44) | 0/12 (0) | 26.4 (1.4–510.1)‡ | 2.1 (0.95–4.6) | ||
CI = confidence interval; PA = physical activity; PT = physical therapy intervention group; S-C = self-care intervention group.
Adjusted for baseline age and Roland Morris.
Test for multiplicative interaction (i.e., statistical effect modification) between baseline characteristics and treatment.
Calculated using logistic regression with Firth’s penalty for zero cells.
Yoga or PT vs Self-care
Participants receiving yoga or PT were more likely to be responders than participants receiving self-care (43% vs 23%, OR = 2.7, 95% CI = 1.4 − 5.2). Two baseline characteristics showed clear evidence of treatment effect modification: pain medication use (P = 0.02) and FABQ-PA (P = 0.02) (Figure 2d and c, respectively). Participants (N = 210) using pain medications at baseline were 5.3 times more likely to be responders at week 12 if they were in the yoga or PT group compared with self-care (38% vs 11%, OR = 5.3, 95% CI = 2.0 − 14.2). In contrast, among 89 participants not taking pain medications, the proportion of responders was not statistically different in yoga or PT compared with self-care (53% vs 56%, OR = 0.94, 95% CI = 0.31 − 2.9). This pattern was consistent for use of individual medication categories (acetaminophen, NSAIDs, and opioids), as shown in Appendix Table 3. Similarly, while 178 participants with low/moderate FABQ-PA scores were more likely to be responders with yoga or PT compared with self-care (47% vs 13%, OR = 7.0, 95% CI = 2.2 − 21.8), this was not observed for 121 participants with initial high FABQ-PA scores (38% vs 31%, OR = 1.3, 95% CI = 0.56 − 3.2). These findings, that pain medication use and fear avoidance beliefs around physical activity were effect modifiers, were also observed after additionally adjusting for baseline pain intensity.
Characteristics with exploratory evidence for effect modification included educational attainment (P = 0.14), patient expectations for yoga (P = 0.14), and having expectations concordant with treatment allocation (P = 0.06). Firth’s penalty was used to estimate odds ratios for strata of two characteristics (i.e., educational attainment, smoking) where there were zero responders in one of the treatment groups (Table 2). For example, among participants with less than a high school education randomized to self-care, zero were responders, compared with a third of those receiving yoga or PT.
Yoga vs PT
Yoga was similarly effective compared with PT (48% vs 37%, OR = 1.5, 95% CI = 0.88 − 2.6). Among 121 participants who expected yoga would be helpful, more benefited from yoga vs PT (63% vs 39%, OR = 2.5, 95% CI = 1.1–5.8). Among those who had lower expectations for yoga, there were similar proportions of responders for yoga and PT (38% vs 36%, OR = 1.0, 95% CI = 0.51–2.1). However, this finding did not meet the criteria for effect modification (P = 0.11). Additionally, this trend was not found among the 141 participants who expected to do well with PT (Table 2). No other potential effect modifiers for the yoga vs PT comparison were identified. Moreover, factors identified as effect modifiers of the yoga or PT vs self-care comparison were not effect modifiers of the yoga vs PT comparison, that is, pain medication use (P = 0.54) and FABQ-PA (P = 0.87) (Figure 3).
Figure 3.

Forest plot of effect modification on the multiplicative scale. Odds ratios indicate likelihood of being a responder. For example, participants using pain medications at baseline were more likely to be responders if they were in the yoga or physical therapy (PT) group compared with self-care group (odds ratio [OR] = 5.3, 95% confidence interval [CI] = 2.0 − 14.2). In contrast, among those not taking pain medications at baseline, the proportion of responders was not statistically different in yoga or PT compared with self-care (OR = 0.94, 95% CI = 0.31 − 2.9).
Discussion
In a predominantly nonwhite low-income sample of 299 adults with cLBP, predictors of response independent of treatment included more than a high school education, higher income, employment, zero or one comorbid chronic conditions, not smoking, not using pain medication, low depressive symptoms, low perceived stress, few work-related fear avoidance beliefs, and higher pain self-efficacy. Participants who received either yoga or PT were more likely to achieve clinically important improvements in physical function compared with self-care. Although this treatment effect was consistent across a range of baseline characteristics, the magnitude of responders in yoga or PT compared with self-care was augmented among participants already using pain medication and those with few fear avoidance beliefs related to physical activity. The only potential effect modifier between yoga and PT was treatment expectation: Participants who expected to do well with yoga did better with yoga than PT.
The average income of our population is well below the US median income, and our study adds important data for this understudied and often underserved population. We observed predictors of response consistent with previous literature; that is, lower socioeconomic status, multiple comorbidities, depression, and smoking are associated with poor response [45–48]. The majority of study participants were nonresponders at the end of the intervention period. Our interventions included predominantly physical and mind–body approaches. Participants with multiple comorbidities, depression, etc., may require a more intensive or comprehensive approach to experience a clinically meaningful improvement, that is, one that not only focuses on back pain, but also targeting behavioral modification and other physical or psychological comorbidities. Although we used only one discipline in each arm (physical therapist, yoga instructor), some evidence suggests that patients with more complex cLBP may benefit from multidisciplinary approaches [49, 50].
Our findings corroborate those of studies suggesting that medication use may modify the effect of treatments for low back pain [21, 22, 51] and other musculoskeletal conditions [52]. Among participants not using pain medications at baseline, the proportion of responders was relatively high for all three treatment groups. Among those using pain medication, we observed a large effect of yoga or PT compared with self-care. Current use of one or more pain medications may be a proxy for more persistent or otherwise severe cLBP where self-care may not be sufficient. Adjusting for baseline pain intensity did not attenuate our findings, and, therefore, alternative explanations should be explored in future research. Early referral to a more structured treatment with a therapist or instructor may improve outcomes.
Fear avoidance beliefs are important predictors of response [53] and may be an important cLBP treatment effect modifier [54]. Participants with lower fear avoidance beliefs around physical activity were much more likely to be responders to yoga (53%) or PT (42%) than self-care (13%). In contrast, among participants who started out with high fear avoidance around physical activity, the proportions of responders to yoga (43%), PT (32%), and self-care (31%) were not statistically different. While the decrease in response rate among yoga and PT in the high–fear avoidance strata may have been expected, our finding that more individuals with high fear avoidance in the self-care group responded compared with those with lower fear is difficult to interpret. The self-care book offers substantial content on exercise and addresses fear related to physical activity. While this may be useful, important, or new information for adults with high fear avoidance related to physical activity, individuals with low baseline fear may have found this content to be less useful. In contrast, the yoga instructor or physical therapist has the opportunity to individualize care, coach adults with cLBP to meet care goals, and teach the patient experientially that increasing their activity appropriately does not necessarily lead to more pain or disability. This encouragement may only be helpful if it overcomes fear avoidance related to physical activity and increases hours of back-related exercise and self-efficacy, which were important mediators of improvement in another study of yoga and stretching for cLBP [55].
A review of treatment effect modifiers in back pain clinical trials identified potential effect modifiers including age, employment, treatment expectations, and educational attainment [21]. Educational attainment has been identified as an effect modifier in a more recent study of cLBP treatment [22] and randomized trials evaluating interventions for osteoarthritis [52] and chronic pain [56]. In our study, when comparing yoga and PT with self-care, educational attainment was the only socioeconomic characteristic identified as a potential effect modifier but was not statistically significant (P for interaction = 0.14). While this finding should be interpreted with caution, it is notable that zero of 18 participants with high school education or less randomized to the self-care book responded. In contrast, roughly a third of the individuals with high school education or less receiving yoga or PT had a clinically meaningful response. Patients with less educational attainment may be unlikely to respond to book-based self-care interventions. This is consistent with a large body of literature about education, health literacy, back pain, and other health outcomes [57, 58]. Having the support of a therapist or instructor may help overcome the barriers to improvement related to lower educational attainment.
Our finding of treatment expectation as a potential effect modifier is also consistent with previously identified effect modifiers of cLBP [21] and osteoarthritis [52] treatment. Paradoxically, among 22 participants who expected to do well with self-care and then were randomized to self-care, none were responders. Furthermore, it appeared that those who expected to do well with yoga were more likely to be responders, especially when they were randomized to yoga. While these findings require replication, it may be reasonable for primary care providers to encourage patients with a strong interest in yoga to pursue it as part of their cLBP care [1].
The principal limitation of this study is a relatively small sample size to investigate back pain subgroups. However, our approach is aligned with recommendations for effect modification analyses using clinical trial data; that is, we evaluated characteristics that were clinically plausible as effect modifiers and were measured with valid instruments before randomization [13, 59]. Despite relatively limited statistical power, we identified statistically significant treatment effect modifiers using the nominal P value of 0.05. As our analyses were exploratory in nature, we did not adjust for multiple comparisons [60]. Importantly, the characteristics demonstrating effect modification (pain medication, fear avoidance) and those trending toward effect modification (e.g., educational attainment, patient expectations) in our study are consistent with previous literature [21, 22, 52, 56]. Nonetheless, our findings need to be validated in a prospective study.
As this was a secondary analysis, we were limited to the information that was collected for the original study. Measures that further characterize cLBP (e.g., duration of pain) and other patient characteristics (e.g., health literacy, history of physical or psychologic trauma, trust in the health system), which may influence clinical outcomes, were not available. Although older age has been identified as a potential effect modifier [21, 61], our sample could not assess this due to enrolling only adults under 65. We excluded individuals who reported a previous radiculopathy and those with an active or planned workers’ compensation claim. Thus, we were unable to assess these potentially influential factors as predictors of response or effect modifiers.
Although loss to follow-up was generally low at the end of the 12-week intervention period (7%), another limitation of our study was the disproportionately high loss to follow-up in the PT arm (12%). This differential loss to follow-up may bias the results seen here, though the direction of this bias is unclear. Previous literature from this study has shown little difference between complete case and imputation-based analyses [24, 62]; therefore, we present only the findings for those with complete outcome data.
The strengths of our study include random allocation of adults to three credible nonpharmacologic cLBP treatments, and our extensive collection of baseline sociodemographic and health information from a diverse sample, which allowed us to explore a wide range of predictor variables. Lastly, we feel confident in our outcome definition, as it was prespecified [23], based on established clinically important differences for cLBP research [11, 12, 23], and aligned with recommendations from the NIH Task Force on Research Standards for Chronic Low Back Pain [10].
Current clinical practice guidelines suggest more than a dozen nonpharmacologic approaches as first-line treatment for cLBP [1]. Use of large data sets, such as claims data or practice-based research networks, may allow for additional opportunities to identify potential effect modifiers that can be used in shared decision-making for managing cLBP. Uniform collection of a minimal data set [10] in future cLBP clinical trials would allow for patient-level meta-analyses that may provide adequate statistical power to explore treatment effect modification across multiple guideline-concordant treatments. A lack of uniform information on baseline characteristics in clinical trials was cited as a key limitation in two recent individual patient-level data meta-analyses exploring effect modification of acupuncture and exercise interventions for low back pain [51, 63].
In conclusion, our findings revealed two important subgroups where referral to yoga or PT may be more likely to improve outcomes compared with an evidence-based self-care book. Adults using pain medications and those with few fear avoidance beliefs around physical activity were more likely to have a clinically meaningful response to yoga or PT compared with self-care. Although yoga and PT appear to be similarly effective, treatment expectations may influence clinical outcomes.
Authors’ Contributions
Drs. Roseen, Gerlovin, and Saper had full access to all of the data in the study and take responsibility for the integrity of the data and the accuracy of the data analysis. Study concept and design: Roseen, Sherman, Delitto, Saper. Acquisition, analysis, or interpretation of data: Roseen, Gerlovin, Felson, Delitto, Sherman, Saper. Drafting of the manuscript: Roseen. Critical revision of the manuscript for important intellectual content: Roseen, Gerlovin, Felson, Delitto, Sherman, Saper. Statistical analysis: Roseen, Gerlovin. Obtained funding: N/A. Administrative, technical, or material support: Roseen, Saper. Study supervision: Roseen, Saper.
Appendices
Appendix Figure 1.
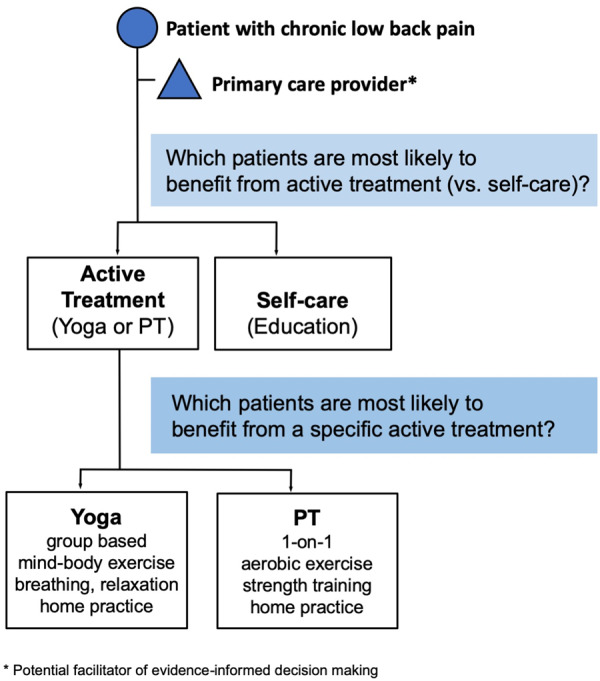
Clinical decision-making tree.
Appendix Table 1.
Baseline characteristics* of analytic sample
| Baseline Characteristics | Total | Yoga | PT | Self-care |
|---|---|---|---|---|
| (N = 299) | (N = 125) | (N = 113) | (N = 61) | |
| Sociodemographic characteristics | ||||
| Age, mean ± SD, y | 46.1 ± 10.7 | 46.7 ± 10.3 | 46.4 ± 11.5 | 44.3 ± 9.97 |
| 18–44 | 117 (39.1) | 50 (40) | 41 (36.3) | 26 (42.6) |
| 45–65 | 182 (60.9) | 75 (60) | 72 (63.7) | 35 (57.4) |
| Female | 196 (65.6) | 72 (57.6) | 82 (72.6) | 42 (68.9) |
| Race, nonwhite | 55 (18.4) | 29 (23.2) | 16 (14.2) | 16 (16.4) |
| Ethnicity, Hispanic | 40/295 (13.6) | 20/124 (16.1) | 14/111 (12.6) | 6/60 (10) |
| Education, >high school | 180/296 (60.8) | 74/123 (60.2) | 63/112 (56.3) | 43/61 (70.5) |
| Currently employed | 135 (45.2) | 59 (47.2) | 47 (41.6) | 29 (47.5) |
| Low annual income, ≤$30,000 | 175/274 (63.9) | 75/118 (63.6) | 62/100 (62.0) | 38/56 (67.9) |
| General health characteristics | ||||
| BMI, mean ± SD, kg/m2 | 31.8 ± 7.4 | 30.8 ± 6.7 | 32.7 ± 7.6 | 32.4 ± 8.1 |
| Obese, BMI >30 kg/m2 | 163 (54.5) | 67 (53.6) | 63 (55.8) | 33 (54.1) |
| Comorbid chronic conditions, ≥2 | 141 (47.2) | 53 (42.4) | 55 (48.7) | 33 (54.1) |
| Smoked cigarettes, any, in last week | 91 (30.4) | 36 (28.8) | 37 (32.7) | 18 (29.5) |
| Back pain measures | ||||
| Back pain intensity (0–10), mean ± SD | 7.2 ± 1.4 | 7.1 ± 1.4 | 7.3 ± 1.4 | 7.1 ± 1.4 |
| Moderate, 4–6 | 169 (56.5) | 71 (56.8) | 60 (53.1) | 68 (62.3) |
| Severe, 7–10 | 130 (43.5) | 54 (43.2) | 53 (46.9) | 23 (37.7) |
| Back pain frequency, last 90 d, median | 75 | 80 | 75 | 75 |
| Limiting back pain, past 30 d, median | 15 | 15 | 15 | 15 |
| Pain medication use, any | 210 (70.2) | 85 (68.0) | 80 (70.8) | 45 (73.8) |
| Psychological measures | ||||
| Depression symptoms, PHQ-8, score ≥10 | 102/294 (34.7) | 41/123 (33.3) | 41/112 (36.6) | 20/59 (33.9) |
| Anxiety symptoms, GAD-7, score ≥10 | 87/295 (29.5) | 36/125 (28.8) | 33/110 (30.0) | 18/60 (30.0) |
| Perceived stress scale, PSS-10 ≥17 | 157/295 (53.2) | 63/123 (51.2) | 62/112 (55.4) | 32/60 (53.3) |
| Fear Avoidance Beliefs Questionnaire | ||||
| Physical activity score >13 | 155/296 (52.4) | 69/124 (55.7) | 57/112 (50.9) | 29/60 (48.3) |
| Work score >29 | 42/288 (14.6) | 14/124 (11.3) | 19/104 (18.3) | 9/60 (15.0) |
| Sleep quality, poor sleep, PSQI >5 | 276 (92.3) | 115 (92.0) | 106 (93.8) | 55 (90.2) |
| Catastrophizing, CSQ ≥14 | 155/298 (52.0) | 60/125 (48.0) | 67/112 (59.8) | 28/61 (45.9) |
| Pain self-efficacy, PSEQ <40 | 166/298 (55.7) | 70/125 (56) | 64/112 (57.1) | 32/61 (52.5) |
| Expectations | ||||
| Yoga would be helpful | 121 (40.5) | 52 (41.6) | 44 (38.9) | 25 (41.0) |
| PT would be helpful | 141 (47.2) | 59 (47.2) | 55 (48.7) | 27 (44.3) |
| Self-care would be helpful | 73/296 (24.7) | 27/124 (21.8) | 34/111 (30.6) | 12/61 (19.7) |
| Concordance, received a “helpful” treatment | 119 (39.8) | 52 (41.6) | 55 (48.7) | 12 (19.7) |
BMI = body mass index; CSQ = Coping Strategies Questionnaire; FABQ = Fear Avoidance Beliefs Questionnaire; GAD-7 = Generalized Anxiety Disorder 7-item; PHQ-8 = Patient Health Questionnaire; PSEQ = Pain Self-Efficacy Questionnaire; PSQI = Pittsburgh Sleep Quality Index; PSS-10 = 10-item Perceived Stress Scale; PT = physical therapy.
Presented as No. (%, out of total No.), unless otherwise noted.
Appendix Table 2.
Comparison between those with and without complete data on outcome at 12 weeks
| Characteristics | Participants with Complete Data (N = 299) | Participants with Missing Data*(N = 21) |
|---|---|---|
| Age, mean ± SD, y | 46.1 ± 10.7 | 44 ± 11.2 |
| Female,** No. (%) | 196 (65.6) | 8 (38.1) |
| Race, nonwhite, No. (%) | 244 (81.6) | 18 (85.7) |
| Ethnicity, Hispanic, No. (%) | 40/295 (13.6) | 3/21 (14.3) |
| Education, >high school, No. (%) | 180/296 (60.8) | 11/21 (52.4) |
| Currently employed, No. (%) | 135 (45.2) | 9 (42.9) |
| Low annual Income, ≤$30,000, No. (%) | 175 (63.9) | 13 (65) |
| Back pain intensity (0–10), mean ± SD | 7.1 ± 1.4 | 7 ± 1.8 |
| Roland Morris, mean ± SD | 14.8 ± 5.3 | 15.5 ± 6.3 |
Individuals missing data on Roland Morris Disability Questionnaire at 12 weeks were excluded from analyses.
Statistically significant P = 0.01.
Appendix Table 3.
Baseline characteristics of 299 participants, stratified by treatment and responder status
| Baseline Characteristics | Total | Responders, No. (%) | P Value | Yoga | Responders, No. (%) | PT | Responders, No. (%) | Self-care | Responders, No. (%) |
|---|---|---|---|---|---|---|---|---|---|
| (N = 299) | (N = 125) | (N = 113) | (N = 61) | ||||||
| Age | 0.0009 | ||||||||
| 18–44 y | 117 | 59 (50) | 50 | 29 (58.0) | 41 | 20 (49) | 26 | 10 (39) | |
| 45–65 y | 182 | 57 (31) | 75 | 31 (41.3) | 72 | 22 (31) | 35 | 4 (11) | |
| Sex | 0.46 | ||||||||
| Male | 103 | 37 (36) | 53 | 22 (42) | 31 | 11 (35) | 19 | 4 (21) | |
| Female | 196 | 79 (40) | 72 | 38 (53) | 82 | 31 (38) | 42 | 10 (24) | |
| Race | 0.41 | ||||||||
| Nonwhite | 244 | 92 (38) | 96 | 45 (47) | 97 | 35 (36) | 51 | 12 (24) | |
| White | 55 | 24 (44) | 29 | 15 (52) | 16 | 7 (44) | 10 | 2 (20.0) | |
| Ethnicity | 0.89 | ||||||||
| Non-Hispanic | 255 | 99 (39) | 104 | 48 (46) | 97 | 38 (39) | 54 | 13 (24) | |
| Hispanic | 40 | 16 (40) | 20 | 11 (55) | 14 | 4 (29) | 6 | 1 (16.7) | |
| Education | 0.003 | ||||||||
| ≤High school | 116 | 32 (28) | 49 | 19 (39) | 49 | 13 (27) | 18 | 0 (0) | |
| >High school | 180 | 81 (45) | 74 | 39 (53) | 63 | 28 (44) | 43 | 14 (33) | |
| Employed | <0.0001 | ||||||||
| No | 164 | 46 (28) | 66 | 22 (33) | 66 | 19 (29) | 32 | 5 (16) | |
| Yes | 135 | 70 (52) | 59 | 38 (64) | 47 | 23 (49) | 29 | 9 (31) | |
| Annual income | 0.0002 | ||||||||
| ≤$30,000 | 175 | 54 (31) | 75 | 28 (37) | 62 | 20 (32) | 38 | 6 (16) | |
| >30,000 | 99 | 53 (54) | 43 | 27 (63) | 38 | 19 (50) | 18 | 7 (39) | |
| BMI categories | 0.14 | ||||||||
| Nonobese | 136 | 59 (43) | 58 | 31 (53) | 51 | 22(43) | 28 | 6 (21) | |
| Obese | 163 | 57 (35) | 67 | 29 (43) | 62 | 20 (32) | 33 | 8 (24) | |
| Comorbid conditions | <0.0001 | ||||||||
| 0–1 | 158 | 79 (50) | 72 | 42 (58) | 58 | 26 (45) | 28 | 11 (39) | |
| ≥2 | 141 | 37 (26) | 53 | 18 (34) | 55 | 16 (29) | 33 | 3 (9) | |
| Hypertension | 0.008 | ||||||||
| No | 187 | 81 (43) | 80 | 44 (55) | 70 | 27 (39) | 37 | 10 (27) | |
| Yes | 105 | 29 (28) | 41 | 13 (32) | 41 | 13 (32) | 23 | 3 (13) | |
| Coronary heart disease | 0.49* | ||||||||
| No | 284 | 113 (40) | 117 | 59 (50) | 107 | 40 (37) | 60 | 14 (23) | |
| Yes | 8 | 2 (25) | 5 | 1 (20) | 2 | 1 (50) | 1 | 0 (0) | |
| Osteoarthritis | 0.05 | ||||||||
| No | 231 | 98 (42) | 100 | 50 (50) | 84 | 35 (42) | 47 | 13 (28) | |
| Yes | 42 | 11 (26) | 12 | 5 (42) | 20 | 5 (25) | 10 | 1 (10) | |
| Neck pain | 0.04 | ||||||||
| No | 197 | 83 (42) | 78 | 41 (53) | 80 | 31 (39) | 39 | 11 (28) | |
| Yes | 89 | 26 (29) | 40 | 16 (40) | 27 | 7 (26) | 22 | 3 (14) | |
| Fibromyalgia | 0.02 | ||||||||
| Yes | 17 | 2 (12) | 8 | 1 (13) | 7 | 1 (14) | 2 | 0 (0) | |
| No | 270 | 112 (41) | 111 | 58 (52) | 103 | 41 (40) | 56 | 13 (23) | |
| Depression | 0.0002 | ||||||||
| No | 225 | 102 (45) | 102 | 53 (52) | 77 | 36 (47) | 46 | 13 (28) | |
| Yes | 63 | 12 (19) | 20 | 7 (35) | 31 | 5 (16) | 12 | 0 (0) | |
| Psychiatric disorder | 0.14 | ||||||||
| No | 244 | 99 (41) | 107 | 52 (49) | 89 | 36 (40) | 48 | 11 (23) | |
| Yes | 48 | 14 (29) | 16 | 7 (44) | 21 | 6 (29) | 11 | 1 (9) | |
| Hepatitis | 0.32 | ||||||||
| No | 283 | 112 (40) | 120 | 58 (48) | 105 | 40 (38) | 58 | 14 (24) | |
| Yes | 15 | 4 (27) | 5 | 2 (40) | 7 | 2 (29) | 3 | 0 (0) | |
| Diabetes | 0.32 | ||||||||
| No | 237 | 96 (4) | 99 | 49 (49) | 88 | 34 (39) | 50 | 13 (26) | |
| Yes | 57 | 19 (33) | 25 | 11 (44) | 24 | 8 (33) | 8 | 0 (0) | |
| COPD | 0.13 | ||||||||
| No | 224 | 93 (42) | 94 | 46 (49) | 85 | 35 (41) | 45 | 12 (27) | |
| Yes | 73 | 23 (32) | 30 | 14 (47) | 27 | 7 (26) | 16 | 2 (13) | |
| Cancer | 0.33* | ||||||||
| No | 288 | 114 (40) | 122 | 59 (48) | 107 | 41 (38) | 59 | 14 (24) | |
| Yes | 10 | 2 (20) | 2 | 1 (50) | 6 | 1 (17) | 2 | 0 (0) | |
| Exercised last week | 0.16 | ||||||||
| No | 102 | 33 (32) | 35 | 11 (31) | 44 | 17 (39) | 23 | 5 (22) | |
| Yes | 118 | 49 (42) | 55 | 28 (51) | 43 | 15 (35) | 20 | 6 (30) | |
| Current smoker | <0.0001 | ||||||||
| No | 208 | 97 (47) | 89 | 50 (56) | 76 | 33 (43) | 43 | 14 (33) | |
| Yes | 91 | 19 (21) | 36 | 10 (28) | 37 | 9 (24) | 18 | 0 (0) | |
| Function (RMDQ) | 0.04 | ||||||||
| Mild (0–8) | 45 | 21 (47) | 28 | 17 (61) | 7 | 2 (29) | 9 | 2 (22) | |
| Moderate (9–16) | 129 | 57 (44) | 49 | 24 (49) | 52 | 23 (44) | 29 | 10 (34) | |
| Severe (17–24) | 125 | 38 (30) | 48 | 19 (40) | 54 | 17 (31) | 23 | 2 (9) | |
| Pain | 0.08 | ||||||||
| Moderate (4–6) | 169 | 73 (43) | 71 | 34 (48) | 60 | 27 (45) | 38 | 12 (32) | |
| Severe (7–10) | 130 | 43 (33) | 54 | 26 (48) | 53 | 15 (28) | 23 | 2 (9) | |
| LBP every day, 3 mo | 0.09 | ||||||||
| No | 196 | 83 (42) | 78 | 44 (56) | 75 | 27 (36) | 43 | 12 (28) | |
| Yes | 102 | 33 (32) | 46 | 16 (35) | 38 | 15 (39) | 18 | 2 (11) | |
| Activity lim. daily, 1 mo | 0.02 | ||||||||
| No | 244 | 102 (42) | 100 | 53 (53) | 91 | 36 (40) | 53 | 13 (25) | |
| Yes | 55 | 14 (25) | 25 | 7 (28) | 22 | 6 (27) | 8 | 1 (13) | |
| Using pain medication | 0.0005† | ||||||||
| None | 89 | 48 (54) | 40 | 24 (60) | 33 | 15 (45) | 16 | 9 (56) | |
| Any | 210 | 68 (32) | 85 | 36 (42) | 80 | 27 (34) | 45 | 5 (11) | |
| NSAIDs | 0.35† | ||||||||
| No | 142 | 59 (42) | 63 | 27 (43) | 53 | 22 (42) | 26 | 10 (38) | |
| Yes | 157 | 57 (36) | 62 | 33 (53) | 60 | 20 (33) | 35 | 4 (11) | |
| Acetaminophen | 0.002† | ||||||||
| No | 197 | 89 (45) | 83 | 47 (57) | 78 | 30 (38) | 36 | 12 (33) | |
| Yes | 102 | 27 (26) | 42 | 13 (31) | 35 | 12 (34) | 25 | 2 (8) | |
| Muscle relaxant | 0.04 | ||||||||
| No | 274 | 111 (41) | 119 | 59 (50) | 101 | 39 (39) | 54 | 13 (24) | |
| Yes | 25 | 5 (20) | 6 | 1 (17) | 12 | 3 (25) | 7 | 1 (14) | |
| Opioids | 0.005 | ||||||||
| No | 251 | 106 (42) | 104 | 55 (53) | 96 | 37 (39) | 51 | 14 (27) | |
| Yes | 48 | 10 (21) | 21 | 5 (24) | 17 | 5 (29) | 10 | 0 (0) | |
| FABQ physical activity | 0.60† | ||||||||
| Low-risk (≤13) | 141 | 56 (40) | 55 | 29 (53) | 55 | 23 (42) | 31 | 4 (13) | |
| High-risk (>13) | 155 | 57 (37) | 69 | 30 (43) | 57 | 18 (32) | 29 | 9 (31) | |
| FABQ Work | 0.001 | ||||||||
| Low-risk (≤29) | 246 | 105 (43) | 110 | 58 (53) | 85 | 34 (40) | 51 | 13 (25) | |
| High-risk (>29) | 42 | 7 (17) | 14 | 2 (14) | 19 | 4 (21) | 9 | 1 (11) | |
| Depressive symptoms, PHQ-8 | <0.0001 | ||||||||
| Low (<10) | 192 | 93 (48) | 82 | 47 (57) | 71 | 33 (46) | 39 | 13 (33) | |
| High (≥10) | 102 | 23 (23) | 41 | 13 (32) | 41 | 9 (22) | 20 | 1 (5) | |
| Anxiety symptoms, GAD-7 | 0.29 | ||||||||
| Low (<10) | 208 | 83 (40) | 89 | 45 (51) | 77 | 27 (35) | 42 | 11 (26) | |
| High (≥10) | 87 | 29 (33) | 36 | 15 (42) | 33 | 12 (36) | 18 | 2 (11) | |
| Sleep quality, PSQI | 0.002 | ||||||||
| Normal (≤5) | 23 | 14 (61) | 10 | 6 (60) | 7 | 6 (86) | 6 | 2 (33) | |
| Poor (>5) | 276 | 102 (37) | 115 | 54 (47) | 106 | 36 (34) | 55 | 12 (22) | |
| PSS-10 | 0.004 | ||||||||
| Normal (<17) | 138 | 64 (46) | 60 | 33 (55) | 50 | 23 (46) | 28 | 8 (29) | |
| Poor (≥17) | 157 | 50 (32) | 63 | 26 (41) | 62 | 18 (29) | 32 | 6 (19) | |
| Catastrophizing, CSQ | 0.23 | ||||||||
| Normal (<14) | 143 | 61 (43) | 65 | 33 (51) | 45 | 19 (42) | 33 | 9 (27) | |
| High (≥14) | 155 | 55 (35) | 60 | 27 (45) | 67 | 23 (34) | 28 | 5 (18) | |
| Self-efficacy, PSEQ | 0.001 | ||||||||
| Low/moderate (<40) | 166 | 51 (31) | 70 | 27 (39) | 64 | 17 (27) | 32 | 7 (22) | |
| High (≥40) | 132 | 65 (49) | 55 | 33 (60) | 48 | 25 (52) | 29 | 7 (24) | |
| Expectations, yoga | 0.14 | ||||||||
| Low/moderate, <9 | 178 | 63 (35) | 73 | 28 (38) | 69 | 25 (36) | 36 | 10 (28) | |
| High, 9–10 | 121 | 53 (44) | 52 | 32 (62) | 44 | 17 (39) | 25 | 4 (16) | |
| Expectations, PT | 0.58 | ||||||||
| Low/moderate, <9 | 158 | 59 (37) | 66 | 32 (48) | 58 | 18 (31) | 34 | 9 (26) | |
| High, 9–10 | 141 | 57 (40) | 59 | 28 (47) | 55 | 24 (44) | 27 | 5 (19) | |
| Expectations, self-care | 0.08 | ||||||||
| Low/moderate, <9 | 223 | 93 (42) | 97 | 50 (52) | 77 | 29 (38) | 49 | 14 (29) | |
| High, 9–10 | 73 | 22 (30) | 27 | 10 (37) | 34 | 12 (35) | 12 | 0 (0) | |
| Expectations, concordance | 0.02 | ||||||||
| No | 180 | 60 (33) | 73 | 28 (38) | 58 | 18 (31) | 49 | 14 (29) | |
| Yes | 119 | 56 (47) | 52 | 32 (62) | 55 | 24 (44) | 12 | 0 (0) | |
Concordance: high expectations of treatment received.
BMI = body mass index; COPD = chronic obstructive pulmonary disease; CSQ = Coping Strategies Questionnaire; FABQ = Fear Avoidance Beliefs Questionnaire; GAD-7 = Generalized Anxiety Disorder 7-item; PHQ-8 = Patient Health Questionnaire; PSEQ = Pain Self-Efficacy Questionnaire; PSQI = Pittsburgh Sleep Quality Index; PSS-10 = 10-item Perceived Stress Scale; PT = physical therapy; RMDQ = Roland Morris Disability Questionnaire.
P values calculated using Fisher’s adjustment due to >20% of expected cell counts <5.
Indicates effect modification by treatment group.
Funding sources: The Back to Health Study (5R01-AT005956) was funded by the National Center for Complementary and Integrative Health (NCCIH). Dr. Roseen is supported by funding from the NCCIH (1F32AT009272) and by the Boston University Clinical and Translational Science Institute (CTSI) Clinical Research Training Program (National Center for Advancing Translational Sciences, 1UL1TR001430).
Conflicts of interest: The authors have no financial or other relationships that would constitute a conflict of interest.
Prior presentations: This work was presented, in part, at the International Research Congress on Integrative Medicine & Health (May 2018) in Baltimore, Maryland, USA, the annual meeting of the Academic Consortium for Integrative Medicine and Health (April 2019) in Edmonton, Alberta, Canada, and the International Back and Neck Pain Forum (July 2019) in Quebec City, Quebec, Canada.
Trial registration: ClinicalTrials.gov ID: NCT01343927.
References
- 1. Qaseem A, Wilt TJ, McLean RM, Forciea MA.. Noninvasive treatments for acute, subacute, and chronic low back pain: A clinical practice guideline from the American College of Physicians. Ann Intern Med 2017;166(7):514–30. [DOI] [PubMed] [Google Scholar]
- 2. Fillingim RB. Individual differences in pain: Understanding the mosaic that makes pain personal. Pain 2017;158:S11–S8. [DOI] [PMC free article] [PubMed] [Google Scholar]
- 3. Haldeman S, Dagenais S.. A supermarket approach to the evidence-informed management of chronic low back pain. Spine J 2008;8(1):1–7. [DOI] [PubMed] [Google Scholar]
- 4. Atlas SJ. Management of low back pain: Getting from evidence-based recommendations to high-value care. Ann Intern Med 2017;166(7):533–4. [DOI] [PubMed] [Google Scholar]
- 5. Clarke TC, Barnes PM, Black LI, Stussman BJ, Nahin RL.. Use of yoga, meditation, and chiropractors among U.S. adults aged 18 and over. NCHS Data Brief 2018;(325):1–8. [PubMed] [Google Scholar]
- 6. Freburger JK, Carey TS, Holmes GM, et al. Exercise prescription for chronic back or neck pain: Who prescribes it? who gets it? What is prescribed? Arthritis Rheum 2009;61(2):192–200. [DOI] [PMC free article] [PubMed] [Google Scholar]
- 7. Cramer H, Lauche R, Haller H, Dobos G.. A systematic review and meta-analysis of yoga for low back pain. Clin J Pain 2013;29(5):450–60. [DOI] [PubMed] [Google Scholar]
- 8. Wieland LS, Skoetz N, Pilkington K, Vempati R, D'Adamo CR, Berman BM.. Yoga treatment for chronic non-specific low back pain. Cochrane Database Syst Rev 2017;1:CD010671. [DOI] [PMC free article] [PubMed] [Google Scholar]
- 9. Hayden JA, van Tulder MW, Tomlinson G.. Systematic review: Strategies for using exercise therapy to improve outcomes in chronic low back pain. Ann Intern Med 2005;142(9):776–85. [DOI] [PubMed] [Google Scholar]
- 10. Deyo RA, Dworkin SF, Amtmann D, et al. Report of the NIH Task Force on Research Standards for Chronic Low Back Pain. J Pain 2014;15(6):569–85. [DOI] [PMC free article] [PubMed] [Google Scholar]
- 11. Ostelo RW, Deyo RA, Stratford P, et al. Interpreting change scores for pain and functional status in low back pain: Towards international consensus regarding minimal important change. Spine (Phila Pa 1976) 2008;33(1):90–4. [DOI] [PubMed] [Google Scholar]
- 12. Jordan K, Dunn KM, Lewis M, Croft P.. A minimal clinically important difference was derived for the Roland-Morris Disability Questionnaire for low back pain. J Clin Epidemiol 2006;59(1):45–52. [DOI] [PubMed] [Google Scholar]
- 13. Pincus T, Miles C, Froud R, Underwood M, Carnes D, Taylor SJ.. Methodological criteria for the assessment of moderators in systematic reviews of randomised controlled trials: A consensus study. BMC Med Res Methodol 2011;11(1):14.. [DOI] [PMC free article] [PubMed] [Google Scholar]
- 14. Hill JC, Dunn KM, Lewis M, et al. A primary care back pain screening tool: Identifying patient subgroups for initial treatment. Arthritis Rheum 2008;59(5):632–41. [DOI] [PubMed] [Google Scholar]
- 15. Stein KM, Weinberg J, Sherman KJ, Lemaster CM, Saper R.. Participant characteristics associated with symptomatic improvement from yoga for chronic low back pain. J Yoga Phys Ther 2014;4(1):151. [DOI] [PMC free article] [PubMed] [Google Scholar]
- 16. Tran HH, Weinberg J, Sherman KJ, Saper RB.. Preference and expectation for treatment assignment in a randomized controlled trial of once- vs twice-weekly yoga for chronic low back pain. Glob Adv Health Med 2015;4(1):34–9. [DOI] [PMC free article] [PubMed] [Google Scholar]
- 17. Delitto A, Cibulka MT, Erhard RE, Bowling RW, Tenhula JA.. Evidence for use of an extension-mobilization category in acute low back syndrome: A prescriptive validation pilot study. Phys Ther 1993;73(4):216–22. [DOI] [PubMed] [Google Scholar]
- 18. Long A, Donelson R, Fung T.. Does it matter which exercise? A randomized control trial of exercise for low back pain. Spine (Phila Pa 1976) 2004;29(23):2593–602. [DOI] [PubMed] [Google Scholar]
- 19. Browder DA, Childs JD, Cleland JA, Fritz JM.. Effectiveness of an extension-oriented treatment approach in a subgroup of subjects with low back pain: A randomized clinical trial. Phys Ther 2007;87(12):1608–18; discussion 577–9. [DOI] [PubMed] [Google Scholar]
- 20. Costa L. d C M, Koes BW, Pransky G, Borkan J, Maher CG, Smeets RJEM.. Primary care research priorities in low back pain: An update. Spine (Phila Pa 1976) 2013;38(2):148–56. [DOI] [PubMed] [Google Scholar]
- 21. Gurung T, Ellard DR, Mistry D, Patel S, Underwood M.. Identifying potential moderators for response to treatment in low back pain: A systematic review. Physiotherapy 2015;101(3):243–51. [DOI] [PubMed] [Google Scholar]
- 22. Beneciuk JM, Hill JC, Campbell P, et al. Identifying treatment effect modifiers in the STarT back trial: A secondary analysis. J Pain 2017;18(1):54–65. [DOI] [PMC free article] [PubMed] [Google Scholar]
- 23. Saper RB, Sherman KJ, Delitto A, et al. Yoga vs physical therapy vs education for chronic low back pain in predominantly minority populations: Study protocol for a randomized controlled trial. Trials 2014;15(1):67. [DOI] [PMC free article] [PubMed] [Google Scholar]
- 24. Saper RB, Lemaster C, Delitto A, et al. Yoga, physical therapy, or education for chronic low back pain: A randomized noninferiority trial. Ann Intern Med 2017;167(2):85–94. [DOI] [PMC free article] [PubMed] [Google Scholar]
- 25. Saper RB, Sherman KJ, Cullum-Dugan D, Davis RB, Phillips RS, Culpepper L.. Yoga for chronic low back pain in a predominantly minority population: A pilot randomized controlled trial. Altern Ther Health Med 2009;15(6):18–27. [PMC free article] [PubMed] [Google Scholar]
- 26. Saper RB, Boah AR, Keosaian J, Cerrada C, Weinberg J, Sherman KJ.. Comparing once- versus twice-weekly yoga classes for chronic low back pain in predominantly low income minorities: A randomized dosing trial. Evid Based Complement Alternat Med 2013;2013:658030. [DOI] [PMC free article] [PubMed] [Google Scholar]
- 27. Fritz JM, Brennan GP, Clifford SN, Hunter SJ, Thackeray A.. An examination of the reliability of a classification algorithm for subgrouping patients with low back pain. Spine (Phila Pa 1976) 2006;31(1):77–82. [DOI] [PubMed] [Google Scholar]
- 28. Fritz JM, Cleland JA, Childs JD.. Subgrouping patients with low back pain: Evolution of a classification approach to physical therapy. J Orthop Sports Phys Ther 2007;37(6):290–302. [DOI] [PubMed] [Google Scholar]
- 29. Roland MW, Klaber Moffett K, Burton K, Main C, Cantrell T.. The Back Book. Norwich, UK: The Stationary Office; 1996. [Google Scholar]
- 30. Moore JL, Von Korff M, Gonzalez VM, Laurent DD.. The Back Pain Helpbook. New York: Perseus Books; 1999. [Google Scholar]
- 31. Coupe VMH, van Hooff ML, de Kleuver M, Steyerberg EW, Ostelo R.. Decision support tools in low back pain. Best Pract Res Clin Rheumatol 2016;30(6):1084–97. [DOI] [PubMed] [Google Scholar]
- 32. Von Korff M, Jensen MP, Karoly P.. Assessing global pain severity by self-report in clinical and health services research. Spine (Phila Pa 1976) 2000;25(24):3140–51. [DOI] [PubMed] [Google Scholar]
- 33. Ritter PL, Gonzalez VM, Laurent DD, Lorig KR.. Measurement of pain using the visual numeric scale. J Rheumatol 2006;33(3):574–80. [PubMed] [Google Scholar]
- 34. Löwe B, Kroenke K, Herzog W, Gräfe K.. Measuring depression outcome with a brief self-report instrument: Sensitivity to change of the Patient Health Questionnaire (PHQ-9). J Affect Disord 2004;81(1):61–6. [DOI] [PubMed] [Google Scholar]
- 35. Spitzer RL, Kroenke K, Williams JB, Lowe B.. A brief measure for assessing generalized anxiety disorder: The GAD-7. Arch Intern Med 2006;166(10):1092–7. [DOI] [PubMed] [Google Scholar]
- 36. Cohen S, Kamarck T, Mermelstein R.. A global measure of perceived stress. J Health Soc Behav 1983;24(4):385–96. [PubMed] [Google Scholar]
- 37. Cleland JA, Fritz JM, Brennan GP.. Predictive validity of initial fear avoidance beliefs in patients with low back pain receiving physical therapy: Is the FABQ a useful screening tool for identifying patients at risk for a poor recovery? Eur Spine J 2008;17(1):70–9. [DOI] [PMC free article] [PubMed] [Google Scholar]
- 38. Buysse DJ, Reynolds CF 3rd, Monk TH, Berman SR, Kupfer DJ.. The Pittsburgh Sleep Quality Index: A new instrument for psychiatric practice and research. Psychiatry Res 1989;28(2):193–213. [DOI] [PubMed] [Google Scholar]
- 39. Utne I, Miaskowski C, Bjordal K, Cooper BA, Valeberg BT, Rustøen T.. Confirmatory factor analysis of the coping strategies questionnaire-revised in samples of oncology outpatients and inpatients with pain. Clin J Pain 2009;25(5):391–400. [DOI] [PubMed] [Google Scholar]
- 40. KO A, Dowds BN, Pelletz RE, Edwards WT, Peeters-Asdourian C.. Development and initial validation of a scale to measure self-efficacy beliefs in patients with chronic pain. Pain 1995;63(1):77–84. [DOI] [PubMed] [Google Scholar]
- 41. Tonkin L. The Pain Self-Efficacy Questionnaire. Aust J Physiother 2008;54(1):77. [DOI] [PubMed] [Google Scholar]
- 42. Patrick DL, Deyo RA, Atlas SJ, Singer DE, Chapin A, Keller RB.. Assessing health-related quality of life in patients with sciatica. Spine (Phila Pa 1976) 1995;20(17):1899–908; discussion 909. [DOI] [PubMed] [Google Scholar]
- 43. Firth D. Bias reduction of maximum likelihood estimates. Biometrika 1993;80(1):27–38. [Google Scholar]
- 44. Heinze G, Schemper M.. A solution to the problem of separation in logistic regression. Stat Med 2002;21(16):2409–19. [DOI] [PubMed] [Google Scholar]
- 45. Grotle M, Foster NE, Dunn KM, Croft P.. Are prognostic indicators for poor outcome different for acute and chronic low back pain consulters in primary care? Pain 2010;151(3):790–7. [DOI] [PMC free article] [PubMed] [Google Scholar]
- 46. Grotle M, Brox JI, Veierød MB, Glomsrød B, Lønn JH, Vøllestad NK.. Clinical course and prognostic factors in acute low back pain: Patients consulting primary care for the first time. Spine (Phila Pa 1976) 2005;30(8):976–82. [DOI] [PubMed] [Google Scholar]
- 47. Pinheiro MB, Ferreira ML, Refshauge K, et al. Symptoms of depression as a prognostic factor for low back pain: A systematic review. Spine J 2016;16(1):105–16. [DOI] [PubMed] [Google Scholar]
- 48. Campbell P, Foster NE, Thomas E, Dunn KM.. Prognostic indicators of low back pain in primary care: Five-year prospective study. J Pain 2013;14(8):873–83. [DOI] [PMC free article] [PubMed] [Google Scholar]
- 49. Dobscha SK, Corson K, Perrin NA, et al. Collaborative care for chronic pain in primary care: A cluster randomized trial. JAMA 2009;301(12):1242–52. [DOI] [PubMed] [Google Scholar]
- 50. Bair MJ, Ang D, Wu J, et al. Evaluation of stepped care for chronic pain (ESCAPE) in veterans of the Iraq and Afghanistan conflicts: A randomized clinical trial. JAMA Intern Med 2015;175(5):682–9. [DOI] [PubMed] [Google Scholar]
- 51. Hayden JA, Wilson MN, Stewart S, et al. Exercise treatment effect modifiers in persistent low back pain: An individual participant data meta-analysis of 3514 participants from 27 randomised controlled trials. Br J Sports Med. In press. [DOI] [PubMed] [Google Scholar]
- 52. Broderick JE, Keefe FJ, Schneider S, et al. Cognitive behavioral therapy for chronic pain is effective, but for whom? Pain 2016;157(9):2115–23. [DOI] [PubMed] [Google Scholar]
- 53. Wertli MM, Rasmussen-Barr E, Weiser S, Bachmann LM, Brunner F.. The role of fear avoidance beliefs as a prognostic factor for outcome in patients with nonspecific low back pain: A systematic review. Spine J 2014;14(5):816–36 e4. [DOI] [PubMed] [Google Scholar]
- 54. Wertli MM, Rasmussen-Barr E, Held U, Weiser S, Bachmann LM, Brunner F.. Fear-avoidance beliefs—a moderator of treatment efficacy in patients with low back pain: A systematic review. Spine J 2014;14(11):2658–78. [DOI] [PubMed] [Google Scholar]
- 55. Sherman KJ, Wellman RD, Cook AJ, Cherkin DC, Ceballos RM.. Mediators of yoga and stretching for chronic low back pain. Evid Based Complement Alternat Med 2013;2013:130818. [DOI] [PMC free article] [PubMed] [Google Scholar]
- 56. Van Dyke BP, Newman AK, Morais CA, Burns JW, Eyer JC, Thorn BE.. Heterogeneity of treatment effects in a randomized trial of literacy-adapted group cognitive-behavioral therapy, pain psychoeducation, and usual medical care for multiply disadvantaged patients with chronic pain. J Pain 2019;20(10):1236–48. [DOI] [PubMed] [Google Scholar]
- 57. Dewalt DA, Berkman ND, Sheridan S, Lohr KN, Pignone MP.. Literacy and health outcomes: A systematic review of the literature. J Gen Intern Med 2004;19(12):1228–39. [DOI] [PMC free article] [PubMed] [Google Scholar]
- 58. Edward J, Carreon LY, Williams MV, Glassman S, Li J.. The importance and impact of patients’ health literacy on low back pain management: A systematic review of literature. Spine J 2018;18(2):370–6. [DOI] [PubMed] [Google Scholar]
- 59. Kraemer HC, Wilson GT, Fairburn CG, Agras WS.. Mediators and moderators of treatment effects in randomized clinical trials. Arch Gen Psychiatry 2002;59(10):877–83. [DOI] [PubMed] [Google Scholar]
- 60. Rothman KJ. No adjustments are needed for multiple comparisons. Epidemiology 1990;1(1):43–6. [PubMed] [Google Scholar]
- 61. Garcia AN, Costa L. de CM, Hancock M, Costa LOP.. Identifying patients with chronic low back pain who respond best to mechanical diagnosis and therapy: Secondary analysis of a randomized controlled trial. Phys Ther 2016;96(5):623–30. [DOI] [PubMed] [Google Scholar]
- 62. Roseen EJ, Gerlovin H, Femia A, et al. Yoga, physical therapy, and back pain education for sleep quality in low-income racially diverse adults with chronic low back pain: A secondary analysis of a randomized controlled trial. J Gen Intern Med 2020;35(1):167–76. [DOI] [PMC free article] [PubMed] [Google Scholar]
- 63. Witt CM, Vertosick EA, Foster NE, et al. The effect of patient characteristics on acupuncture treatment outcomes: An individual patient data meta-analysis of 20,827 chronic pain patients in randomized controlled trials. Clin J Pain 2019;35(5):428–34. [DOI] [PMC free article] [PubMed] [Google Scholar]