

Abstract
This paper presents an affinity graphene nanosensor for detection of biomarkers in undiluted and non-desalted human serum. The affinity nanosensor is a field-effect transistor in which graphene serves as the conducting channel. The graphene surface is sequentially functionalized with a nanolayer of the polymer polyethylene glycol (PEG) and a biomarker-specific aptamer. The aptamer is able to specifically bind with and capture unlabeled biomarkers in serum. A captured biomarker induces a change in the electric conductivity of the graphene, which is measured in a buffer of optimally chosen ionic strength to determine the biomarker concentration. The PEG layer effectively rejects nonspecific adsorption of background molecules in serum while still allowing the aptamer to be readily accessible to serum-borne biomarkers and increases the effective Debye screening length on the graphene surface. Thus, the aptamer-biomarker binding sensitively changes the graphene conductivity, thereby achieving specific and label-free detection of biomarkers with high sensitivity and without the need to dilute or desalt the serum. Experimental results demonstrate that the graphene nanosensor is capable of specifically capturing human immunoglobulin E (IgE), used as a representative biomarker, in human serum in the concentration range of 50 pM–250 nM, with a resolution of 14.5 pM and a limit of detection of 47 pM.
Keywords: Affinity sensing, Biomarker detection, Graphene, Nonspecific binding, Human serum
1. Introduction
Early detection of disease biomarkers is highly sought after in clinical diagnostics. Biosensors that utilize nanomaterials, such as conducting polymer nanowires [1], semiconductor nanowires [2], carbon nanotubes [3], and graphene [4], offer attractive advantages for biomarker detection. In particular, graphene, a two-dimensional honeycomb lattice of carbon with a sp2 structure, offers unique physical and chemical properties such as high intrinsic carrier mobility, large surface-area-to-volume ratio, low intrinsic noise, and good biocompatibility [5–7]. Biosensors using graphene have been demonstrated on optical [8,9], optomechanical [10], and electrochemical [11,12] platforms. Of particular interest are field effect transistor (FET) nanobiosensors using graphene as the conducting channel [4,13], allowing target detection with high sensitivity. When combined with an appropriate recognition molecule, specific detection of target molecules of interest can be achieved [14]. One important advance in graphene FET nanosensors involves using aptamers, single-strand oligonucleotides with high affinity and specificity to a biomarker, as the recognition element [4]. Aptamers, compared to other receptor molecules such as antibodies, have attractive advantages such as synthetic availability, small size, batch-to-batch uniformity, stability and long shelf life, for effective surface-based detection [15]. As a result, aptamer-based graphene FET devices have been used for the detection of a variety of biomarkers such as DNA [16], peptides [17], and proteins [4].
Previously reported aptameric FET sensors, however, have been mostly limited to the detection of biomarkers in conditioned buffers. In complex physiological media such as serum, plasma or whole blood, abundant background molecules tend to adsorb nonspecifically to the hydrophobic graphene surface [18] and thus interfere with biomarker detection. Such interferences may cause difficulties in accurately measuring biomarkers. For example, a graphene oxide (a graphene derivative) FET nanosensor [19] was employed to measure prostate cancer biomarker in serum, and although it was able to demonstrate the successful quantification, it also experienced appreciable adsorption of serum proteins because of the interaction between serum proteins and the reduced graphene oxide [20]. Moreover, either dilution or desalting of serum, which may reduce the measurement sensitivity of low concentration biomarkers or increase the complexity of the protocol while potentially compromising the viability of the analyte, was necessary. Further challenging these sensors is the short Debye screening length (<1 nm), the characteristic thickness of the electrical double layer, resulted from serum’s high ionic strengths which can cause the binding events to occur outside the electrical double layer and drastically reduce the biomarker detection sensitivity [21]. Thus, despite its importance, the detection of biomarkers directly in serum or in other forms of physiological media using graphene FET-based nanosensors has yet to be demonstrated.
This paper presents an affinity graphene nanosensor for the detection of biomarkers in undiluted and non-desalted human serum. The affinity nanosensor employs an FET-based design in which graphene serves as the conducting channel. The graphene surface is sequentially functionalized with a nanolayer of the polymer polyethylene glycol (PEG) and a biomarker-specific aptamer. The aptamer binds with and captures biomarkers, which are not tagged with any labeling groups, in serum. The captured biomarker induces a change in the electric conductivity of the graphene, which is measured via a solution-gated FET formed in a buffer of optimally chosen ionic strength to determine the biomarker concentration. In this approach, the sequential attachment of the aptamer and PEG to the graphene surface allows the aptamer to be readily accessible to serum-borne biomarker molecules, while the PEG effectively prevents nonspecific adsorption of background molecules in serum [22] and protects graphene from the interferences of such molecules. In addition, the small size of the aptamer facilitates the captured biomarker molecules to stay in the close proximity of the graphene, and the immobilized PEG increases the effective Debye screening length [23–25]. Consequently, the biomarker is readily recognized in serum by the aptamer, and their binding sensitively changes the graphene conductivity, thereby achieving the specific and label-free detection of the biomarker with high sensitivity.
The capability of the nanosensor is demonstrated by detection of the protein immunoglobulin E (IgE), chosen as a representative biomarker, in undiluted and non-desalted human serum. Reproducible measurements of IgE at concentrations ranging from 50 pM to 250 nM are made with an estimated resolution of 15.6 pM and limit of detection of 47 pM. These clinically relevant measurements demonstrate the potential of our approach for biomarker detection in human serum and other forms of physiological media.
2. Experimental method
2.1. Principle and design
The graphene nanosensor is configured as a solution-gated graphene FET, where the graphene conducting channel is sequentially functionalized first with a PEG nanolayer and then with aptamer molecules. PEG is a hydrophilic, electrically neutral polymer that can inhibit nonspecific adsorption of background molecules in physiological samples that are typically hydrophobic and charged [26]. The immobilized PEG polymer on graphene surface forms a porous and biomolecule permeable layer on the surface of FET while also changing the dielectric properties in aqueous solutions, which increases the effective Debye screening length [24]. The aptamer is attached to the PEG that is in turn tethered to the graphene surface, thereby leaving the aptamer exposed to biomarker molecules in the sample with the PEG thickness tunable for optimization of the adsorption rejection and detection sensitivity. Thus, when exposed to a serum sample, the functionalized PEG nanolayer reduces the nonspecific adsorption of background molecules (Fig. 1) while the attached aptamer specifically captures the biomarker in serum. As it binds to the biomarker, the aptamer experiences a conformational change, bringing the biomarker into the proximity of the graphene surface. In this configuration, an electrical double layer is formed at the interface of the graphene and the electrolyte serves as the gate dielectric layer. The charged target molecule induces a change in the electrical conductance of the graphene through the electrical double layer, thereby producing a detectable signal. The graphene channel is formed between drain and source electrodes on the SiO2 substrate as shown in Fig. 2(a). Target molecules are in solution (contained within a polydimethylsiloxane open well located above the sensor) and allowed to interact with the aptamer linked to the nanolayer of PEG that is in-turn attached to the graphene surface. An Ag/AgCl wire inserted into the solution to forms the gate electrode. Given the experimental scheme of graphene FET nanosensors where the sample solution in the graphene sensing region is exposed to the ambient environment, the exposure of serum to air leads to the reduction of CO2 from the serum, changing the pH of serum over the time. The pH variation, to which the graphene is highly sensitive, brings inaccuracy to the biomarker detection. In this work, the nanosensor operates scheme that decouples the capture and detection of the biomarker. That is, the biomarker is sequentially first captured by the aptamer in serum, which in general involves diversely varying high ionic strength and pH ranges, and then detected in conditioned buffer with well-controlled ionic strengths and pH to enable optimized FET measurements [27].
Fig. 1.

Principle of nanosensing in serum. (a) PEG and aptamer immobilized graphene. (b) Serum introduction. (c) IgE capture and purification on the graphene surface, impurities repelled by grafted PEG.
Fig. 2.
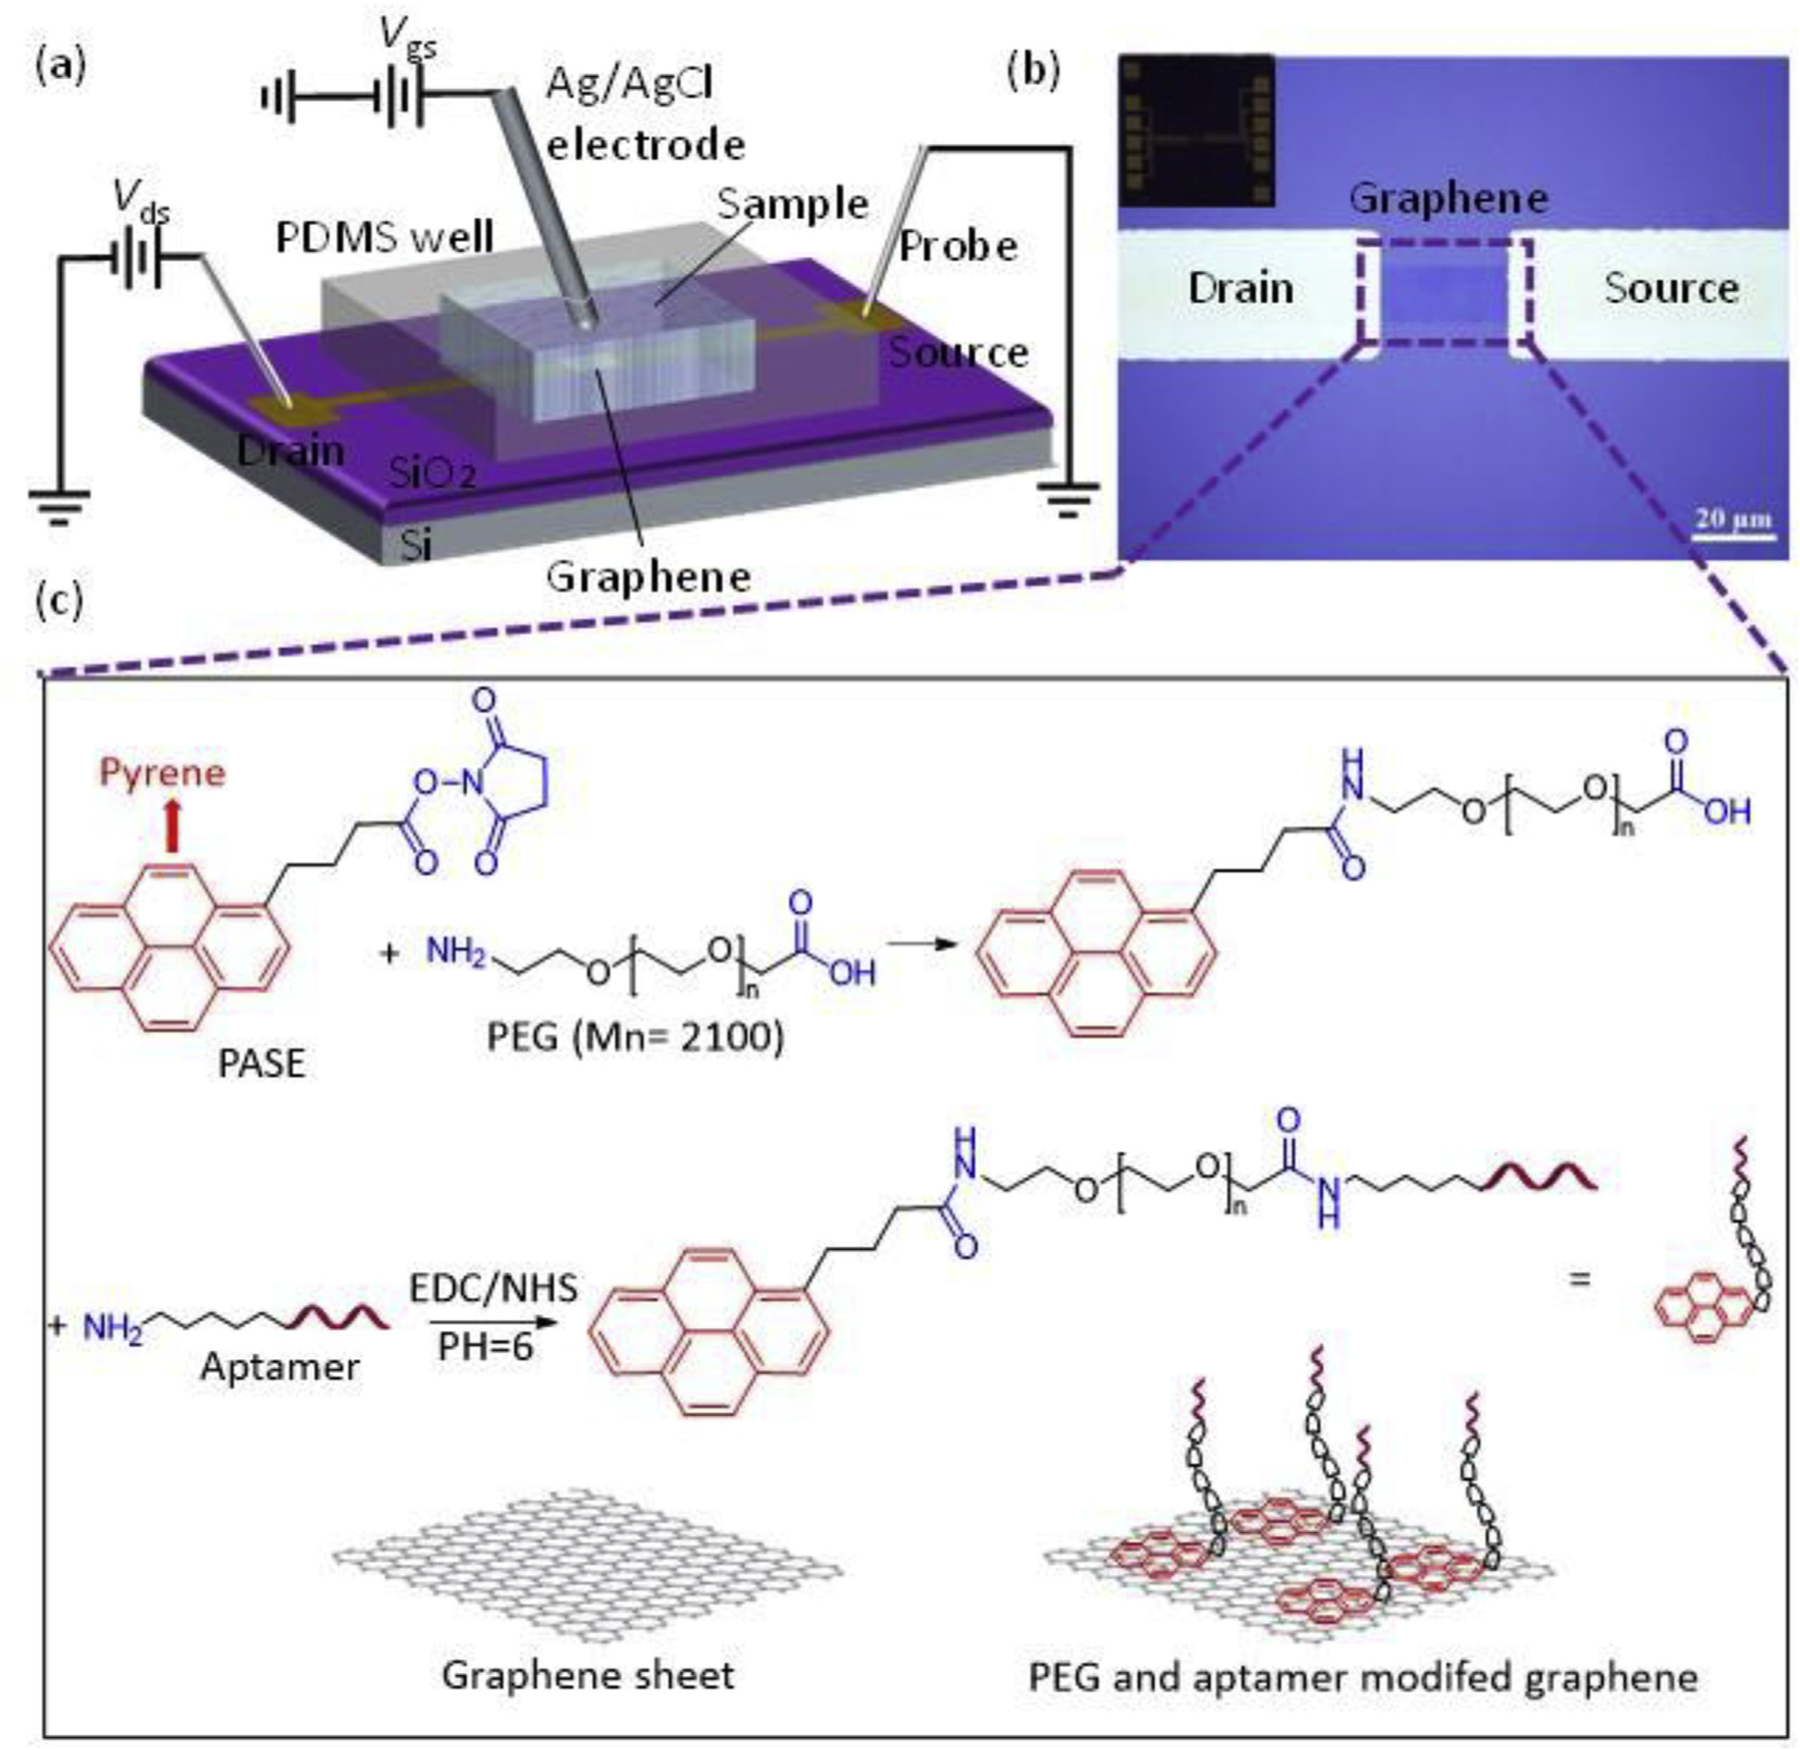
Design, fabrication and functionalization of the graphene nanosenor. (a) The device is configured as a liquid-gated graphene FET. (b) Micrograph of a fabricated device. The patterned graphene conducting channel connects the drain and source electrodes (Inset: photograph of the sensor chip). (c) Surface Functionalization of graphene. Pyrene-terminated PASE linker molecules are coupled to graphene via π-π interactions. PEG and aptamer molecules are sequentially attached to the PASE by forming amide groups.
2.2. Device fabrication and surface functionalization
The device was fabricated using micro and nanofabrication techniques (see Fig. S1 in Supplementary Information). Graphene synthesized via chemical vapor deposition (CVD) was transferred onto the target substrate using a poly methyl methacrylate carrier layer (PMMA), following a previously reported protocol [16], which pre-fabricated source and drain electrodes (Fig. 2(b)). Then the PMMA carrier layer was removed by acetone. The graphene then was patterned to define the sensing region (See Fig. S2 in Supplementary Information). Finally, a polydimethylsiloxane (PDMS) open well (~10 μL in volume) was stamped above the graphene sensing region to hold the target solution. Before the surface functionalization, the graphene was verified to be of a monolayer via Raman spectroscopy (Renishaw inVia confocal Raman microscope). The graphene channel was then biochemically functionalized (see details in Supplementary Information) to achieve the target molecule sensing in serum (Fig. 2(c)). PEG and aptamer were serially functionalized on graphene surface via a 1-pyrenebutanoic acid succinimidyl ester (PASE) linker, which was already non-covalently coupled to graphene surface by π-π interactions.
2.3. Testing procedure
During operation, the modified graphene conducting channel was exposed to IgE-spiked serum solutions at different concentrations for 10 min respectively. After this incubation period, the sensor was gently washed with buffer and the open chamber was filled with 0.01× fresh PBS buffer. A bias drain-source voltage Vds applied between the drain and source electrodes generated a drain-source current Ids through the graphene channel, and the Ids was controlled by the applied gate voltage Vg. Transfer characteristics (i.e., the functional dependence of Ids on Vg) of graphene was measured by sweeping the Vg in a range of interest, and the Dirac point VDirac, the voltage at which the Ids reached its minimum, were measured. In the FET-based electrical measurement, both the drain and gate voltage were supplied by sourcemeters (Keithley 2400, Tektronix), and the drain-source current was simultaneously measured. The two sourcemeters were automatically controlled through a PC-based LabVIEW program.
2.4. Materials
Graphene was synthesized via chemical vapor deposition (CVD). Polydimethylsiloxane (PDMS, Sylgard-184) was purchased from Dow Corning (Midland, MI) for PDMS well. 1-pyrenebutanoic acid succinimidyl ester (PASE) linker and phosphate buffered saline (PBS) were purchased from Thermo Fisher Scientific (Waltham, MA). Amine-PEG-carboxylic acid, 5′-amino group modified IgE DNA aptamer D17.4 [28] (selective sequence 5′-NH2 GCG CGG GGC ACG TTT ATC CGT CCC TCC TAG TGG CGT GCC CCG CGC-3′) and its complementary DNA oligonucleotide (selective sequence 5′-FAM GCG CGG GGC ACG CCA CTA GGA GGG ACG GAT AAA-3′) were synthesized and purified by Integrated DNA Technologies (Coralville, IA). Target molecule, Immunoglobulin E (IgE) and control molecule, Immunoglobulin G (IgG) were purchased from Athens Research and Technology (Athens, GA). 1-ethyl-3-(3-dimethylaminepropyl carbodiimide hydrochloride (EDC•HCl) and N-hydroxysulfosuccinimide (NHS), Dimethylformamide, ethanolamine and PBS as well as other chemicals used in functionalization and experiments were obtained from Sigma-Aldrich (St. Louis, MO). Human serum was obtained from Dr. Worgall in the Department of Pathology and Cell Biology Medical, Columbia University.
3. Results and discussion
3.1. Surface characterization
Prior to functionalizing the graphene surface, we characterized the properties of the graphene specimen used to fabricate the nanosensor with a Raman microscope under the 532-nm laser excitation. In its Raman spectra (Fig. 3), the G band at 1587 cm−1 and 2D band at 2679 cm−1 are observed. These two bands were signature peaks of all graphitic sp2 materials. The intensity ratio of 2D band to the G band I2D/IG is 3.75, which was the further evidence of monolayer graphene [29]. The PASE functionalization splits the G band (1587 and 1626 cm−1), confirming the coupling of the graphene and pyrene groups on PASE [30]. The PASE immobilization shifted the 2D band to a higher wavenumber (from 2679 to 2684 cm−1), which was typical for PASE chemical doping [13]. In addition, the prominent D band at 1342 cm−1 compared with pristine graphene indicated the enhanced disorder of the graphene structure after the coupling of PASE molecules.
Fig. 3.
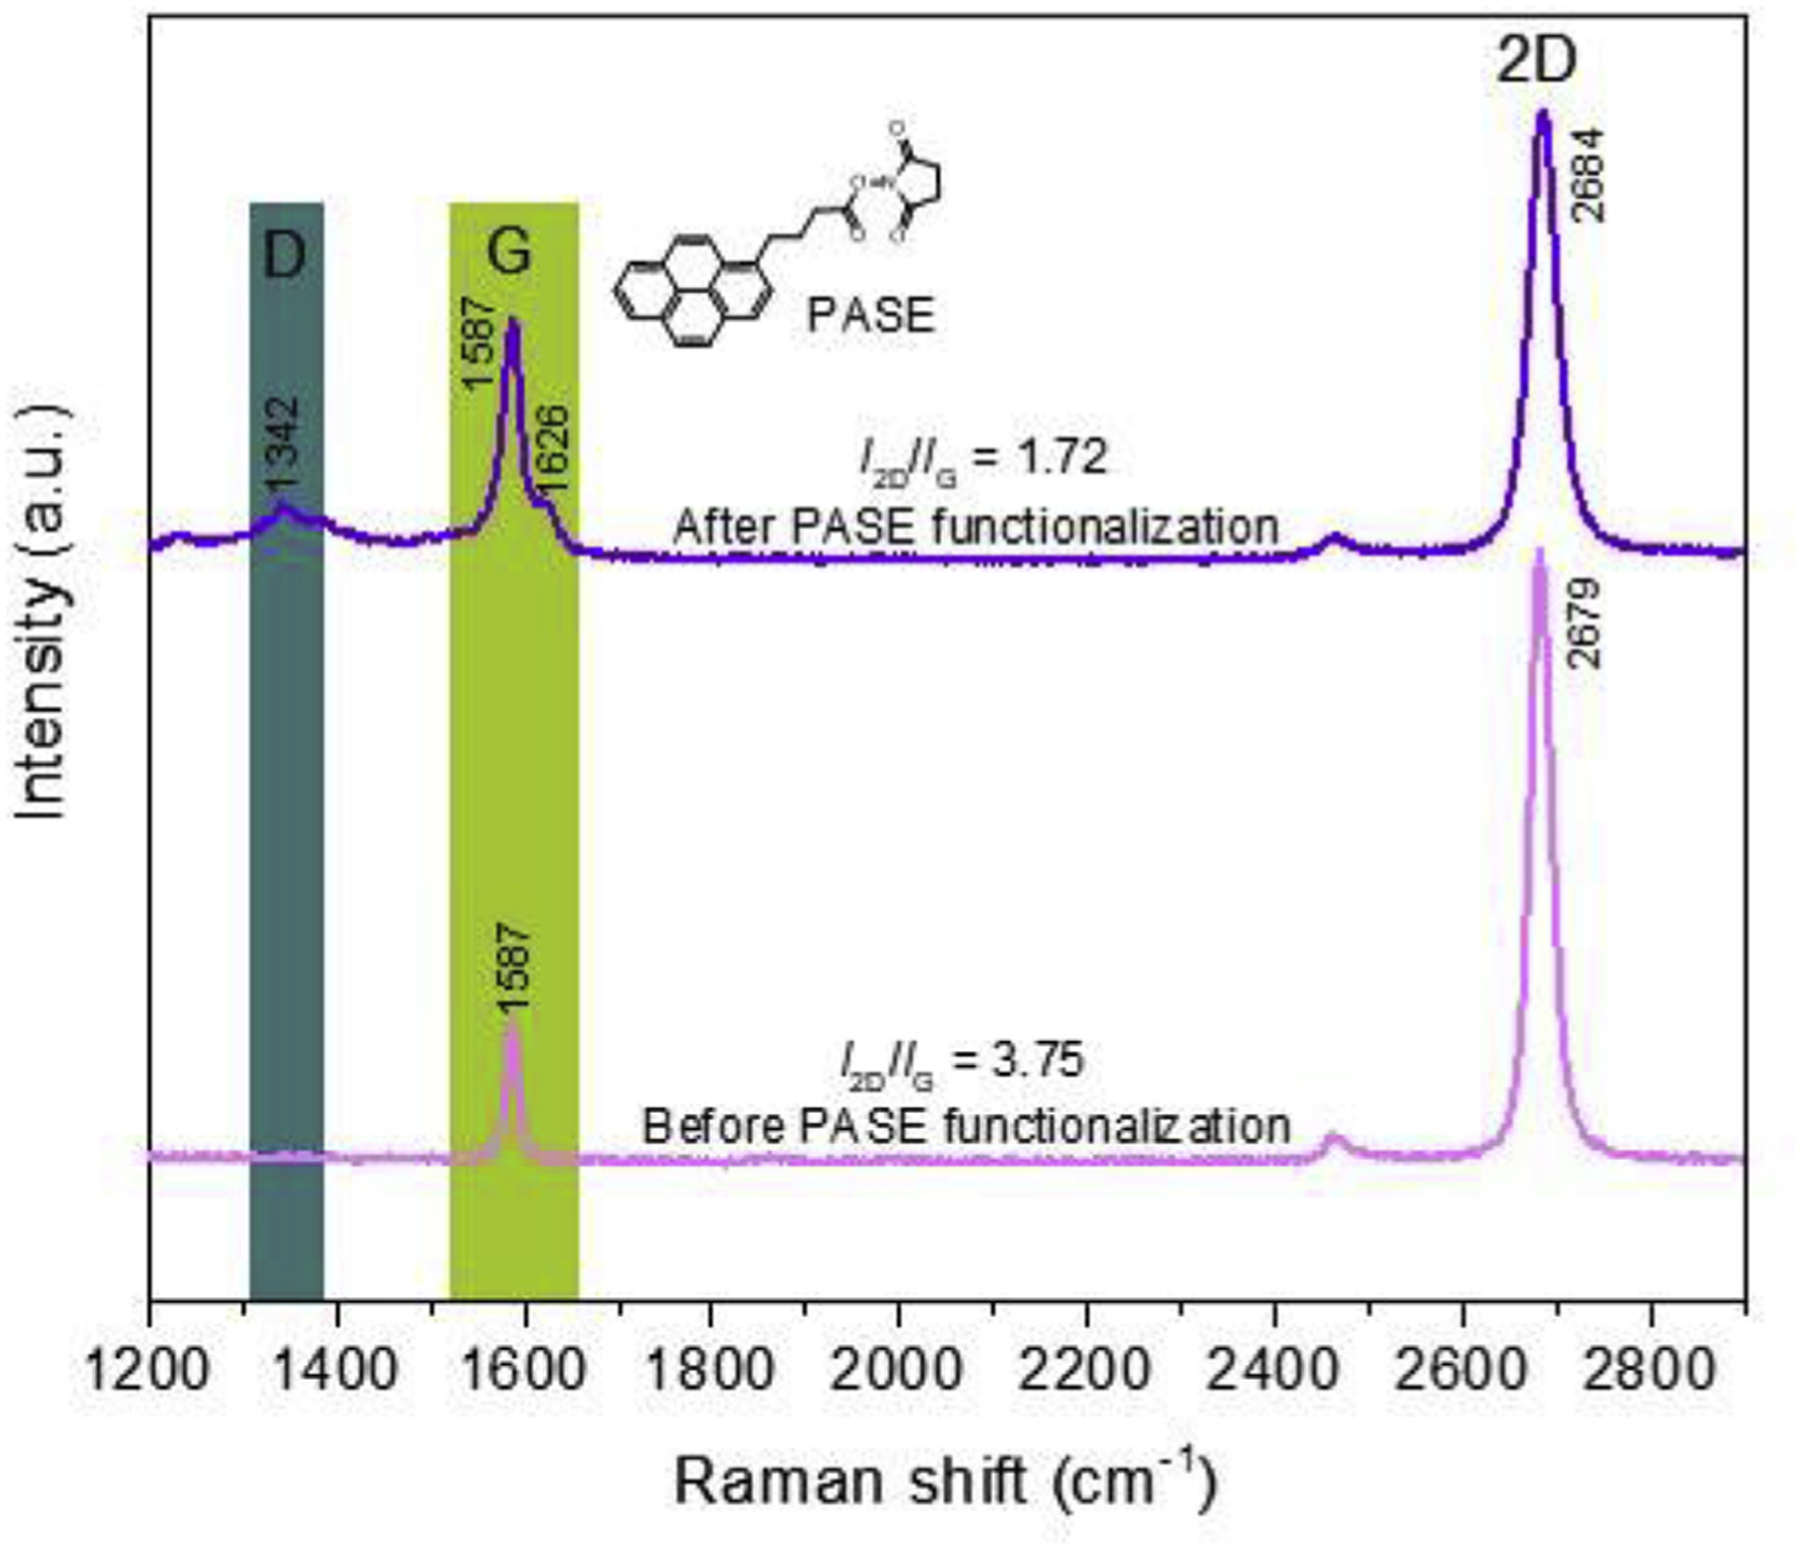
Raman spectra of graphene before and aptamer PASE functionalization. Signature peaks of π-π coupling between PASE and graphene are observed after PASE treatment.
We next investigated the serial functionalization of the graphene surface with the PEG and the IgE aptamer. Fig. 4 depicted atomic force microscopy (AFM) images of single-layer graphene and the aptamer-PEG-modified graphene. The height of graphene sheet after surface functionalization had a significant increase from 0.4 nm of pristine graphene in Fig. 4(a) to 6.1 nm of modified graphene in Fig. 4(b). Such a morphology change illustrated a successful functionalization of PEG and aptamer molecules. Furthermore, graphene surfaces functionalized with PEG and the aptamer, and graphene functionalized with only PEG were incubated with a solution containing fluorescently modified single-stranded DNA complementary to the aptamer and washed with buffer. The background-subtracted fluorescent intensities of the graphene surfaces were measured. The graphene surface modified with both PEG and the aptamer exhibited strong fluorescence intensity after incubation with the single-stranded DNA (~28.8 a.u.), while the graphene surface functionalized with only PEG showed negligible fluorescent intensity (~0.9 a.u.) (Fig. 5). Since the fluorescence-dyed single-stranded DNA only hybridized to the complementary aptamer, the fluorescence signal presented in the PEG and aptamer functionalized graphene confirmed the successful functionalization of PEG and aptamer on graphene.
Fig. 4.

AFM images of graphene surface before and after PEG and aptamer functionalization. (a) AFM image of pristine graphene, the 0.4 nm height indicates single-layer graphene. (b) AFM image of aptamer-PEG-modified graphene, the 6.1- nm thickness suggests the successful PEG and aptamer functionalization.
Fig. 5.

Characterization of surface functionalization. Both PEG-modified graphene and PEG-aptamer-modified surfaces is exposed to a fluorescence-labeled complementary DNA sequence to IgE-specific aptamer. Complementary DNA sequence hybridizes to the aptamer-PEG-graphene surface, but not the PEG-graphene surface.
3.2. Rejection of nonspecific adsorption
The ability of PEG to reject nonspecific adsorption of background molecules in serum to the nanosensor surface was characterized by measuring the transfer characteristics of bare or PEG-coated graphene surface in PBS buffer before and after incubating the surface in serum (Fig. 6). Incubation of bare graphene in serum reduced the Dirac point VDirac by approximately 50 mV (Fig. 6(a)), which was believed to reflect the direct doping caused by the accumulated background molecules adsorbed to graphene surface. In contrast, the PEG modified graphene did not exhibit any appreciable shift of VDirac after serum incubation (Fig. 6(b)), suggesting a significant reduction of nonspecific adsorption. This demonstrates the effectiveness of the PEG modification to repel non-target molecules. In general, despite the same layout of devices, graphene sheet used in each device had different electronic properties (e.g., carrier density and carrier mobility), leading to variations in the shape and magnitude of the transport characteristic curves (Fig. 6). Fortunately, such device-to-device variations did not significantly impact the VDirac, which was hence used as the primary sensor output.
Fig. 6.

Measured transfer characteristics of bare graphene and PEG-modified graphene before and after serum incubation. (a) Bare graphene. Significant shift of VDirac indicates nonspecific adsorption of background molecules in serum onto graphene surface. (b) PEG-modified graphene. No appreciable shift occurs, demonstrating the rejection of nonspecific adsorption by PEG nanolayer.
3.3. IgE detection in serum
The graphene nanosenor was then used to quantitatively measure the concentration of IgE spiked in human serum. When the device was exposed to serum solutions with increasing IgE concentrations from 50 pM to 250 nM as shown in Fig. 7(a) followed by gentle buffer rinsing and measuring in buffer, the Dirac point VDirac monotonically decreased towards the negative gate voltage from 0.298 to 0.268 V, suggesting that the binding of the aptamer to IgE introduced n-type doping to the graphene. The measurements were carried out in 0.01 × PBS buffer, for which the Debye length was estimated to be approximately 7.3 nm [31]. In our experiments, the Debye length would be even larger than this value due to the presence of the PEG layer [24]. On the other hand, AFM measurement showed that the aptamer-IgE complex was roughly 5.7 nm above the graphene surface (Fig. 4). Therefore, the binding of IgE with the aptamer should have at least partially taken place within the electrical double layer as evidenced by the sensor’s sensitive response.
Fig. 7.
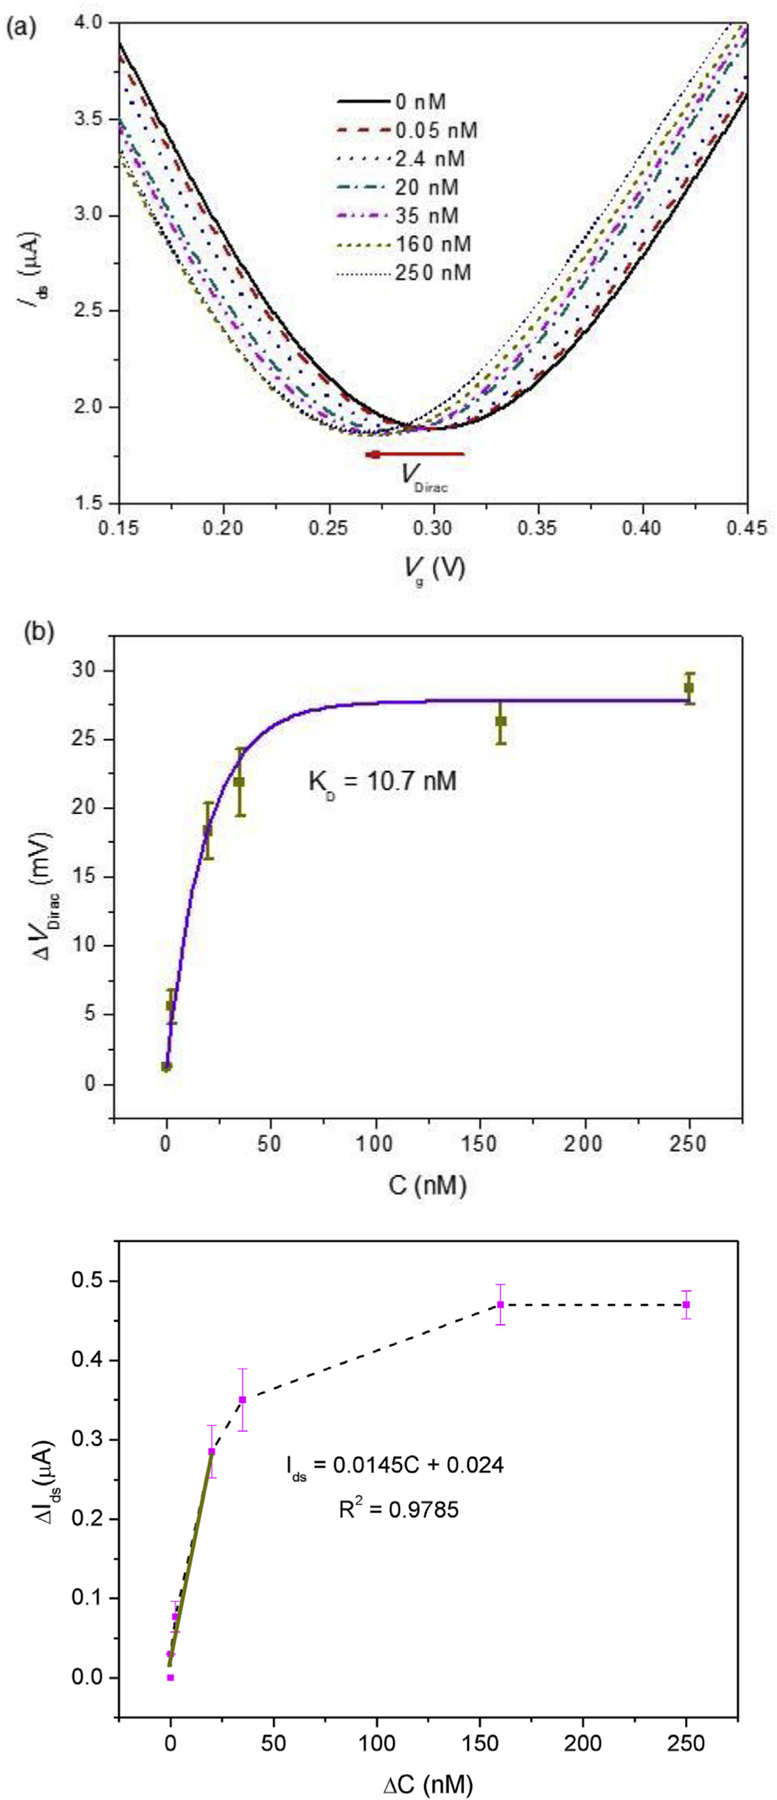
Quantitative measurement of IgE in human serum. (a) Measured transfer characteristics of the graphene nanosensor exposed to human serum spiked with IgE (concentration range: 50 pM −250 nM). (b) Shift of the Dirac point (ΔVDirac) as a function of the IgE concentration (CIgE) (three devices tested). The solid curve shows a fit to the Hill-Langmuir equation, yielding an equilibrium dissociation constant of KD = 10.7 nM. (c) Linear fit of the drain-source current change ΔIds for the linear range from 50 pM to 25 nM at fixed Vg = 0.2 V.
The physiochemical process involved in the IgE-aptamer binding is complex; thus the doping effects may be a result of two molecular interactions involving graphene. Theses two possible mechanisms, which combine to contribute to the observed sensor response, are discussed below. Further studies are needed in the future to understand and elucidate these mechanisms. First, Detection of large biomarkers, such as proteins, using an electrolyte-gated graphene FET is typically based on the electrostatic gating effect generated by the highly charged biomarkers on graphene. Under these circumstances, the charges induced in graphene are opposite to and hence in balance with the charges carried by target molecules. In our experiments, as IgE is reported to have overall positive charge at physiological pH [4], the binding of IgE proteins to the aptamer induces charges in graphene that were opposite to the charges carried by the target molecules, as a result of electrostatic gating effect. As such, n-type doping of graphene occurs. Second, upon the capture of IgE, the aptamer experiences a large change in conformational structure, becoming a stable compact structure. Conformational change of the aptamer brings electron-rich aromatic nucleotides to a close proximity of the graphene surface, resulting in direct interactions of nucleotide with the graphene and making direct electron transfer more likely from the backbone of aptamer into graphene through π–π interactions between them [6,32]. Such a claim can be corroborated by the physical process observed in the DNA immobilization on carbon nanotube [33] and graphene oxide sheet [34], which possibly serves as the underlying mechanism for the sensor response. As such, despite the heavily negatively charged DNA aptamer, the screening of DNA charge is believed to be negligible compared with the direct electron transfer. The specificity of the graphene nanosensor was confirmed by examining its response in serum spiked with immunoglobulin G (IgG) and immunoglobulin A (IgA), which were used as control molecules. IgG and IgA are similar to IgE in structure and thus can serve as appropriate control proteins for the aptamer binding specificity. The transport characteristic curves showed negligible shift for both IgG and IgA molecules (See Fig. S4 in Supplementary Information), suggesting the specificity of the graphene nanosensor to IgE molecules. This could be attributed to the high specificity of the aptamer to IgE and the effective resistance of PEG to nonspecific adsorption. The specificity of the nanosensor was also supported by previous studies of the low cross-reactivity (<5%) of the IgE-targeting D17.4 aptamer, which was used to functionalize the nanosensor, to proteins that exist at high concentrations in biological samples such as human serum albumin and bovine serum albumin [35].
We performed the IgE capture in serum and FET measurement in diluted PBS buffer. This use of different media required the replacement of serum with diluted PBS buffer during the sensor operation. Such an operation scheme could initiate the dissociation of IgE molecules from the aptamer. Thus, we conducted a time-resolved measurement of VDirac after the replacement by consecutively sweeping the gate voltage for 10 min and measuring the drain current of the graphene conducting channel continuously over time (see Fig. S5 in Supplementary Information). The experimental results showed, over a period of 1 min, an overall shift in the Dirac point that was 0.83% of that induced by IgE binding, As the measurement of the graphene transport characteristic curve of was completed well within 1 min, we concluded that the effect of IgE dissociation from the aptamer during medium replacement was negligible for purposes of IgE quantification. Such a negligible dissociation we believe can be attributed to that, the electrical measurement was performed in buffer at static flow conditions that reduced dissociation since the process was limited by the time for the dissociated IgE molecules to diffuse back to the bulk solution. It has been studied that electrostatic interactions between salts ions and negative-charged phosphate backbones of DNA facilitate the dissociation of aptamer-IgE complex [36,37]. Hence, the diluted PBS buffer with low salt-ionic strength used for measurements could further lower the dissociation rate of the aptamer-IgE complex.
It can be observed in Fig. 7(a) that transconductance (dIds/dVg) of both hole and electron conduction branches remain constant, at ~20.2 μS and ~16.3 μS respectively. Given that the ionic strength of the buffer did not change, the electrical double layer capacitance was also deemed unchanged by the IgE-aptamer binding [38]. We also investigated the change of source-drain current Ids at fixed gate voltage Vg. It was observed that the Ids either decreased or increased monotonically with increasing IgE concentration depending on whether the Vg was lower or higher than the VDirac, such reversed electrical transport in different conduction band is due to the ambipolar transport of graphene that can be described by the following equation [39]:
| (1) |
where C is the top-gate capacitance per unit area, μ is the carrier mobility, W and L are respectively the width and length of the graphene channel, and VDirac is voltage indicating Dirac point (Ids reaches the minimum). Experiments with three different devices were carried out to characterize the sensing performance of our graphene nanosensor. The Dirac point shift (ΔVDirac) as a function of IgE concentration (CIgE) is presented in Fig. 7(b). The error bars represent standard deviations of ΔVDirac, which mainly resulted from variations in the electrical and physicochemical properties of the individual devices tested. It can be seen that ΔVDirac sharply increased for CIgE ranging from 50 pM to 25 nM and then gradually reached the equilibrium state for CIgE above 160 nM. We fitted the experimental results to the following Hill-Langmuir equation that describes the equilibrium ligand-receptor binding [4].
| (2) |
where ΔVDirac,max and CIgE are the saturated shift of VDirac and IgE concentration respectively. As the fitted Hill-Langmuir curve lied in the error bars, our graphene nanosensors show good repeatability of the IgE detection in human serum. The fitted curve yielded an equilibrium dissociation constant KD of 10.7 nM, in good agreement with previously reported work [40]. We further studied the decrease of Ids with increased IgE concentration at an appropriate gate voltage Vg = 0.2 V (Fig. 7(c)). By performing a linear fit to the measurement data in the linear range (50 pM- 20 nM), the sensitivity of the nanosensor, defined as ΔIds/ΔCIgE, or the shift of Ids induced by unit IgE concentration, was determined to be 14.5 nA/nM. This sensitivity, along with the estimated noise level of 0.227 nA for the measurement system, was used to determine the limit of detection (LOD), the lowest IgE concentration that could be reliably detected: LOD = (S/N × Noise)/Sensitivity ≈ 47 pM, where a signal-to-noise ratio of S/N = 3 was used. The estimated LOD of 47 pM is clinically relevant [41], and it is comparable to previous reported detection limit for IgE in buffer by carbon nanotube and quartz crystal microbalance sensors [42,43]. Also, when compared with traditional microfabricated semiconductor FET biosensors that have been reported to offer detection limits on the order of micromolars for detection of proteins in buffer [44], this LOD, in more complex samples (serum), of the graphene FET nanosensor represents a drastic improvement.
4. Conclusions
We have presented a graphene-based affinity nanosensor for biomarker detection in human serum, using IgE as a representative biomarker. The nanosensor employed an FET-based design in which graphene in which graphene was sequentially functionalized with PEG and aptamer. The sequential aptamer-PEG functionalization scheme enables the aptamer to be readily accessible to the biomarker in serum, while the PEG reduces or rejects the nonspecific adsorption of background molecules. This graphene nanosensor operated in a scheme where the capture and detection of the biomarker were decoupled, with the biomarker captured from serum and FET measurements of the resulting biomarkeraptamer complex in diluted buffer to provide reasonable Debye length, which was further increased by the immobilized PEG nanolayer, allowing the aptamer-biomarker binding to induce a significantly measurable change in the graphene’s electric conductivity. As we recognize the complexity of the sensor response, we believe that two possible mechanisms combines to contribute to the observed nanosensor response including the electrostatic gating effect from captured IgE molecule and direct electron transfer from aptamer to graphene. Experimental results showed that the scheme of sequential functionalization of the PEG and aptamer effectively rejected the nonspecific adsorption of background molecules in serum to the graphene surface. The graphene nanosensor was tested in human serum spiked with IgE at concentrations ranging from 50 pM to 250 nM, yielding a limit of detection of 47 pM. These characteristics are clinically relevant and demonstrate the potential of the graphene nanosensor for specific, quantitative and label-free detection of biomarkers in physiological fluids.
Supplementary Material
Acknowledgements
This work was supported by the National Science Foundation, United States (Grant No. ECCS-1509760) and National Institutes of Health (Grant No. 1R33CA196470-01A1). X. Wang gratefully acknowledges a National Scholarship (Award No. 201406740003) from the China Scholarship Council. The authors would also like to thank Dr. Tilla S. Worgall at the Department of Pathology and Cell Biology, Columbia University, for providing human serum used in the experiments.
Footnotes
Appendix A. Supplementary data
Supplementary data to this article can be found online at https://doi.org/10.1016/j.electacta.2018.08.062.
References
- [1].Huang J, Luo X, Lee I, Hu Y, Cui XT, Yun M, Rapid real-time electrical detection of proteins using single conducting polymer nanowire-based microfluidic aptasensor, Biosens. Bioelectron 30 (2011) 306–309. [DOI] [PMC free article] [PubMed] [Google Scholar]
- [2].Lee H-S, Kim KS, Kim C-J, Hahn SK, Jo M-H, Electrical detection of VEGFs for cancer diagnoses using anti-vascular endotherial growth factor aptamer-modified Si nanowire FETs, Biosens. Bioelectron 24 (2009) 1801–1805. [DOI] [PubMed] [Google Scholar]
- [3].So H-M, Won K, Kim YH, Kim B-K, Ryu BH, Na PS, Kim H, Lee J-O, Single-walled carbon nanotube biosensors using aptamers as molecular recognition elements, J. Am. Chem. Soc 127 (2005) 11906–11907. [DOI] [PubMed] [Google Scholar]
- [4].Ohno Y, Maehashi K, Matsumoto K, Label-free biosensors based on aptamer-modified graphene field-effect transistors, J. Am. Chem. Soc 132 (2010) 18012–18013. [DOI] [PubMed] [Google Scholar]
- [5].Novoselov KS, Geim AK, Morozov S, Jiang D, Zhang Y, S.a. Dubonos, I. Grigorieva, A. Firsov, Electric field effect in atomically thin carbon films, Science 306 (2004) 666–669. [DOI] [PubMed] [Google Scholar]
- [6].Dong X, Shi Y, Huang W, Chen P, Li LJ, Electrical detection of DNA hybridization with single-base specificity using transistors based on CVD-grown graphene sheets, Adv. Mater 22 (2010) 1649–1653. [DOI] [PubMed] [Google Scholar]
- [7].Lin Y-M, Avouris P, Strong suppression of electrical noise in bilayer graphene nanodevices, Nano Lett. 8 (2008) 2119–2125. [DOI] [PubMed] [Google Scholar]
- [8].Hu K, Yang H, Zhou J, Zhao S, Tian J, Aptasensor for amplified IgE sensing based on fluorescence quenching by graphene oxide, Luminescence 28 (2013) 662–666. [DOI] [PubMed] [Google Scholar]
- [9].Rodrigo D, Limaj O, Janner D, Etezadi D, de Abajo FJG, Pruneri V, Altug H, Mid-infrared plasmonic biosensing with graphene, Science 349 (2015) 165–168. [DOI] [PubMed] [Google Scholar]
- [10].Zhu AY, Yi F, Reed JC, Zhu H, Cubukcu E, Optoelectromechanical multimodal biosensor with graphene active region, Nano Lett. 14 (2014) 5641–5649. [DOI] [PubMed] [Google Scholar]
- [11].Sun J-Y, Huang K-J, Wei S-Y, Wu Z-W, Ren F-P, A graphene-based electrochemical sensor for sensitive determination of caffeine, Colloids Surf. B Biointerfaces 84 (2011) 421–426. [DOI] [PubMed] [Google Scholar]
- [12].Pu Z, Zou C, Wang R, Lai X, Yu H, Xu K, Li D, A continuous glucose monitoring device by graphene modified electrochemical sensor in microfluidic system, Biomicrofluidics 10 (2016), 011910. [DOI] [PMC free article] [PubMed] [Google Scholar]
- [13].Zhu Y, Hao Y, Adogla EA, Yan J, Li D, Xu K, Wang Q, Hone J, Lin Q, A graphene-based affinity nanosensor for detection of low-charge and low-molecular-weight molecules, Nanoscale 8 (2016) 5815–5819. [DOI] [PMC free article] [PubMed] [Google Scholar]
- [14].Zhou W, Huang P-JJ, Ding J, Liu J, Aptamer-based biosensors for biomedical diagnostics, Analyst 139 (2014) 2627–2640. [DOI] [PubMed] [Google Scholar]
- [15].Lakhin A, Tarantul V, Gening L, Aptamers: problems, solutions and prospects, Acta Naturae (англоязычная версия) 5 (2013). [PMC free article] [PubMed] [Google Scholar]
- [16].Zheng C, Huang L, Zhang H, Sun Z, Zhang Z, Zhang G-J, Fabrication of ultrasensitive field-effect transistor DNA biosensors by a directional transfer technique based on CVD-grown graphene, ACS Appl. Mater. Interfaces 7 (2015) 16953–16959. [DOI] [PubMed] [Google Scholar]
- [17].Hao Z, Zhu Y, Wang X, Rotti PG, DiMarco C, Tyler SR, Zhao X, Engelhardt JF, Hone J, Lin Q, Real-time monitoring of insulin using a graphene field-effect transistor aptameric nanosensor, ACS Appl. Mater. Interfaces 9 (2017) 27504–27511. [DOI] [PMC free article] [PubMed] [Google Scholar]
- [18].Shan Y, Tiwari P, Krishnakumar P, Vlassiouk I, Li W, Wang X, Darici Y, Lindsay S, Wang H, Smirnov S, Surface modification of graphene nanopores for protein translocation, Nanotechnology 24 (2013) 495102. [DOI] [PMC free article] [PubMed] [Google Scholar]
- [19].Kim D-J, Sohn IY, Jung J-H, Yoon OJ, Lee N-E, Park J-S, Reduced graphene oxide field-effect transistor for label-free femtomolar protein detection, Biosens. Bioelectron 41 (2013) 621–626. [DOI] [PubMed] [Google Scholar]
- [20].Wei X-Q, Hao L-Y, Shao X-R, Zhang Q, Jia X-Q, Zhang Z-R, Lin Y-F, Peng Q, Insight into the interaction of graphene oxide with serum proteins and the impact of the degree of reduction and concentration, ACS Appl. Mater. Interfaces 7 (2015) 13367–13374. [DOI] [PubMed] [Google Scholar]
- [21].Forsyth R, Devadoss A, Guy OJ, Graphene field effect transistors for biomedical applications: current status and future prospects, Diagnostics 7 (2017) 45. [DOI] [PMC free article] [PubMed] [Google Scholar]
- [22].Jain A, Liu R, Xiang YK, Ha T, Single-molecule pull-down for studying protein interactions, Nat. Protoc 7 (2012) 445–452. [DOI] [PMC free article] [PubMed] [Google Scholar]
- [23].Gao N, Gao T, Yang X, Dai X, Zhou W, Zhang A, Lieber CM, Specific detection of biomolecules in physiological solutions using graphene transistor biosensors, Proc. Natl. Acad. Sci 113 (2016) 14633–14638. [DOI] [PMC free article] [PubMed] [Google Scholar]
- [24].Gao N, Zhou W, Jiang X, Hong G, Fu T-M, Lieber CM, General strategy for biodetection in high ionic strength solutions using transistor-based nanoelectronic sensors, Nano Lett. 15 (2015) 2143–2148. [DOI] [PMC free article] [PubMed] [Google Scholar]
- [25].Piccinini E, Alberti S, Longo GS, Berninger T, Breu J, Dostalek J, Azzaroni O, Knoll W, Pushing the boundaries of interfacial sensitivity in graphene FET sensors: polyelectrolyte multilayers strongly increase the Debye screening length, J. Phys. Chem. C 122 (18) (2018) 10181–10188. [Google Scholar]
- [26].Binazadeh M, Zeng H, Unsworth LD, Inhibiting Nonspecific Protein Adsorption: Mechanisms, Methods, and Materials, Biomaterials Surface Science, 2013, pp. 45–61. [Google Scholar]
- [27].Kirschbaum B, Loss of carbon dioxide from serum samples exposed to air. Effect on blood gas parameters and strong ions, Clin. Chim. Acta 334 (2003) 241–244. [DOI] [PubMed] [Google Scholar]
- [28].Wiegand TW, Williams PB, Dreskin SC, Jouvin MH, Kinet JP, Tasset D, High-affinity oligonucleotide ligands to human IgE inhibit binding to Fc epsilon receptor I, J. Immunol 157 (1996) 221. [PubMed] [Google Scholar]
- [29].Hao Y, Wang Y, Wang L, Ni Z, Wang Z, Wang R, Koo CK, Shen Z, Thong JT, Probing layer number and stacking order of few-layer graphene by Raman spectroscopy, Small 6 (2010) 195–200. [DOI] [PubMed] [Google Scholar]
- [30].Li S, Zhou Q, Chu W, Zhao W, Zheng J, Surface-enhanced Raman scattering behaviour of 4-mercaptophenyl boronic acid on assembled silver nanoparticles, Phys. Chem. Chem. Phys 17 (2015) 17638–17645. [DOI] [PubMed] [Google Scholar]
- [31].Stern E, Wagner R, Sigworth FJ, Breaker R, Fahmy TM, Reed MA, Importance of the Debye screening length on nanowire field effect transistor sensors, Nano Lett. 7 (2007) 3405–3409. [DOI] [PMC free article] [PubMed] [Google Scholar]
- [32].Manohar S, Mantz AR, Bancroft KE, Hui C-Y, Jagota A, Vezenov DV, Peeling single-stranded DNA from graphite surface to determine oligonucleotide binding energy by force spectroscopy, Nano Lett. 8 (2008) 4365–4372. [DOI] [PMC free article] [PubMed] [Google Scholar]
- [33].Star A, Tu E, Niemann J, Gabriel J-CP, Joiner CS, Valcke C, Label-free detection of DNA hybridization using carbon nanotube network field-effect transistors, Proc. Natl. Acad. Sci. U. S. A 103 (2006) 921–926. [DOI] [PMC free article] [PubMed] [Google Scholar]
- [34].Cai B, Wang S, Huang L, Ning Y, Zhang Z, Zhang G-J, Ultrasensitive label-free detection of PNA–DNA hybridization by reduced graphene oxide field-effect transistor biosensor, ACS Nano 8 (2014) 2632–2638. [DOI] [PubMed] [Google Scholar]
- [35].Gokulrangan G, Unruh JR, Holub DF, Ingram B, Johnson CK, Wilson GS, DNA aptamer-based bioanalysis of IgE by fluorescence anisotropy, Anal. Chem 77 (2005) 1963–1970. [DOI] [PubMed] [Google Scholar]
- [36].Poongavanam M-V, Kisley L, Kourentzi K, Landes CF, Willson RC, Ensemble and single-molecule biophysical characterization of D17. 4 DNA aptamer–IgE interactions, Biochim. Biophys. Acta BBA Protein Proteom 1864 (2016) 154–164. [DOI] [PubMed] [Google Scholar]
- [37].Wang X, Hao Z, Zhuang W, Lin Q, Characterization of biomolecules using an aptamer-based graphene nanosensor, in: 2017 IEEE 30th International Conference on Micro Electro Mechanical Systems (MEMS), 2017, pp. 565–568. [Google Scholar]
- [38].Wang C, Li Y, Zhu Y, Zhou X, Lin Q, He M, High-κ solid-gate transistor configured graphene biosensor with fully integrated structure and enhanced sensitivity, Adv. Funct. Mater 26 (2016) 7668–7678. [Google Scholar]
- [39].Kim BJ, Jang H, Lee S-K, Hong BH, Ahn J-H, Cho JH, High-performance flexible graphene field effect transistors with ion gel gate dielectrics, Nano Lett. 10 (2010) 3464–3466. [DOI] [PubMed] [Google Scholar]
- [40].Wiegand TW, Williams PB, Dreskin SC, Jouvin M-H, Kinet J-P, Tasset D, High-affinity oligonucleotide ligands to human IgE inhibit binding to Fc epsilon receptor I, J. Immunol 157 (1996) 221–230. [PubMed] [Google Scholar]
- [41].Sinclair D, Peters S, The predictive value of total serum IgE for a positive allergen specific IgE result, J. Clin. Pathol 57 (2004) 956–959. [DOI] [PMC free article] [PubMed] [Google Scholar]
- [42].Khezrian S, Salimi A, Teymourian H, Hallaj R, Label-free electrochemical IgE aptasensor based on covalent attachment of aptamer onto multiwalled carbon nanotubes/ionic liquid/chitosan nanocomposite modified electrode, Biosens. Bioelectron 43 (2013) 218–225. [DOI] [PubMed] [Google Scholar]
- [43].Yao C, Qi Y, Zhao Y, Xiang Y, Chen Q, Fu W, Aptamer-based piezoelectric quartz crystal microbalance biosensor array for the quantification of IgE, Biosens. Bioelectron 24 (2009) 2499–2503. [DOI] [PubMed] [Google Scholar]
- [44].Pohanka M, Leuchter J, Biosensors based on semiconductors, a review, Int. J. Electrochem. Sci 12 (2017) 6611–6621. [Google Scholar]
Associated Data
This section collects any data citations, data availability statements, or supplementary materials included in this article.