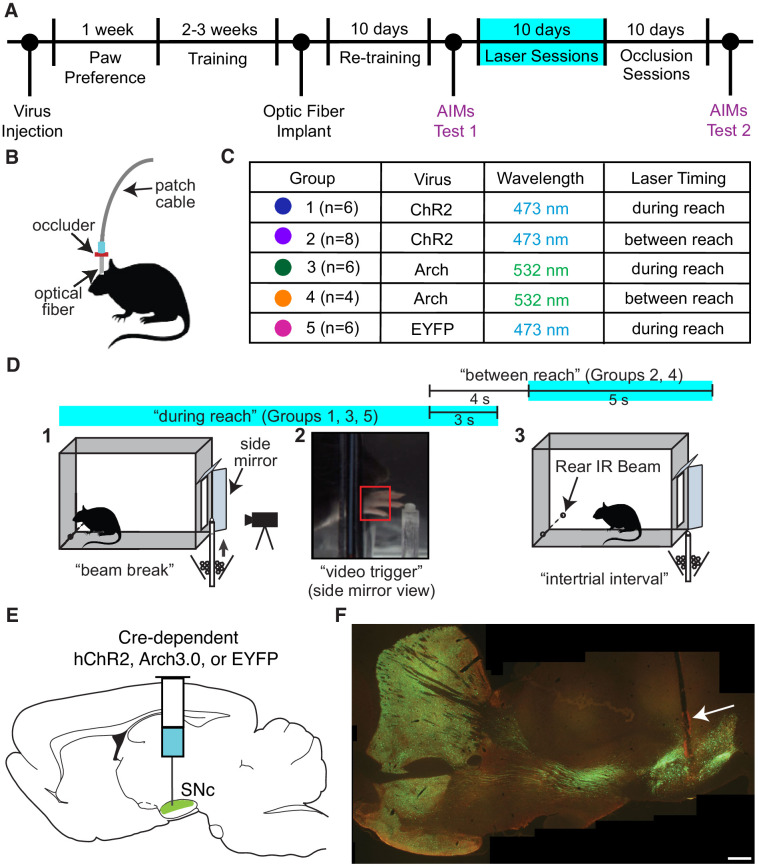
Figure 1. Experimental framework.
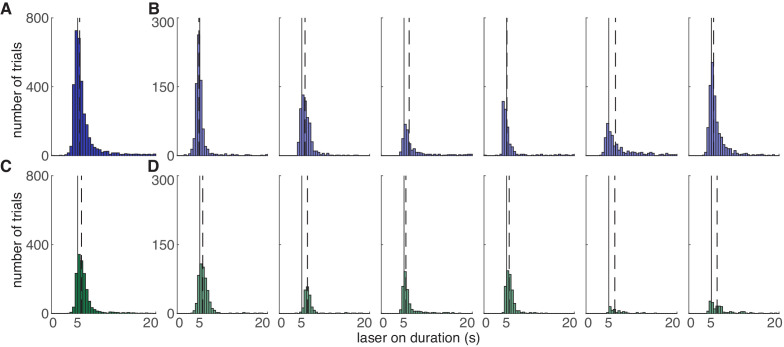
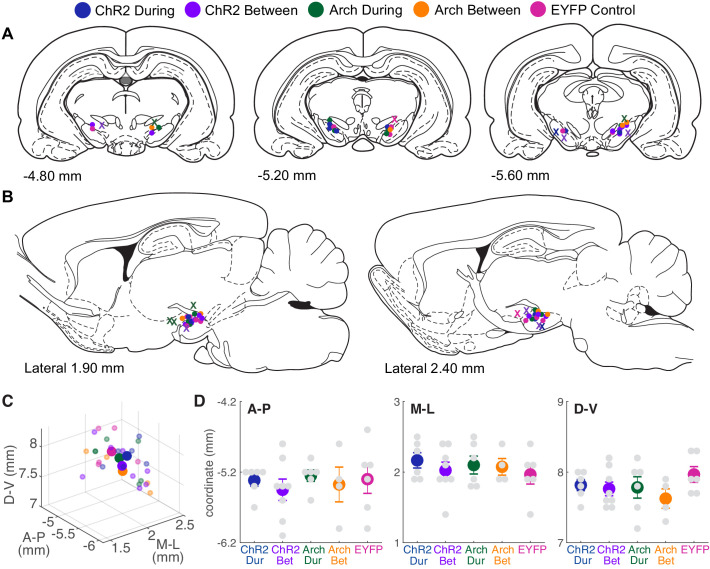
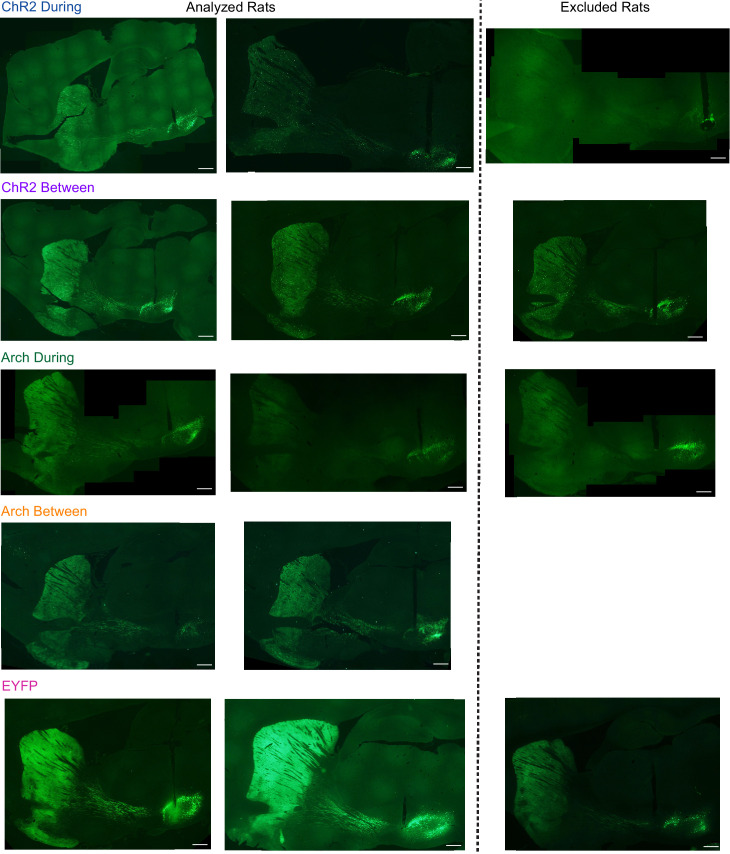
(A) Timeline for a single experiment. AIMs Test – Abnormal Involuntary Movement testing (see ‘Dopamine neuron stimulation induces context- and history-dependent abnormal involuntary movements’). The ‘ChR2 between’ group also received ‘during reach’ stimulation after ‘occlusion’ sessions (see Figure 11). (B) Light was physically occluded from entering the brain by obstructing the connection between the optical fiber and patch cable during ‘occlusion’ sessions. (C) Rats were assigned to one of five groups based on virus injected and timing of optogenetic manipulation. n is the number of rats included in the analysis for each group (see Materials and methods). Dot colors correspond with the color used to represent each group in subsequent figures. (D) A single skilled reaching trial. 1 – rat breaks IR beam at the back of the chamber to request a sugar pellet (‘beam break’). 2 – Real-time analysis detects the paw breaching the reaching slot to trigger 300 fps video from 1 s before to 3.33 s after the trigger event (‘video trigger’). 3 – 2 s after the trigger event, the pellet delivery rod resets and the rat can initiate a new trial (‘intertrial interval’). Optogenetic manipulations occurred either during reaching (beam break to 3 s after ‘video trigger’) or between reaches (beginning 4 s after ‘video trigger’ and lasting 5 s). Figure 1—figure supplement 1 shows the distribution of the duration of ‘during reach’ laser-on epochs. (E) Double-floxed ChR2-EYFP, Arch-EYFP, or control EYFP constructs were injected bilaterally into SNc. (F) Immunohistochemistry against EYFP showing expression of a fused ChR2-EYFP construct in the nigrostriatal pathway. Optical fibers (arrow) were implanted over SNc contralateral to the rat’s preferred reaching paw. Estimated locations of all fiber tips are shown in Figure 1—figure supplement 2. Representative immunohistochemistry images from each group are shown in Figure 1—figure supplement 3. Scale bar = 1 mm.


