Abstract
The plant pathogenic fungus, Colletotrichum higginsianum is widely used to understand infection mechanisms, as it infects the model plant Arabidopsis thaliana. To determine the virulence of C. higginsianum, several methods have been developed, such as disease reaction scoring, lesion measurement, entry rate assays, and relative fungal biomass assays using real-time quantitative PCR. Although many studies have taken advantage of these methods, they have shortcomings in terms of objectivity, time, or cost. Here, we show a lesion area detection method applying ImageJ color thresholds to images of A. thaliana leaves infected by C. higginsianum. This method can automatically detect multiple lesions in a short time without the requirement for special equipment and measures lesion areas in a standardized way. This high throughput technique will aid better understanding of plant immunity and pathogenicity and contribute to reproducibility of assays.
Keywords: Colletotrichum higginsianum, Fungal phytopathogen, Arabidopsis thaliana, Infection assay, ImageJ
Background
Colletotrichum fungi cause anthracnose disease in a broad range of plants, including important crops, and have a serious economic impact ( Cannon et al., 2012 ). Among Colletotrichum species, C. higginsianum infects Brassicaceae plants, including the model plant Arabidopsis thaliana (O’ Connell et al., 2004 ). Thus, this pathogen has been used for various studies that have revealed molecular mechanisms of plant immunity and pathogenicity ( Birker et al., 2009 ; Narusaka et al., 2009 ; Kleemann et al., 2012 ; Takahara et al., 2016 ; Plaumann et al., 2018 ). Moreover, recently released high-quality genome assemblies of C. higginsianum provide genomic resources that should increase the use of this fungus in functional studies by facilitating the identification of candidate genes of interest ( Zampounis et al., 2016 ; Tsushima et al., 2019 ). In order to determine the virulence of C. higginsianum, initial studies employed disease reaction scores based on visual observation and subjective judgement (O’ Connell et al., 2004 ; Narusaka et al., 2004 ). The necessity for more objective approaches has led to the development of alternative methods including lesion diameter measurement, entry rate assays, and measurement of relative fungal biomass using real-time quantitative PCR ( Narusaka et al., 2010 ; Hiruma and Saijo, 2016). These methods are commonly employed in studies using C. higginsianum, yet they have disadvantages, such as the variability of lesion shapes leading to differences in measured values between observers, time-consuming steps, or the economic burden of purchasing reagents. ImageJ has been used as an open source tool for the analysis of scientific images ( Schneider et al., 2012 ). In the field of plant pathology, many studies have utilized ImageJ to analyze pathogenicity or resistance, for instance by measuring lesion sizes ( Dagdas et al., 2016 ; Kumakura et al., 2019 ). However, these procedures can be further automated. Therefore, we developed an objective, automated, and affordable method to detect and measure lesion areas from images of A. thaliana leaves infected by C. higginsianum using ImageJ. In this article, we describe how to perform infection assays to study the A. thaliana-C. higginsianum interaction and how to detect and measure lesions using ImageJ macros to record multiple lesion areas at one time. This method enables us to reproducibly perform infection assays with the A. thaliana-C. higginsianum pathosystem and may be adapted to other pathosystems. For example, ImageJ color thresholds were also used to measure lesion areas on C. shisoi-infected A. thaliana ( Gan et al., 2019 ). This protocol will allow us to perform objective and high throughput analyses to gain further insights into plant-microbe interactions.
Materials and Reagents
50 ml conical tube (e.g., Falcon 50 ml Conical Centrifuge Tubes, Corning Inc., catalog number: 352070)
Nylon mesh (100 μm pore size) cut into 11 x 11 cm square
Surgical tape
1.5 ml microcentrifuge tube (e.g., 1.5 ml Sampling Tubes, Round Bottom, FUKAE KASEI Co., Ltd., catalog number: 131-615C)
Petri dish
Paper towel
Permanent marker
-
A. thaliana plants grown at 22 °C with a 10-h photoperiod for 4 weeks
Note: We recommend including genotypes known to show clear resistant and susceptible phenotypes as controls. In the case of infection assays using C. higginsianum MAFF 305635, Ws-2 and Ler-0 can be used as controls for resistance and susceptible phenotypes, respectively.
C. higginsianum strains
Potato dextrose agar (Potato Dextrose Agar, Nissui Pharmaceutical Co., Ltd., catalog number: 05709) prepared in Petri dishes
Sterilized water
Equipment
Airtight transparent plastic container with a rubber seal lid
-
Painting brush (autoclaved) (e.g., Nylon watercolor brush (brown hair) flat, Artec Co., Ltd., catalog number: 10629)
Note: Any painting brush can be used. We autoclave painting brushes to eliminate any contaminants from previous experiments and reuse them.
-
Funnels (autoclaved)
Note: We autoclave funnels for the same reason of painting brushes.
Centrifugal machine (e.g., High speed refrigerated micro centrifuge, TOMY SEIKO Co., Ltd., catalog number: MX-307)
Incubator (dark condition, 24 °C) (e.g., Cool incubator, Mitsubishi Electric Corporation, catalog number: CN-25C)
Growth chamber with BLB light (light/dark = 12 h/12 h, 24 °C) (e.g., Growth cabinet, SANYO Electric Co., Ltd., catalog number: MLR-350 and Blacklight blue, Hitachi, Ltd., catalog number: FL40SBLB)
Hemacytometer (e.g., Reichert Bright-Line, Hausser Scientific Co., catalog number: 1492)
Light microscope (e.g., Binocular Microscope, Olympus Corporation, catalog number: CX31)
Pipette that can measure 5 μl (e.g., PIPETMAN Classic P20, Gilson Inc., catalog number: F123600)
Spray bottle (500 ml)
Digital camera (e.g., EOS Kiss X6i, Canon Inc., catalog number: 6557B001)
Camera stand (e.g., Copy stand CS-A4, LPL Co., Ltd., catalog number: L18142)
Scissors
Forceps
White plastic tray
Scale
Software
ImageJ v1.52p (Rasband, W.S., ImageJ, U. S. National Institutes of Health, Bethesda, Maryland, USA, https://imagej.nih.gov/ij/, 1997-2018)
Procedure
-
Preparation of A. thaliana plants and C. higginsianum culture
Culture fungal strains on potato dextrose agar at 24 °C under 12-h black-light blue fluorescent bulb light/12-h dark conditions for 1 week (Figure 1A).
-
Set up at least 8 replicate A. thaliana plants for each genotype to be tested in airtight transparent plastic containers with about 1 cm of water (Figure 1B).
Note: The lid of this transparent plastic container should have a rubber seal to maintain 100% humidity conditions during infection.
-
Mark 3 petioles of fully expanded leaves per plant using a permanent marker (Figure 1C).
Note: We recommend completing all the steps given above before starting to prepare conidia suspensions.
-
Inoculation with C. higginsianum
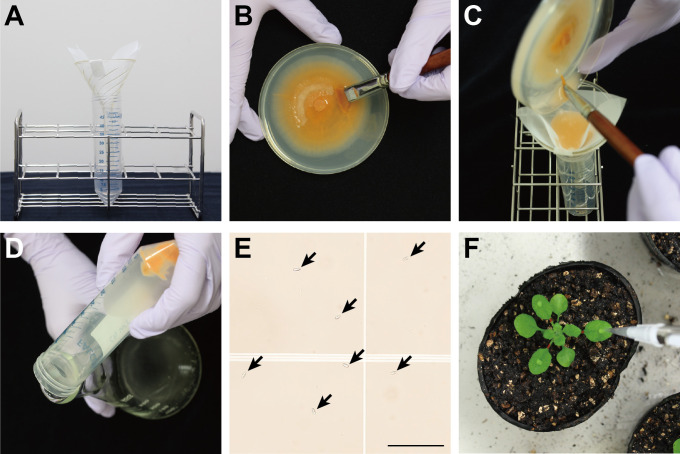
Place an autoclaved filter funnel in a 50 ml conical tube and fix a folded piece of nylon mesh to the funnel using a piece of surgical tape (Figure 2A).
Add 10 ml of room temperature sterilized water to the fungal culture in a Petri dish and gently scrape the surface using an autoclaved painting brush to release conidia (Figure 2B).
-
Pour the conidial suspension through the nylon mesh in the funnel to separate mycelia from conidia (Figure 2C).
Note: Conidia should pass through the nylon mesh, but mycelia should not.
After centrifugation at 4,500 × g for 5 min at room temperature, remove the supernatant by decanting (Figure 2D).
Resuspend the conidial pellet in 2 ml of distilled water.
-
Prepare a 1/100 diluted conidia suspension in distilled water in an Eppendorf® microcentrifuge tube and determine the concentration of the original suspension using a hemacytometer (Figure 2E).
Note: Depending on the conidial concentration, you can prepare different dilution series to obtain ~100 conidia/mm2 on a hemacytometer.
Prepare at least 1 ml of 5 x 10⁵ conidia/ml suspension in an Eppendorf® microcentrifuge tube.
-
Open the lid of the transparent plastic container and inoculate 5 μl of the conidia suspension per leaf on the surface of the selected leaves using a pipette (Figure 2F).
Note: We recommend inoculating plants where they will be grown during pathotests to minimize the risk of the inoculated conidia suspension running off from the leaf surface during transportation.
-
Spray tap water on the backside of a lid of a transparent plastic container using a spray bottle. Then, seal the lid of the container and carefully place the container in the growth chamber.
Note: Do not open the lid until 5 days post-infection to maintain 100% humidity during infection.
-
Preparing images of symptoms
-
Set up a digital camera on a camera stand and set magnification, aperture, shutter speed, and ISO.
Note: Adjust your camera and exposure settings to minimize shadows and reflections in the images. Make sure to use the same settings for reproducibility when you repeat experiments. For this reason, we also recommend taking photos in a room without windows to avoid the effect of sunshine.
Open the lid of the transparent plastic container. If necessary, gently wipe water droplets on the leaf surface using a paper towel to avoid capturing water-reflected light.
-
Cut the marked petioles, put leaves on a white tray and take photos.
Note: The white tray provides a uniform white background for the images. Make sure to include a ruler in images of inoculated leaves.
-
Figure 1. Preparation of A. thaliana plants and C. higginsianum culture.
A. 7-day-old culture of C. higginsianum MAFF 305635 on potato dextrose agar incubated at 24 °C under 12-h black-light blue fluorescent bulb light/12-h dark conditions. B. Airtight transparent plastic container with A. thaliana plants. C. Marked petioles using a permanent marker (White arrows).
Figure 2. Inoculation with C. higginsianum.
A. Setup to separate mycelia from conidia. B. Scraping the fungal culture using a painting brush to obtain conidia suspension. C. Filtering the conidia suspension through nylon mesh. D. Conidial pellet after centrifugation. E. Conidia on a hemacytometer (Black arrows). Bar = 100 μm. F. Inoculation of conidia on the leaf surface using a pipette.
Data analysis
Note: For data analysis using ImageJ, you can also refer to the video tutorials provided in this article (Videos 1 and 2).
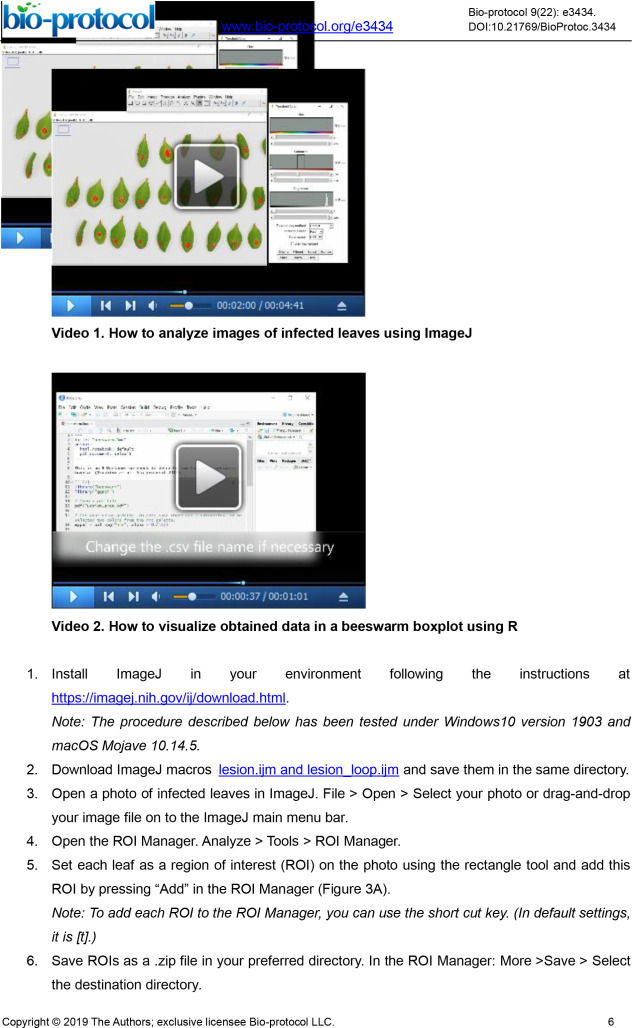
Video 1. How to analyze images of infected leaves using ImageJ.
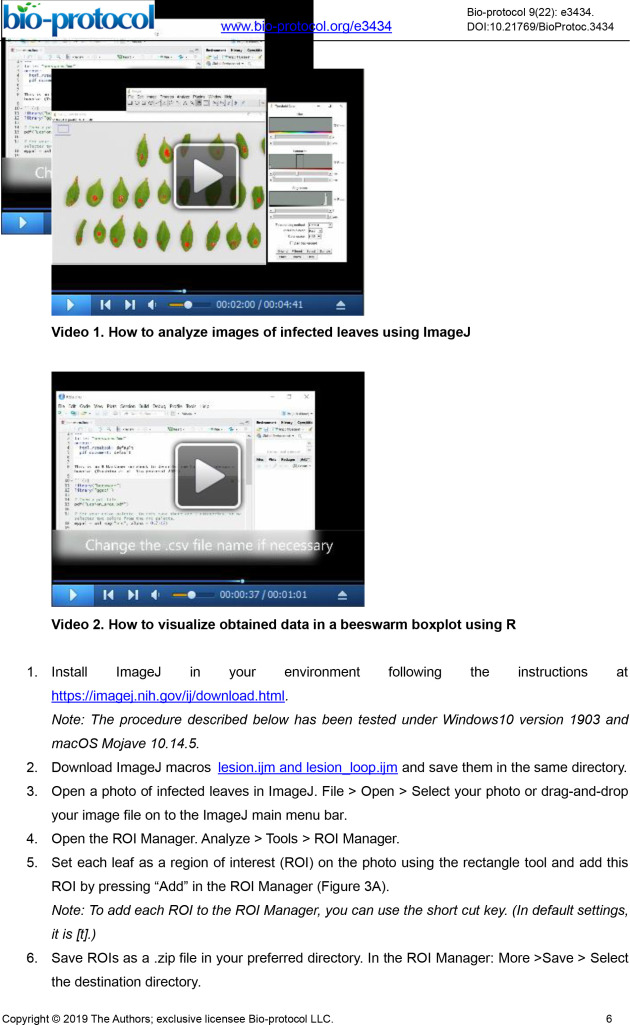
Video 2. How to visualize obtained data in a beeswarm boxplot using R.
-
Install ImageJ in your environment following the instructions at https://imagej.nih.gov/ij/download.html.
Note: The procedure described below has been tested under Windows10 version 1903 and macOS Mojave 10.14.5.
Download ImageJ macros lesion.ijm and lesion_loop.ijm and save them in the same directory.
Open a photo of infected leaves in ImageJ. File > Open > Select your photo or drag-and-drop your image file on to the ImageJ main menu bar.
Open the ROI Manager. Analyze > Tools > ROI Manager.
-
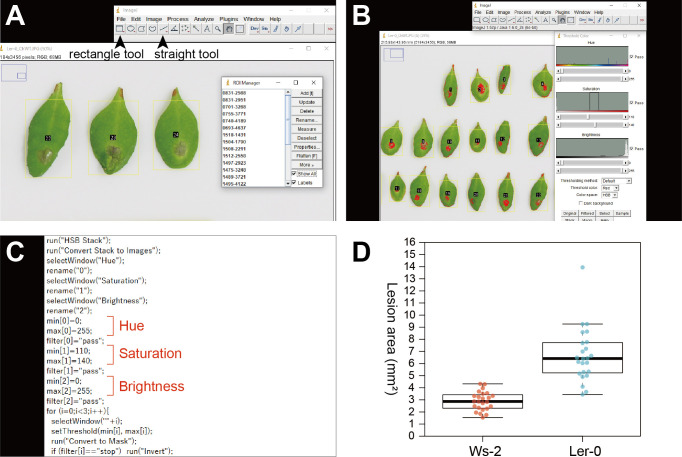
Set each leaf as a region of interest (ROI) on the photo using the rectangle tool and add this ROI by pressing “Add” in the ROI Manager (Figure 3A).
Note: To add each ROI to the ROI Manager, you can use the short cut key. (In default settings, it is [t].)
-
Save ROIs as a .zip file in your preferred directory. In the ROI Manager: More >Save > Select the destination directory.
Note: You can load the ROIs by drag-and-drop of your .zip file on to the ImageJ main menu bar.
Open the Threshold Color menu and set your color space as HSB. Image > Adjust > Color Threshold > Select the color space as HSB.
-
Find the thresholds to define lesions in the photo by changing HSB thresholds (Figure 3B). After confirming the appropriate thresholds, click “Original” and close the Threshold Color menu.
Note: In this step, you can define your thresholds by referring to images of control genotypes that are known to show resistance and susceptible phenotypes. The settings used in Tsushima et al. (2019) are as follows: hue, 0-255; saturation, 110-140; and brightness, 0-255. We normally adjust only the saturation values from the default settings to define lesion areas. After customizing the settings that work for your images, make sure to use the same settings when you repeat analyses.
Open lesion.ijm in a text editor, edit the thresholds according to the settings identified in Step 8 and save. In lesion.ijm, min[0] and max[0], min[1] and max[1], and min[2] and max[2] indicate the minimum and maximum thresholds for hue, saturation, and brightness, respectively (Figure 3C).
Install lesion.ijm and lesion_loop.ijm in your ImageJ. Plugins > Macros > Install > Select lesion.ijm or lesion_loop.ijm
-
Measure 10 mm on the scale in your photo by using the straight tool. Then, set the scale in the dialog box. Analyze > Set Scale > Enter a known distance (10) and the unit of length (mm).
Note: If you take your photos with the same magnification, you can tick “Global” in the dialog box and apply this scale to all subsequent images analyzed.
Open the “Set Measurements” dialog box and tick “Area”, “Mean gray value” and “Limit to threshold”. Analyze > Set Measurements > tick in the dialog box.
-
Run the ImageJ macro. Plugins > Macros > Run > Select lesion_loop.ijm.
Note: You can assign a short cut key for running the macro. Plugins > Shortcuts > Add Shortcut.
Save results as a comma-delimited (.csv) file. In the Results: More > Save > Select the directory where the results should be saved.
Repeat to open the next photo, set ROIs, run lesion_loop.ijm and save the data until you have processed all images.
-
Analyze the detected lesion areas, for example, using R or Excel. The following describes an example of how to visualize the obtained data in a beeswarm boxplot using R.
Note: We provide sample files in sample_files.zip to test all data analysis steps. This includes images of C. higginsianum-infected A. thaliana leaves (Ler-0_ChWT.JPG and Ws-2_ChWT.JPG), ROI files (Ler-0_ChWT.zip and Ws-2_ChWT.zip), raw data of detected lesion areas obtained from ImageJ (Ler-0_ChWT.csv and Ws-2_ChWT.csv), lesion area data reformatted for use as input for R analysis (Ws_Ler.csv), R code to generate the beeswarm plots in Figure 3D (beeswarm.Rmd), and the expected output of running the R code (Lesion_area.pdf).
-
Prepare a .csv file with the lesion area data.
Note: Please format the file as in Ws_Ler.csv
-
Open RStudio and install “beeswarm” and “ggsci” packages by typing install.packages ("beeswarm", dependencies = TRUE) and install.packages ("ggsci", dependencies = TRUE).
Note: Once you install these two packages, you do not need to install them from next time.
Set the directory containing the .csv file as your working directory by typing setwd ("PATH_TO_DIRECTORY") in the console.
In RStudio, open beeswarm.Rmd included in sample_files.zip. and change the .csv file name in Line 21 if necessary. Then, click “Run Current Chunk”. This will create the “Lesion_area.pdf” file in your working directory. Figure 3D shows the expected result using the sample files provided in this article.
Figure 3. Data analysis using color thresholds in ImageJ.
. A. Setting regions of interest (ROIs) on a photo. Yellow rectangles indicate ROIs that will be measured with color thresholds. Arrow heads indicate the rectangle tool and the straight tool. B. The Threshold Color menu of ImageJ. Red-colored parts in ROIs will be detected as lesions. C. Lesion.ijm opened in a text editor indicating the lines specifying the minimum and maximum thresholds of hue, saturation, and brightness, respectively. D. An expected result using the sample files provided in this article.
Acknowledgments
This protocol was derived from our published work ( Tsushima et al., 2019 ). This work was supported in part by JSPS Grant-in-Aid for JSPS Research Fellow to A.T. (17J02983) and KAKENHI (17H06172 to K.S. and 19K15846 to P.G.).
Competing interests
The authors declare no competing interests.
Citation
Readers should cite both the Bio-protocol article and the original research article where this protocol was used.
Supplementary Data.
References
- 1. Birker D., Heidrich K., Takahara H., Narusaka M., Deslandes L., Narusaka Y., Reymond M., Parker J. E. and O’Connell R.(2009). A locus conferring resistance to Colletotrichum higginsianum is shared by four geographically distinct Arabidopsis accessions . Plant J 60(4): 602-613. [DOI] [PubMed] [Google Scholar]
- 2. Cannon P. F., Damm U., Johnston P. R. and Weir B. S.(2012). Colletotrichum- current status and future directions . Stud Mycol 73: 181-213. [DOI] [PMC free article] [PubMed] [Google Scholar]
- 3. Dagdas Y. F., Beihaj K., Maqbool A., Chaparro-Garcia A., Pandey P., Petre B., Tabassum N., Cruz-Mireles N., Hughes R. K., Sklenar J., Win J., Menke F., Findlay K., Banfield M. J., Kamoun S. and Bozkurt T. O.(2016). An effector of the irish potato famine pathogen antagonizes a host autophagy cargo receptor. ELife 5: e10856. [DOI] [PMC free article] [PubMed] [Google Scholar]
- 4. Gan P., Tsushima A., Hiroyama R., Narusaka M., Takano Y., Narusaka Y., Kawaradani M., Damm U. and Shirasu K.(2019). Colletotrichum shisoi sp. nov., an anthracnose pathogen of Perilla frutescens in Japan: molecular phylogenetic, morphological and genomic evidence . Sci Rep 9(1): 13349. [DOI] [PMC free article] [PubMed] [Google Scholar]
- 5. Hiruma K. and Saijo Y.(2016). Plant inoculation with the fungal leaf pathogen Colletotrichum higginsianum . Methods Mol Biol 1398: 313-318. [DOI] [PubMed] [Google Scholar]
- 6. Kleemann J., Rincon-Rivera L. J., Takahara H., Neumann U., van Themaat E. V. L., van der Does H. C., van Hacquard E. V. L., van Themaat S., van Themaat E. V. L.(2012). Sequential delivery of host-induced virulence effectors by appressoria and intracellular hyphae of the phytopathogen Colletotrichum higginsianum . PLoS Pathog 8(4): e1002643. [DOI] [PMC free article] [PubMed] [Google Scholar]
- 7. Kumakura N., Ueno A. and Shirasu K.(2019). Establishment of a selection marker recycling system for sequential transformation of the plant-pathogenic fungus Colletotrichum orbiculare . Mol Plant Pathol 20(3): 447-459. [DOI] [PMC free article] [PubMed] [Google Scholar]
- 8. Narusaka M., Shiraishi T., Iwabuchi M. and Narusaka Y.(2010). Monitoring fungal viability and development in plants infected with Colletotrichum higginsianum by quantitative reverse transcription-polymerase chain reaction . J General Plant Pathol 76(1): 1-6. [Google Scholar]
- 9. Narusaka M., Shirasu K., Noutoshi Y., Kubo Y., Shiraishi T., Iwabuchi M. and Narusaka Y.(2009). RRS1 and RPS4 provide a dual Resistance-gene system against fungal and bacterial pathogens . Plant J 60(2): 218-226. [DOI] [PubMed] [Google Scholar]
- 10. Narusaka Y., Narusaka M., Park P., Kubo Y., Hirayama T., Seki M., Shiraishi T., Ishida J., Nakashima M., Enju A., Sakurai T., Satou M., Kobayashi M. and Shinozaki K.(2004). RCH1, a locus in Arabidopsis that confers resistance to the hemibiotrophic fungal pathogen Colletotrichum higginsianum . Mol Plant-Microbe Interact 17(7): 749-762. [DOI] [PubMed] [Google Scholar]
- 11. R. O’Connell, Herbert C., Sreenivasaprasad S., Khatib M., Esquerré-Tugayé M.-T. and Dumas B.(2004). A novel Arabidopsis-Colletotrichum pathosystem for the molecular dissection of plant-fungal interactions . Mol Plant-Microbe Interact 17(3): 272-282. [DOI] [PubMed] [Google Scholar]
- 12. Plaumann P.-L., Schmidpeter J., Dahl M., Taher L. and Koch C.(2018). A dispensable chromosome is required for virulence in the hemibiotrophic plant pathogen Colletotrichum higginsianum . Front Microbiol 9: 1005. [DOI] [PMC free article] [PubMed] [Google Scholar]
- 13. Schneider C. A., Rasband W. S. and Eliceiri K. W.(2012). NIH Image to ImageJ: 25 years of image analysis. Nat Methods 9(7): 671-675. [DOI] [PMC free article] [PubMed] [Google Scholar]
- 14. Takahara H.,Hacquard S.,Kombrink A.,Hughes H. B.,Halder V.,Robin G. P.,Hiruma K.,Neumann U.,Shinya T.,Kombrink E.,Shibuya N. and Thomma B. P. H. J.,O’Connell R. J. (2016). Colletotrichum higginsianum extracellular LysM proteins play dual roles in appressorial function and suppression of chitin-triggered plant immunity . New Phytol 2114: 1323–1337. [DOI] [PubMed] [Google Scholar]
- 15. Tsushima A., Gan P., Kumakura N., Narusaka M., Takano Y., Narusaka Y. and Shirasu K.(2019). Genomic plasticity mediated by transposable elements in the plant pathogenic fungus Colletotrichum higginsianum . Genome Biol Evol 11(5): 1487-1500. [DOI] [PMC free article] [PubMed] [Google Scholar]
- 16. Zampounis A.,Pigné S.,Dallery J.,Wittenberg A. H. J.,Zhou S.,Schwartz D. C.,Thon M. R. and O’Connell R. J.(2016). Genome sequence and annotation of Colletotrichum higginsianum, a causal agent of crucifer anthracnose disease . Genome Announc 4(4): e00821-16. [DOI] [PMC free article] [PubMed] [Google Scholar]
Associated Data
This section collects any data citations, data availability statements, or supplementary materials included in this article.


