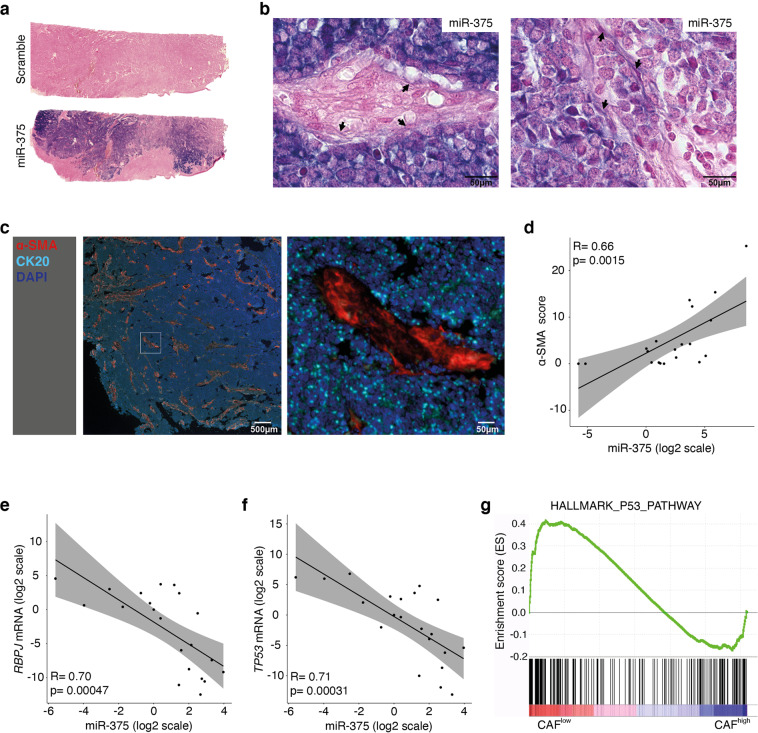
Fig. 7. miR-375 expression correlates with fibroblast polarization in situ.
a FFPE MCC tumor tissues were hybridized with a scrambled control probe (upper) or a miR-375-specific probe (lower). Whole slide scans of one representative MCC tissue are shown. b Two representative tumor areas are shown at high resolution to demonstrate the presence of miR-375 in fibroblasts (indicated by the arrows); the scale bars represent 10 µm. c MCC tissues stained for α-SMA and other fibroblast and MCC markers (same as Fig. 1a), and one representative MCC tissue is shown for α-SMA expression pattern. Spearman rank correlations of α-SMA staining scores (d), RBPJ (e) and TP53 (f) mRNA expression levels with the miR-375 expression levels. Statistical analyses were performed in R using the ggpubr package. g GSEA was performed using scRNAseq data from two fibroblast clusters, and p53-related signaling was revealed.

