Abstract
Objective
To test the hypothesis that dimethyl fumarate (DMF, Tecfidera) elicits different biological changes from DMF combined with monoethyl fumarate (MEF) (Fumaderm, a psoriasis therapy), we investigated DMF and MEF in rodents and cynomolgus monkeys. Possible translatability of findings was explored with lymphocyte counts from a retrospective cohort of patients with MS.
Methods
In rodents, we evaluated pharmacokinetic and pharmacodynamic effects induced by DMF and MEF monotherapies or in combination (DMF/MEF). Clinical implications were investigated in a retrospective, observational analysis of patients with MS treated with DMF/MEF (n = 36).
Results
In rodents and cynomolgus monkeys, monomethyl fumarate (MMF, the primary metabolite of DMF) exhibited higher brain penetration, whereas MEF was preferentially partitioned into the kidney. In mice, transcriptional profiling for DMF and MEF alone identified both common and distinct pharmacodynamic responses, with almost no overlap between DMF- and MEF-induced differentially expressed gene profiles in immune tissues. The nuclear factor (erythroid-derived 2)-like 2 (Nrf2)-mediated oxidative stress response pathway was exclusively regulated by DMF, whereas apoptosis pathways were activated by MEF. DMF/MEF treatment demonstrated that DMF and MEF functionally interact to modify DMF- and MEF-specific responses in unpredictable ways. In patients with MS, DMF/MEF treatment led to early and pronounced suppression of lymphocytes, predominantly CD8+ T cells. In a multivariate regression analysis, the absolute lymphocyte count (ALC) was associated with age at therapy start, baseline ALC, and DMF/MEF dosage but not with previous immunosuppressive medication and sex. Furthermore, the ALC increased in a small cohort of patients with MS (n = 6/7) after switching from DMF/MEF to DMF monotherapy.
Conclusions
Fumaric acid esters exhibit different biodistribution and may elicit different biological responses; furthermore, pharmacodynamic effects of combinations differ unpredictably from monotherapy. The strong potential to induce lymphopenia in patients with MS may be a result of activation of apoptosis pathways by MEF compared with DMF.
MS is a chronic, inflammatory, demyelinating, autoimmune disease of the CNS.1 During different stages of MS, oxidative stress precipitated by mitochondrial damage also may contribute to oligodendrocyte and neuronal injury.2 Fumaric acid esters (FAEs) exhibit pleiotropic immunomodulatory effects and antioxidative properties. The FAE dimethyl fumarate (DMF), which has monomethyl fumarate (MMF) as its primary metabolite, is an oral treatment approved for use in patients with relapsing-remitting MS (RRMS),3,4 clinically isolated syndrome, and active secondary progressive MS.3 The efficacy of DMF and a combination of different salts of monoethyl fumarate (MEF) in patients with RRMS was investigated in an early exploratory study,5 and it is marketed in Germany as an oral therapeutic to treat psoriasis (DMF/MEF, Fumaderm).
It is unclear whether different FAEs are functionally equivalent and whether a combination treatment could alter pharmacologic properties and clinical parameters although in vitro evidence shows that different FAEs may stimulate distinct responses.6–8 Both DMF and MEF treatment are associated with lymphopenia in some patients; however, the underlying mechanisms and relative contributions of each FAE are unknown.9,10
We hypothesized that the standard clinical regimen of DMF and DMF/MEF might have different pharmacokinetic distributions and provoke different pharmacodynamic responses. We administered FAEs (DMF, MEF, and DMF/MEF) individually or at doses reflecting the Fumaderm formulation and evaluated their distribution in various tissues and changes in transcriptional profiles. Finally, we evaluated lymphopenia in patients with MS treated with DMF/MEF.
Methods
Animals
All procedures involving animals were performed in accordance with standards established in the Guide for the Care and Use of Laboratory Animals (US NIH). All rodent animal protocols were approved by the Biogen Institutional Animal Care and Use Committee (IACUC). Animals used included female C57BL/6 mice aged 8–10 weeks (Jackson Laboratories, Bar Harbor, ME), male Sprague Dawley rats aged 12–14 weeks (Harlan Laboratories, Indianapolis, IN or Charles River Laboratories, Wilmington, MA), or female cynomolgus monkeys weighing 2–4 kg (dosing excretion studies were conducted at Charles River Laboratories [Reno, NV] in accordance with protocols approved by their IACUC).
Compound Dosing
For transcriptional profiling and biodistribution studies, C57BL/6 mice or Sprague Dawley rats were dosed with DMF, a mixture of MEF salts (Ca2+, Mg2+, and Zn2+ in the ratio 91.5%:5.2%:3.2%), or a combination of DMF and MEF salts to mimic the ratio of fumarates in Fumaderm. DMF, MEF, and DMF/MEF were formulated as fine suspensions in 0.8% hydroxypropyl methylcellulose (vehicle) and stirred continuously throughout the studies. DMF was dosed at 100 mg/kg (the efficacious dose in a mouse experimental autoimmune encephalomyelitis model); MEF was dosed at 79.2 mg/kg (total MEF salts), representing the proportional MEF dose in Fumaderm; and DMF/MEF, which is reflective of the ratio of DMF:MEF salts in Fumaderm used in the clinic, comprised DMF 100 mg/kg and MEF 79.2 mg/kg. Mice received either a single dose (10 mL/kg for pharmacokinetics) or 10 daily doses (10 mL/kg) of FAEs or vehicle-only control (0.8% hydroxypropyl methylcellulose) via oral gavage. For urine excretion studies, rats were dosed (30 mg/kg) with a mixture of DMF (55.5%), Ca2+ MEF (39.8%), Mg2+ MEF (2.4%), Zn2+ MEF (1.49%), and fumaric acid (0.98%), reflective of Fumaderm dosing. Cynomolgus monkeys were dosed (50 mg/kg) with either DMF or a mixture of MEF salts in the same proportions used in rats and mice.
In Vivo Gene Expression Profiling
Whole blood and, after perfusion, tissues were collected from naive C57Bl/6 mice dosed with vehicle, DMF, a mixture of MEF salts, or DMF/MEF at 12 hours after the final oral dose (10-day series), and snap frozen. RNA was prepared from tissues and whole blood per standard practice. RNA integrity was assessed using the HT RNA reagent kit (part number 760410, Caliper Life Sciences, Hopkinton, MA) and a LabChip GX (PerkinElmer, Waltham, MA). RNA samples with an RNA Quality Score (RQS) >8.0 were considered high quality for microarray profiling. Sample labeling, hybridization, and scanning were performed as described11 using an Affymetrix chip HT-MG-430 PM (Affymetrix, Santa Clara, CA). Affymetrix scans were subject to quality control (QC) measures.12 All sample scans that passed QC were included in the analysis; these 204 CEL files (GEO accession number GSE63343) were either pooled all together or segregated based on tissue and subjected to content-based GC-Robust Multi-Array Average (GCRMA) normalization (version 2.20.0).13,14
To identify genes that change uniquely in response to DMF or MEF administration in each individual tissue, a linear modeling approach was used to fit gene expression levels (log2 transformed) according to the defined groups of samples and Bayesian posterior error analysis as implemented by Smyth (Bioconductor library limma, version 3.4.5).15 Genes were considered significantly different in DMF-vs-vehicle and MEF-vs-vehicle if they met the following criteria: (1) average normalized signal intensity >4; (2) logarithm (base 10) of odds (“lods”) score >0; and (3) fold change >1.5. All calculations and analyses were carried out using R (version 2.11.1) and Bioconductor.16
Alternately, samples across all tissues and blood were pooled and normalized together to avoid characterizing tissue-to-tissue variability in the limited subset of tissues sampled and to fully capture all differences in DMF/MEF responses; this approach generalized the analysis and allowed us to find probe sets that were specifically changing because of DMF or MEF, as well as probe sets that exhibited a DMF:MEF interaction effect. The following linear mixed model was applied to the normalized data set:
Gene expression ∼ DMF + MEF + DMF:MEF + random (tissue)
Interaction probe sets were defined as those with a Bonferroni-adjusted p value <0.05 for the interaction term in this model. A simpler model (without the interaction term) was fit to probe sets that exhibited no interaction effect. Similarly, probe sets were considered significant and specific to DMF if the Bonferroni-corrected p value was <0.05 for the DMF term and >0.05 for the MEF term (and no interaction effect was found). MEF-specific probe sets were identified by requiring the Bonferroni-corrected p value to be > 0.05 for DMF and <0.05 for MEF.
An in vivo MEF-DMF interaction was evaluated by analyzing the specific differentially expressed genes (DEGs) modulated when these 2 compounds were coadministered (DMF 100 mg/kg and MEF salts 79.2 mg/kg). The absolute value of the difference between (DMF − vehicle) and (combination − vehicle) was calculated for each of the identified interaction probe sets and presented as the log2 absolute difference for each probe set. To identify the most highly enriched molecular pathways, the sets of DMF-specific, MEF-specific, and DMF/MEF interaction probe sets were analyzed using Ingenuity Pathway Analysis (IPA) software (Qiagen, Germantown, MD). The top 10 enriched pathways for each were compared with each other for p value significance.
Bioanalytical Studies
For biodistribution studies, immediately following blood collection, a stabilizer (sodium fluoride solution, 250 mg/mL NaF in water) was added to each blood sample (10 mg/mL final) in a chilled lithium heparin blood collection tube (to inhibit metabolism of MMF or MEF), and plasma was separated from whole blood by centrifugation. Plasma was then snap frozen on dry ice and maintained at −80°C until analyzed. MEF and MMF were measured in all experiments. MMF represents the main metabolite of DMF, which itself cannot be detected in systemic circulation after oral administration because of rapid presystemic conversion in vivo. Sample extracts were evaluated by liquid chromatography tandem mass spectrometry to determine MMF and MEF levels using absolute quantitation based on standard curves spiked in the appropriate biomatrix. Results are expressed as absolute concentration (ng/g of tissue or ng/mL of plasma) and relative concentration expressed as a percentage of plasma concentration.
To measure the renal excretion of MMF and MEF, Sprague Dawley rats were administered a single oral dose of 30 mg/kg DMF plus MEF salts in the Fumaderm ratio (DMF [55.5%], Ca2+ MEF [39.8%], Mg2+ MEF [2.4%], Zn2+ MEF [1.49%], and fumaric acid [0.98%]). In a separate study, cynomolgus monkeys received a single oral dose of 50 mg/kg DMF or MEF salts. In both studies, urine was collected over a 24-hour period and analyzed for MMF and MEF levels.
Patients With MS
Patients were identified by retrospective analysis of medical records from a single university hospital. Clinical characteristics (table e-1, links.lww.com/NXI/A394) of the majority of patients (RRMS or relapsing progressive MS, n = 18; progressive MS, n = 17; neuromyelitis optica, n = 1) treated with DMF/MEF (Fumaderm, mean [SD] 285 [123] mg) in this retrospective, observational, cross-sectional study were described previously.17 Baseline values of white blood cell count (WBC) and absolute lymphocyte count (ALC) of the DMF/MEF cohort were obtained 1 week (median and interquartile range [IQR]) before initiation of DMF/MEF and every 3 months thereafter. The 7 patients who switched from DMF/MEF to DMF switched within a mean (SD) of 0.9 (2.3) weeks (6/7 no treatment-free interval, 1 patient 6-weeks interval). In these patients, a lymphopenia index (LI) normalized for dosage of the DMF component was calculated using the following formula: (lymphocyte count during medication – baseline lymphocyte count)/mg of DMF. Statistical analyses including a multivariate regression analysis, chi-square analysis, and Spearman rho correlation were performed with SPSS 20 (IBM, Armonk, NY).
Standard Protocol Approvals, Registrations, and Patient Consents
The retrospective observation was approved by the local ethics committee (Ruhr University Bochum; numbers 5408-15 and 4797-13) and conducted in accordance with the Declaration of Helsinki, the International Conference on Harmonisation Guideline for Good Clinical Practice, and all applicable laws and regulations.
Data Availability
Data supporting this article can be requested via the corresponding authors.
Results
Biodistribution of DMF Metabolite (MMF) and MEF in Mice and Rats
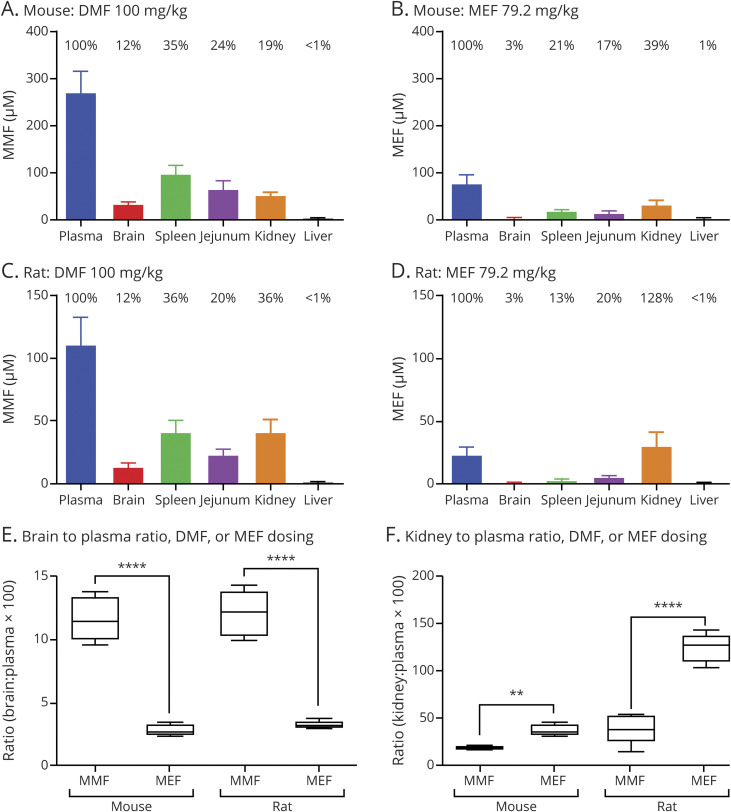
Thirty minutes after DMF administration by oral gavage, MMF was broadly distributed throughout the bodies of both rats and mice. MMF (dosed as DMF) achieved higher brain penetration after oral administration compared with MEF, by both absolute and relative concentration (mouse, figure 1, A vs B; rat, figure 1, C vs D). In contrast, MEF preferentially partitioned to the kidney, leading to higher absolute and relative concentrations. These differences led to an increased brain to plasma ratio for DMF (p < 0.001) (figure 1E) and conversely a higher kidney to plasma ratio for MEF compared with each other (p < 0.01) (figure 1F). Differences in biodistribution remained similar after a 10-day dosing period (data not shown).
Figure 1. Tissue Distribution of MEF and DMF Metabolite (MMF) in Mice and Rats.
(A–D) Mice and rats were administered a single dose of DMF (100 mg/kg) (A and C) or MEF (79 mg/kg) (B and D). Plasma and tissue levels (brain, spleen, jejunum, kidney, and liver) of MEF and MMF were determined 30 minutes after dosing. Percentages above each bar represent the percent tissue penetration relative to plasma concentration. (E) Plasma to brain ratios for DMF and MEF treatment in mice and rats highlight significantly higher DMF (MMF) brain exposure (p < 0.001 for both species). (F) Plasma to kidney ratios for DMF and MEF treatment in mice and rats indicate significantly lower kidney exposure for DMF treatment compared with MEF (**p < 0.01 and ****p < 0.001 in mice and rats, respectively). DMF = dimethyl fumarate; MEF = monoethyl fumarate; MMF = monomethyl fumarate.
Renal Excretion of MMF and MEF Is Significantly Different in Rats and Cynomolgus Monkeys
Consistent with pharmacokinetic and tissue distribution data, mean excretion of intact MEF was significantly higher relative to MMF in rats (9-fold; p < 0.05) and in cynomolgus monkeys (26-fold; p < 0.001) (data not shown). Thus, the kidney experienced significantly greater exposure to MEF compared with MMF (after DMF dosing), which might be expected as the kidney to plasma ratio was higher for MEF.
Interaction Between DMF and MEF Based on Gene Expression Changes in Mice
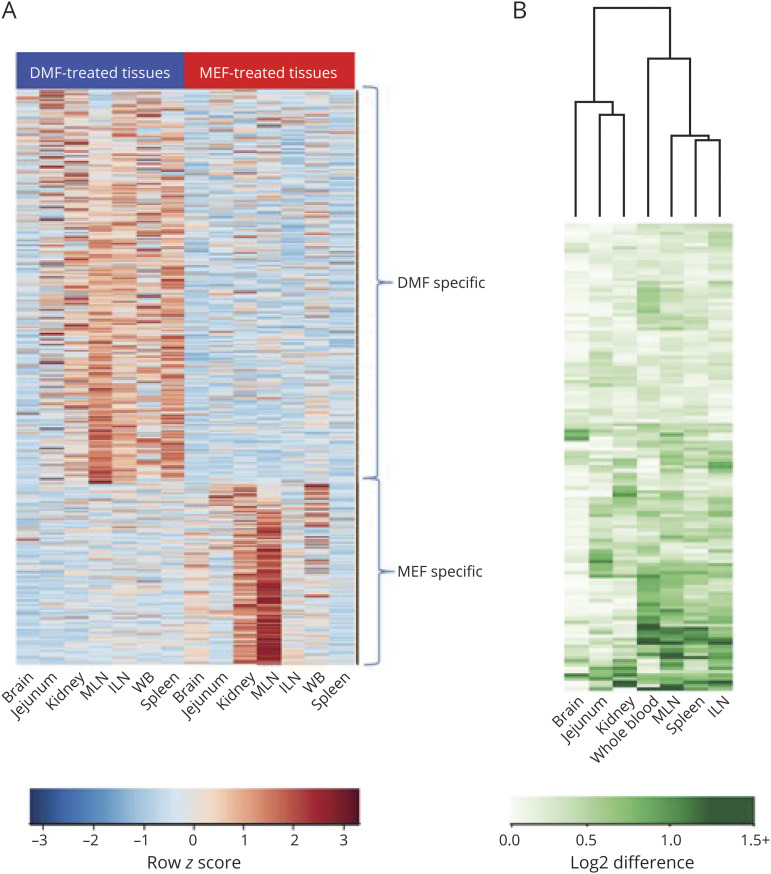
As determined by induced gene expression changes relative to vehicle, DMF, MEF, and their combination exhibited varied pharmacodynamic activity based on tissue type, with many gene expression changes unique to either DMF or MEF exposure (figure e-1, links.lww.com/NXI/A394). All samples were normalized and analyzed together to identify genes that exhibit a change in expression uniquely due to DMF or MEF and interaction effects between DMF and MEF. In the combined tissue data set, 487 genes were found to change specifically as a result of DMF treatment. These genes were enriched for pathways for the nuclear factor (erythroid-derived 2)-like 2 (Nrf2)-mediated oxidative stress response, glutathione (GSH)-mediated detoxification, and other environmental sensing pathways (e.g., aryl hydrocarbon receptor signaling) (table e-2, links.lww.com/NXI/A394). In total, 224 genes were identified with expression changes specifically due to MEF; they were enriched for the death receptor signaling pathway, apoptosis signaling, and autophagy-related pathway. The absolute mean value of each tissue for the DMF- and MEF-specific groups was subjected to unsupervised hierarchical clustering (figure 2A). DMF specificity was more pronounced in the mesenteric lymph node (MLN), inguinal lymph node (ILN), spleen, and whole blood, whereas MEF specificity was found predominantly in the kidney and MLN. After combination therapy, 132 DEGs exhibited a significant interaction effect between DMF and MEF. The most pronounced interactions between fumarates were found in tissues related to immune function (whole blood, MLN, ILN, and spleen) (figure 2B and table e-3, links.lww.com/NXI/A394), which is of interest for the relative amount of lymphocyte suppression by each fumarate compound. The unfolded protein response (a stress response) and neurodegenerative signaling (e.g., Huntington disease, RNA polymerase III assembly, and protein degradation) pathways were uniquely enriched for DMF and MEF interaction. These biological trends were constant regardless of whether the tissues were pooled or kept separate for the analysis.
Figure 2. (A) DMF and MEF Specificity Across Tissues and Blood and (B) Magnitude of Interaction Effect in Mice.
(A) After pooling all tissues, the absolute value in each tissue of the group averages DMF—vehicle and MEF—vehicle were subjected to unsupervised hierarchical clustering (n = 7 biological sample sets each) for the 487 DMF-specific and 224 MEF-specific probe sets. The relative magnitude of the degree of specificity in each tissue is shown. DMF specificity is most pronounced in MLN, ILN, spleen, and whole blood, whereas MEF specificity is most evident in the kidney and MLN. (B) For each of the 132 interaction probe sets, the absolute value of the difference of DMF — vehicle and combination — MEF was subjected to unsupervised hierarchical clustering. The interaction effect in each tissue is shown. An interaction between DMF and MEF is most pronounced in the immunologic tissues: whole blood, MLN, ILN, and spleen. DMF = dimethyl fumarate; ILN = inguinal lymph node; MEF = monoethyl fumarate; MLN = mesenteric lymph node; WBC = white blood cell.
DMF/MEF Combination Induces Fast and Moderate-to-Severe Lymphopenia in Patients With MS
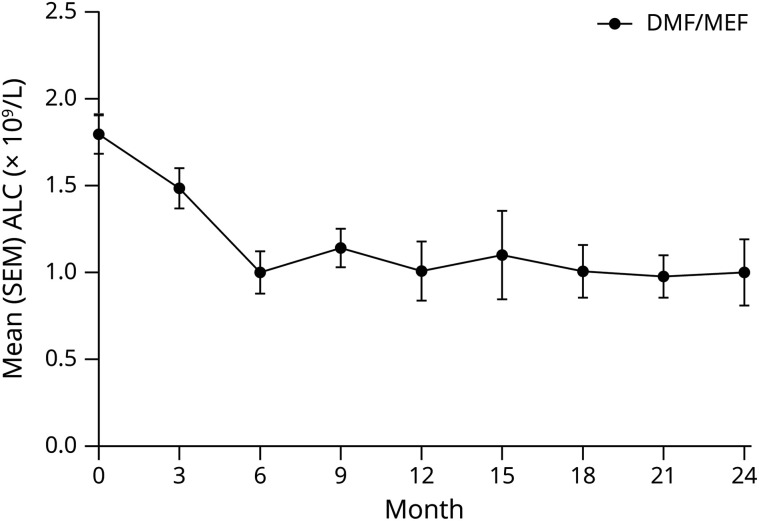
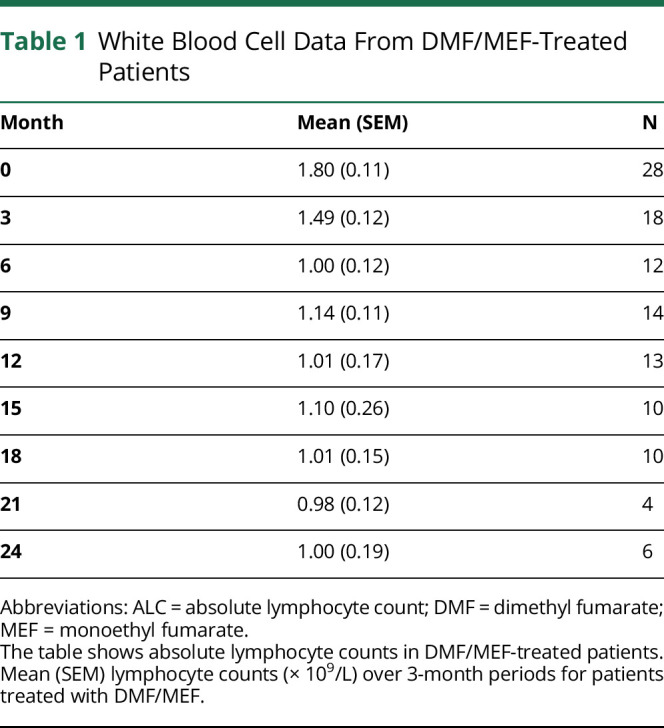
To assess biological consequences in humans, effects on lymphocyte counts in patients with MS treated with DMF/MEF were retrospectively analyzed. DMF/MEF treatment led to a fast and profound reduction (44%) of ALC within the first year of treatment (figure 3 and table 1). ALCs remained suppressed beyond 12 months until the end of the observation (24 months). A multivariate linear regression analysis revealed that DMF/MEF dose (coefficient −1.05, 95% CI −2.09 to −0.01, p = 0.047), age at treatment start (coefficient −13.32, 95% CI −23.61 to −3.04, p = 0.01), time point of sampling (coefficient −73.97, 95% CI −133.68 to −14.26, p = 0.02), and baseline ALC (coefficient 0.51, 95% CI 0.33 to 0.70, p < 0.001) influenced ALC, whereas previous use of immunosuppressive treatments and sex did not.
Figure 3. White Blood Cell Data From DMF/MEF-Treated Patients.
The figure shows absolute lymphocyte counts in DMF/MEF-treated patients. Mean (SEM) lymphocyte counts (× 109/L) over 3-month periods for patients treated with DMF/MEF. ALC = absolute lymphocyte count; DMF = dimethyl fumarate; MEF = monoethyl fumarate.
Table 1.
White Blood Cell Data From DMF/MEF-Treated Patients
Grade 2 or 3 lymphopenia was not present at baseline but occurred in 27.8% (grade 2) and 5.6% (grade 3) of patients at the second year of DMF/MEF treatment (table 2).
Table 2.
Distribution of Lymphopenia Grades 1–4 in DMF/MEF-Treated Patients
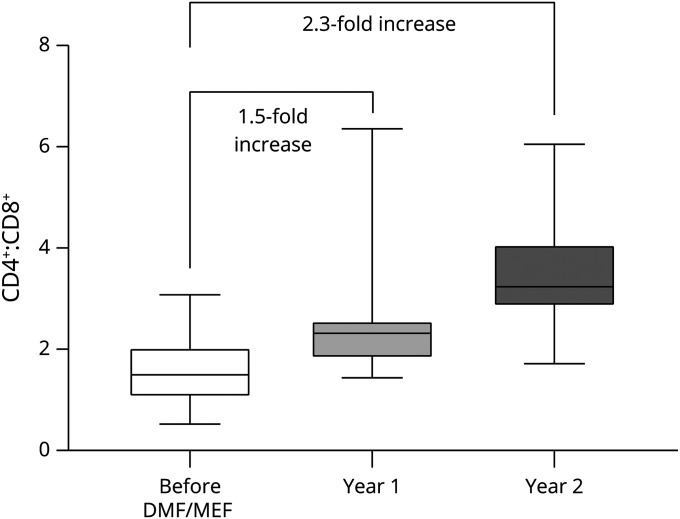
In 17 of 21 patients with available lymphocyte subpopulation data, the CD4+:CD8+ ratio correlated with the ALC (Spearman rho correlation −0.52; p = 0.02; n = 21) and increased 1.5-fold in the first year and 2.3-fold in the second year (figure 4 and table 3). The increase in the CD4+:CD8+ ratio was driven by a 3.5-fold higher suppression of CD8+ compared with CD4+ T cells (maximum reduction of CD4+ T cells 19% vs CD8+ T cells 66%). Finally, we analyzed lymphocyte data longitudinally from patients who switched from DMF/MEF to DMF. In general, the LI normalized for dosage of the DMF component increased in 6 of 7 patients, with an increase of median (IQR) LI from −4.33 (4.83) to −1.04 (4.33) (Mann-Whitney U test, p = 0.04) after switching from DMF/MEF to DMF. In addition, when analyzing the ALC values without normalization to DMF dosage, an ALC increase in 4 of 7 patients was observed despite an increase in DMF dosage of 23%. One patient demonstrated stable ALCs, with a 100% increase in DMF dose. The remaining 2 patients experienced a further decrease in ALC with a 78% increase in DMF dose after withdrawal of MEF.
Figure 4. CD4+:CD8+ Ratio Correlated With Lymphocyte Count.
CD4+ and CD8+ T cells in patients before DMF/MEF and 1 and 2 years after DMF/MEF treatment. The box and whiskers plot shows median, IQR, and minimum/maximum for the CD4+:CD8+ ratio. DMF = dimethyl fumarate; IQR = interquartile range; MEF = monoethyl fumarate.
Table 3.
CD4+:CD8+ Ratio Correlated With Lymphocyte Count
Discussion
Fumaderm provided initial evidence of the potential therapeutic effects of fumarates in patients with MS.17,18 The specific in vivo pharmacokinetic, pharmacodynamic, and immunologic effects of DMF and MEF salts in Fumaderm have not been investigated.7 In vitro studies have demonstrated differential effects of DMF and MEF, which may provide insight into the in vivo differences observed. Specifically, differential effects of DMF and MEF were observed for a targeted set of biological properties, including Kelch-like ECH-associated protein 1 (Keap1) modification, Nrf2 activation, and GSH consumption and biosynthesis.7 DMF and MMF could potentially inhibit the activation of lymphoid and myeloid cells by downregulation of aerobic glycolysis via the succination and inactivation of glyceraldehyde 3-phosphate dehydrogenase (GAPDH).19 In addition, DMF and MMF activate endogenous detoxifying and antioxidant pathway genes by binding to Keap1, activating Nrf2 transcriptional activity, modulating GSH levels, and activating GSH biosynthesis.7,20
A primary goal of these studies was to determine whether coadministration of DMF and MEF would provide an additive response or trigger unique biological responses in vivo. An unbiased transcriptional approach was used to characterize the differences between DMF, MEF, and DMF/MEF under steady-state exposure in vivo. The individual contributions of DMF and MEF were explored using doses that reflected the composition of Fumaderm. Oral administration of DMF and MEF showed significant differences in their biodistribution and excretion profiles in mice, rats, and monkeys. MEF exhibited 10- to 20-fold higher compound exposure in the kidney relative to MMF. Compared with systemic exposure, DMF levels were 4-fold higher than MEF levels in the brain. This could indicate that DMF might be more potent in directly targeting oxidative stress pathways in the CNS.
In mice, DMF showed preferential modulation of transcripts in tissues related to immune function (spleen, MLN, ILN, and whole blood), whereas MEF showed a preference for transcript modulation in the kidney and MLN. This difference with MEF might be explained by its remarkably reduced concentration and area under the curve compared with DMF, which are likely the result of the combination of a lower relative dose and increased renal excretion. However, these effects might also be associated with individual transcriptional effects of the 2 compounds because the number of DEGs modulated by DMF is considerably higher in organs with exposure similar to MEF, such as the kidney. It remains uncertain whether the DMF-induced transcriptional changes are mediated by MMF signaling through HCAR221 (expressed on myeloid cells), through Nrf2 (ubiquitously expressed in the body), or through an additional pathway yet to be described. DMF likely has multiple therapeutic targets as it functions through both Nrf2-dependent and -independent pathways, indirect and/or direct inhibition of NF-κB, and modulation of oxidative stress-sensitive transcription factors and STATs through DMF-induced glutathione depletion and reactive oxygen species induction.6,18,22 These analyses did not identify differential effects of DMF/MEF on Keap1 and GAPDH transcripts. In contrast, previous studies have shown post-transcriptional regulation through direct modification of activity of proteins such as Keap1 and GAPDH.19,23 Specifically, DMF modification of lipid metabolic pathways and impairment of aerobic glycolysis and GAPDH activity by direct modification of the GAPDH protein itself are both related to DMF-induced immunologic changes.19,23 There are legitimate questions about whether the GAPDH preclinical data at high doses are relevant for human subjects that have much lower Cmax levels of MMF relative to mice, but the potential exists for it to be active in vivo. Pharmacodynamic data for DMF and MEF monotherapies and combined DMF/MEF treatment, as well as DEG data assessing the compounds' interactions, indicate that differential gene expression may be more complex than increasing potency or total dosage. It is not known whether the fumarate tissue distribution and gene expression profiles shown in animals in this analysis differ from those in humans.
Our analyses of lymphocyte kinetics in patients with MS support the pharmacodynamic results. In patients who switched from DMF/MEF to DMF monotherapy, ALC increased even after normalization for DMF dosage. A pronounced and early reduction of ALCs during treatment with DMF/MEF was shown over a follow-up of 24 months. Treatment of patients with MS with DMF/MEF led to an increase in the CD4+:CD8+ ratio, with a predominant reduction of CD8+ cells. Similar increases in CD4+:CD8+ ratios were observed in DMF/MEF-treated patients with psoriasis,9 yet this appears to be more pronounced than in patients with MS receiving DMF monotherapy (1.4-fold).24 In a recent study, DMF monotherapy shifted the immunophenotype of circulating lymphocyte subsets, and ALC closely correlated with CD4+ and CD8+ T-cell counts.25 No increased risk of serious infection was observed in patients with low T-cell subset counts.25
Owing to the limited sample size, data analyses were limited, especially for T-cell subpopulations. Despite these limitations, multivariate regression analysis demonstrated that ALC was significantly forecasted by age, baseline ALC, DMF/MEF dose, and time point of sampling. Age and baseline ALC are also known parameters predicting baseline ALC during DMF monotherapy, further supporting our analysis.26 Specifically, previous analyses found that age ≥60 years and a baseline ALC <2 g/L are independent risk factors for the development of a severe lymphopenia during DMF therapy.26 The small subpopulation of patients from our study who switched from DMF/MEF to DMF and exhibited an increase in ALC had a mean (SD) age of 54.1 (14.9) years.27,28 The retrospective design with intervals between testing not being well defined might introduce bias in the results.
In conclusion, our experimental and clinical data provide evidence for different immunologic effector mechanisms of DMF compared with MEF. It is not clear whether these different pathways are associated with lymphopenia induced by FAEs, yet this study provides data on potential mechanisms for the individual therapies. Although several mechanisms leading to lymphopenia have been proposed (e.g., apoptosis, GSH depletion, oxidative stress, and bone marrow affection), exact pathomechanisms remain elusive.6,7,20,29 Prolonged severe and moderate lymphopenia is considered a risk factor for very rare cases of progressive multifocal leukoencephalopathy in patients treated with DMF; therefore, identifying the differential effects of FAEs on lymphocyte counts is relevant for the management of patients with MS.25,29
Acknowledgment
Preclinical species work was supported by Biogen, Inc. (Cambridge, MA). Karyn M. Myers, PhD, of Biogen provided initial editing support based on input from authors. Biogen also provided funding to Excel Scientific Solutions for medical writing support in the development of this article; Karen Spach, PhD, from Excel Scientific Solutions incorporated author comments, and Miranda Dixon from Excel Scientific Solutions copyedited and styled the manuscript per journal requirements. The authors had full editorial control of the article and provided their final approval of all content. The authors thank Raghavendra Hosur, Kristopher W. King, Norm Allaire, Patrick Cullen, Alice Thai, Alex Chou, Theresa A. Hillery, Kejie Li, Liyu Yang, Chaoran Huang, and Norman Kim for their contributions to this study.
Glossary
- ALC
absolute lymphocyte count
- DEG
differentially expressed gene
- DMF
dimethyl fumarate
- FAE
fumaric acid ester
- GAPDH
glyceraldehyde 3-phosphate dehydrogenase
- GCRMA
GC-content-based Robust Multi-Array Average
- GSH
glutathione
- IACUC
Institutional Animal Care and Use Committee
- ILN
inguinal lymph node
- IPA
Ingenuity Pathway Analysis
- IQR
interquartile range
- Keap1
Kelch-like ECH-associated protein 1
- LI
lymphopenia index
- MEF
monoethyl fumarate
- MLN
mesenteric lymph node
- MMF
monomethyl fumarate
- Nrf2
nuclear factor (erythroid-derived 2)-like 2
- QC
quality control
- RQS
RNA Quality Score
- RRMS
relapsing-remitting MS
- WBC
white blood cell count
Appendix. Authors

Contributor Information
Brian T. Wipke, Email: btwipke@gmail.com.
Robert Hoepner, Email: robert.hoepner@insel.ch.
Katrin Strassburger-Krogias, Email: katrin.strassburger@gmx.de.
Ankur M. Thomas, Email: ankur.thomas@biogen.com.
Davide Gianni, Email: davide.gianni@biogen.com.
Suzanne Szak, Email: suzanne.szak@biogen.com.
Melanie S. Brennan, Email: melaniesbrennan@gmail.com.
Maximilian Pistor, Email: maximilian.pistor@insel.ch.
Ralf Gold, Email: ralf.gold@rub.de.
Robert H. Scannevin, Email: rscanner12@gmail.com.
Study Funding
Study supported by Biogen.
Disclosure
This study was sponsored by Biogen. B. T. Wipke, M. S. Brennan, and R. H. Scannevin were employees of and held stock/stock options in Biogen at the time this research was conducted. R. Hoepner received funding and personal compensation for speaker activities from Almirall, Biogen, Celgene, Merck, Novartis, Roche, and Sanofi. A. Thomas, D. Gianni, and S. Szak are employees of and hold stock/stock options in Biogen. K. Strassburger-Krogias received travel grants from Biogen and Merck Serono. M. Pistor reports no disclosures. R. Gold received honoraria/research support from Bayer, Biogen, Merck Serono, Novartis, and Teva and compensation from Sage for serving as editor of Therapeutic Advances in Neurological Disorders. A. Chan received compensation for advisory or speaker activities for Actelion, Almirall, Bayer, Biogen, Celgene, Merck, Novartis, Roche, Sanofi, and Teva, all for hospital research funds, received research support from Biogen, Sanofi, and UCB, and receives compensation from Wiley for serving as associate editor of European Journal of Neurology, all for hospital research funds. Go to Neurology.org/NN for full disclosures.
References
- 1.Thompson AJ, Baranzini SE, Geurts J, Hemmer B, Ciccarelli O. Multiple sclerosis. Lancet 2018;391:1622–1636. [DOI] [PubMed] [Google Scholar]
- 2.Mahad D, Ziabreva I, Lassmann H, Turnbull D. Mitochondrial defects in acute multiple sclerosis lesions. Brain 2008;131:1722–1735. [DOI] [PMC free article] [PubMed] [Google Scholar]
- 3.Biogen Inc. TECFIDERA® (dimethyl fumarate) delayed-release capsules, for oral use [online]. Available at: tecfidera.com/content/dam/commercial/multiple-sclerosis/tecfidera/pat/en_us/pdf/full-prescribing-info.pdf. Accessed July 26, 2019.
- 4.European Medicines Agency. Tecfidera 120 mg gastro-resistant hard capsules. Summary of product characteristics [online]. Available at: ema.europa.eu/documents/product-information/tecfidera-epar-product-information_en.pdf. Accessed July 26, 2019.
- 5.Schimrigk S, Brune N, Hellwig K, et al. Oral fumaric acid esters for the treatment of active multiple sclerosis: an open-label, baseline-controlled pilot study. Eur J Neurol 2006;13:604–610. [DOI] [PubMed] [Google Scholar]
- 6.Scannevin RH, Chollate S, Jung MY, et al. Fumarates promote cytoprotection of central nervous system cells against oxidative stress via the nuclear factor (erythroid-derived 2)-like 2 pathway. J Pharmacol Exp Ther 2012;341:274–284. [DOI] [PubMed] [Google Scholar]
- 7.Brennan MS, Matos MF, Li B, et al. Dimethyl fumarate and monoethyl fumarate exhibit differential effects on KEAP1, NRF2 activation, and glutathione depletion in vitro. PLoS One 2015;10:e0120254. [DOI] [PMC free article] [PubMed] [Google Scholar]
- 8.Gillard GO, Collette B, Anderson J, et al. DMF, but not other fumarates, inhibits NF-κB activity in vitro in an Nrf2-independent manner. J Neuroimmunol 2015;283:74–85. [DOI] [PubMed] [Google Scholar]
- 9.Höxtermann S, Nüchel C, Altmeyer P. Fumaric acid esters suppress peripheral CD4- and CD8-positive lymphocytes in psoriasis. Dermatology 1998;196:223–230. [DOI] [PubMed] [Google Scholar]
- 10.Fox RJ, Chan A, Gold R, et al. Characterizing absolute lymphocyte count profiles in dimethyl fumarate-treated patients with MS: patient management considerations. Neurol Clin Pract 2016;6:220–229. [DOI] [PMC free article] [PubMed] [Google Scholar]
- 11.Banerjee D, Zhao L, Wu L, et al. Small molecule mediated inhibition of RORγ-dependent gene expression and autoimmune disease pathology in vivo. Immunology 2016;147:399–413. [DOI] [PMC free article] [PubMed] [Google Scholar]
- 12.Ranger A, Ray S, Szak S, et al. Anti-LINGO-1 has no detectable immunomodulatory effects in preclinical and phase 1 studies. Neurol Neuroimmunol Neuroinflamm 2018;5:e417. [DOI] [PMC free article] [PubMed] [Google Scholar]
- 13.Irizarry RA, Bolstad BM, Collin F, Cope LM, Hobbs B, Speed TP. Summaries of Affymetrix GeneChip probe level data. Nucleic Acids Res 2003;31:e15. [DOI] [PMC free article] [PubMed] [Google Scholar]
- 14.Li C, Hung Wong W. Model-based analysis of oligonucleotide arrays: model validation, design issues and standard error application. Genome Biol 2001;2:research0032.0031. [DOI] [PMC free article] [PubMed] [Google Scholar]
- 15.Smyth GK Linear models and empirical Bayes methods for assessing differential expression in microarray experiments. Stat Appl Genet Mol Biol 2004;3:Article3. [DOI] [PubMed] [Google Scholar]
- 16.Bioinformatics and Computational Biology Solutions Using R and Bioconductor, 1st ed New York: Springer-Verlag, 2005. [Google Scholar]
- 17.Strassburger-Krogias K, Ellrichmann G, Krogias C, Altmeyer P, Chan A, Gold R. Fumarate treatment in progressive forms of multiple sclerosis: first results of a single-center observational study. Ther Adv Neurol Disord 2014;7:232–238. [DOI] [PMC free article] [PubMed] [Google Scholar]
- 18.Ghoreschi K, Brück J, Kellerer C, et al. Fumarates improve psoriasis and multiple sclerosis by inducing type II dendritic cells. J Exp Med 2011;208:2291–2303. [DOI] [PMC free article] [PubMed] [Google Scholar]
- 19.Kornberg MD, Bhargava P, Kim PM, et al. Dimethyl fumarate targets GAPDH and aerobic glycolysis to modulate immunity. Science 2018;360:449–453. [DOI] [PMC free article] [PubMed] [Google Scholar]
- 20.Lehmann JC, Listopad JJ, Rentzsch CU, et al. Dimethyl fumarate induces immunosuppression via glutathione depletion and subsequent induction of heme oxygenase 1. J Invest Dermatol 2007;127:835–845. [DOI] [PubMed] [Google Scholar]
- 21.Tang H, Lu JY, Zheng X, Yang Y, Reagan JD. The psoriasis drug monomethylfumarate is a potent nicotinic acid receptor agonist. Biochem Biophys Res Commun 2008;375:562–565. [DOI] [PubMed] [Google Scholar]
- 22.Schulze-Topphoff U, Varrin-Doyer M, Pekarek K, et al. Dimethyl fumarate treatment induces adaptive and innate immune modulation independent of Nrf2. Proc Natl Acad Sci U S A 2016;113:4777–4782. [DOI] [PMC free article] [PubMed] [Google Scholar]
- 23.Bhargava P, Fitzgerald KC, Venkata SLV, et al. Dimethyl fumarate treatment induces lipid metabolism alterations that are linked to immunological changes. Ann Clin Transl Neurol 2019;6:33–45. [DOI] [PMC free article] [PubMed] [Google Scholar]
- 24.Spencer CM, Crabtree-Hartman EC, Lehmann-Horn K, Cree BAC, Zamvil SS. Reduction of CD8(+) T lymphocytes in multiple sclerosis patients treated with dimethyl fumarate. Neurol Neuroimmunol Neuroinflamm 2015;2:e76. [DOI] [PMC free article] [PubMed] [Google Scholar]
- 25.Mehta D, Miller C, Arnold DL, et al. Effect of dimethyl fumarate on lymphocytes in RRMS: implications for clinical practice. Neurology 2019;92:e1724-e1738. [DOI] [PMC free article] [PubMed] [Google Scholar]
- 26.Robb J, Hyland M, Samkoff L. Dimethyl fumarate-associated lymphopenia in clinical practice: implications for disease modifying therapy selection. Neurology 2016;86:P6.192. [Google Scholar]
- 27.Gold R, Kappos L, Arnold DL, et al. Placebo-controlled phase 3 study of oral BG-12 for relapsing multiple sclerosis. N Engl J Med 2012;367:1098–1107. [DOI] [PubMed] [Google Scholar]
- 28.Fox RJ, Miller DH, Phillips JT, et al. Placebo-controlled phase 3 study of oral BG-12 or glatiramer in multiple sclerosis. N Engl J Med 2012;367:1087–1097. [DOI] [PubMed] [Google Scholar]
- 29.Fox RJ, Chan A, Gold R. Characterization of absolute lymphocyte count profiles in MS patients treated with delayed-release dimethyl fumarate: considerations for patient management. Mult Scler J 2015;21:P606. [Google Scholar]
Associated Data
This section collects any data citations, data availability statements, or supplementary materials included in this article.
Data Availability Statement
Data supporting this article can be requested via the corresponding authors.


