Abstract
Background:
Polarization sensitive-optical coherence tomography (PS-OCT) provides the unique advantage of being able to measure the optical characteristics of tissues by using polarized light. Although the well-organized fibers of healthy muscle can change the polarization states of passing light, damaged tissue has different behaviors. There are studies on optical imaging methods applied to the respiratory organs; however, they are restricted to structural imaging. In particular, the intercostal muscle situated under the pleura is very challenging to visualize due to the difficulty of access.
Method:
In this study, PS-OCT was used to identify subpleural cancer in male New Zealand white rabbits (3.2–3.4 kg) and to assess the phase retardation changes in normal and cancerous chest walls. VX2 cell suspension was injected between the intercostal muscle and parietal pleura and a tented area was observed by thoracic scope. A group of rabbits (n = 3) were sacrificed at day 7 after injection and another group (n = 3) at day 14.
Results:
In the PS-OCT images, pleura thickness changes and muscle damage were criteria to understand the stages of the disease. The results of image and phase retardation analysis matched well with the pathologic examinations.
Conclusion:
We were able to visualize and analyze subpleural cancer by PS-OCT, which provided structural and functional information. The measured phase retardation could help to identify the margin of the tumor. For further studies, various approaches into other diseases using polarization light are expected to have positive results.
Keywords: Subpleural cancer, Polarization sensitive, Optical coherence tomography
Introduction
Polarization sensitive-optical coherence tomography (PS-OCT) provides the unique advantage of being able to measure the optical characteristics of tissues by using polarized light. This is because the different polarization states of light have a different effective refractive index and optical path length difference (OPD) while passing through birefringent tissues. Using PS-OCT, many researchers have demonstrated that the system is sufficient for diagnostic imaging of the eye [1, 2], skin [3–6], tendons, and muscles [7–10].
However, for respiratory organ imaging, there are a limited number of publications showings that optical imaging methods can be applied to the respiratory organs, and these are restricted to structural imaging [11]. In particular, the intercostal muscle situated under the pleura is very challenging to visualize due to the difficulty of access. If a tumor grows in the innermost intercostal muscle, it is extremely difficult to diagnose pleural cancer early using computed tomography (CT), magnetic resonance imaging (MRI), or ultrasound [12–14], and the respiratory system may be directly attacked.
In this study, PS-OCT was utilized to verify changes of the intercostal muscle and/or the pleura in each stage of subpleural cancer. The quantity of the phase retardation observed was used to determine the margin of the tumor.
Materials and Methods
Animal preparation
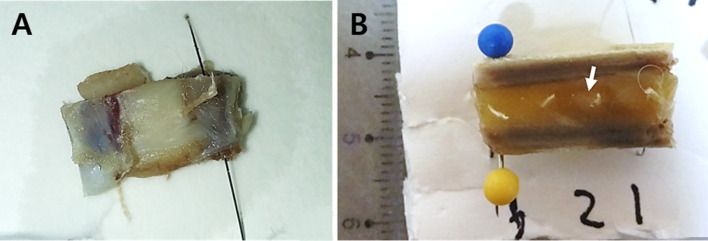
Animal experiments were performed under the Guide for the Care and Use of Laboratory Animals (DHEW publication NIH 85-23, released 2010, Office of Science and Health Reports, DRR/NIH, Bethesda, MD, USA). The Animal Care and Use Committee at the College of Medicine, Kosin University approved the study and male New Zealand white rabbits (3.2–3.4 kg) were used for the experiments. To develop the localized tumor model in rabbits, VX2 cell suspension grafts were performed by oblique needling. The suspension was injected between the intercostal muscle and parietal pleura and a tented area was observed by thoracic scope, as shown in Fig. 1. Figure 2 shows the gross images of the normal chest wall and the chest wall with a tumor. A group of rabbits (n = 3) were sacrificed at day 7 after injection and another group (n = 3) at day 14.
Fig. 1.
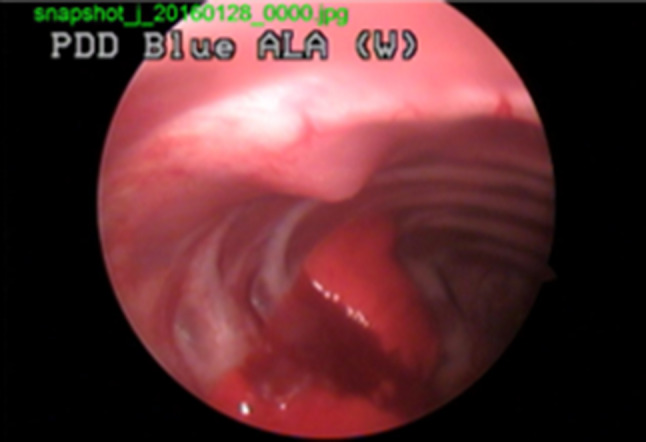
Thoracic scope after VX2 cell suspension graft. VX2 is squamous cell carcinoma originated from rabbit
Fig. 2.
Gross images. A Normal chest wall and B chest wall with cancer tissue. Tumor indicted with the white arrow
Pathology
The pleural tissue was cut into 1 × 1 cm2 pieces and embedded in paraffin for pathological examinations. Serial sections of 4 µm thickness were stained with hematoxylin and eosin (H&E). From the pathological results, the disease stages were defined and classified as early or advanced. The early stage did not include mucosal changes while the advanced stage did.
PS-OCT
A lab-made PS-OCT [18] was used in the experiments. The swept source used in the system had 1060 nm of center wavelength with 111 nm of full width at half maximum (FWHM). Dove prisms generated a combination of polarized lights and light was delivered through the optical fiber. The averaged output power was 1.15 mW. The measured axial resolution was 6.2 µm in the tissue, sensitivity was 91.05 dB, and signal roll-off was 0.65 dB/mm at 0.3 to 2.6 mm depth.
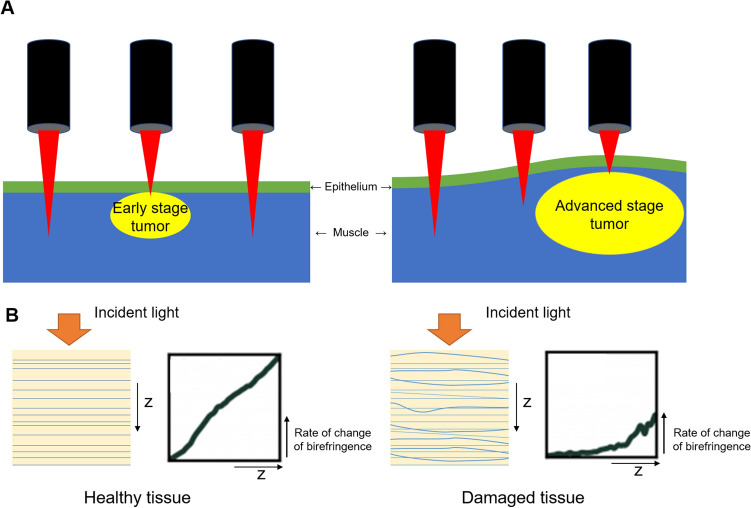
The study designed two types of subpleural tumors: the early stage without mucosal change at day 7 and the advanced stage with mucosal change at day 14 (Fig. 3A). The rate of change of birefringence was assumed to be lower in damaged tissue compared to healthy tissue (Fig. 3B).
Fig. 3.
A Study design for early stage subpleural tumor without mucosal change at day 7 (left) and advanced subpleural tumor with mucosal change at day 14 (right); B hypothesis of this study. The damaged tissue was assumed to have lower rate of change of birefringence than the healthy tissue. The z means the depth axis
Images were captured around the lesions and 5 points on each image were selected to obtain an accumulation of the phase retardation along each A-line. The accumulation was averaged to 11 A-lines (5 A-lines on each side) adjacent to each point. In the normal chest wall in healthy animals, the 5 points were for statistical balance with other groups. In the cancer groups, the 5 points were chosen at the normal-looking area, transition area, and lesion. Due to the heterogeneous nature of the tissue, only the first slope of the phase retardation was compared to each other location. To acquire the phase retardation slope, 4 points were found on each A-line; the surface point, first turning point, second turning point, and the ending of the signal. For the turning points, a least standard deviation (LSD) linear regression was performed based on the segments surface-to-first turning, first turning-to-second turning, and second turning-to-ending. Then, the turning points were chosen when they had the minimum sum of absolute error.
Results and discussion
The main finding was that non-damaged thin pleura was distinguished from the muscle layers with ease in OCT, PS-OCT, and pathological images (Figs. 4 and 5). From PS-OCT images (Figs. 4B and 5B), a uniform pattern of birefringence in muscles was clearly seen and healthy tissue was re-confirmed by pathology (Figs. 4C and 5C).
Fig. 4.
Normal chest wall. A Intensity OCT image, B PS-OCT image, 1-5 are selected A-lines for phase retardation analysis (1-5: normal), C pathology, and D phase retardation accumulation graph. There is no damaged pleura, and a uniform pattern of birefringence in muscles was seen clearly. It was re-confirmed by the pathology. The phase retardations of 1–5 were similar to each other
Fig. 5.
Normal chest wall. A Intensity OCT image, B PS-OCT image, 1-5 are selected A-lines for phase retardation analysis (1-5: normal), C pathology, and D phase retardation accumulation graph. There is no damaged thin pleura, and a uniform pattern of birefringence in muscles was seen clearly. It was re-confirmed by pathology. The phase retardation of 1–5 were similar to each other
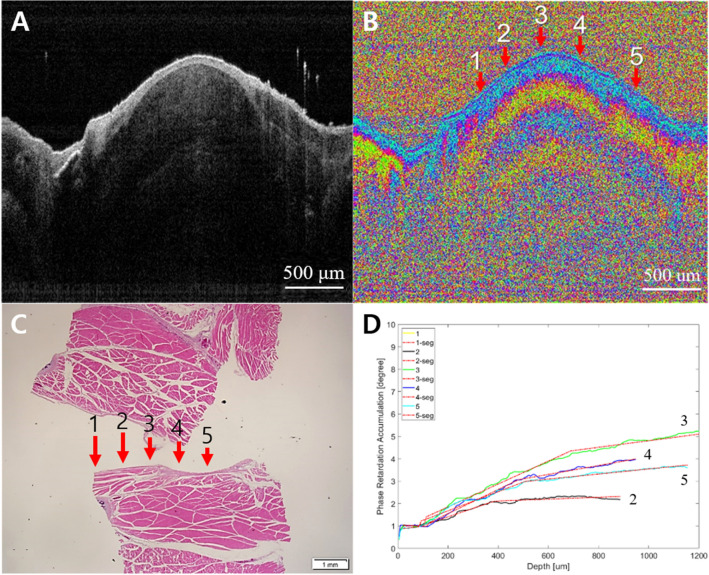
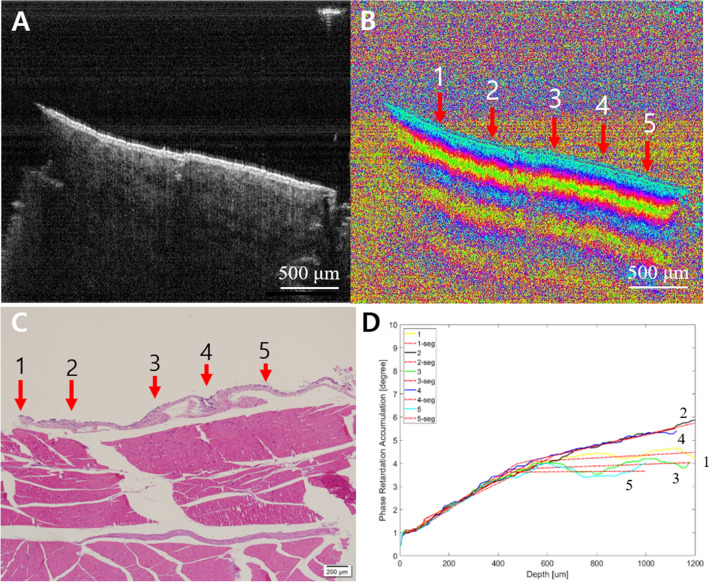
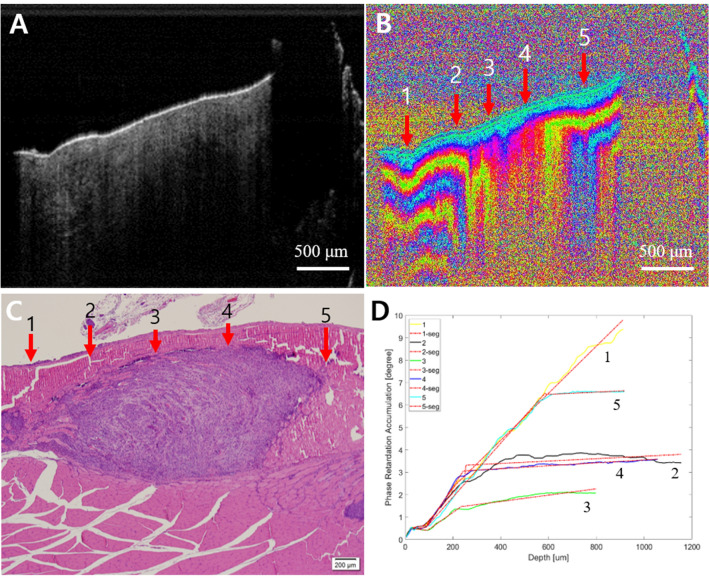
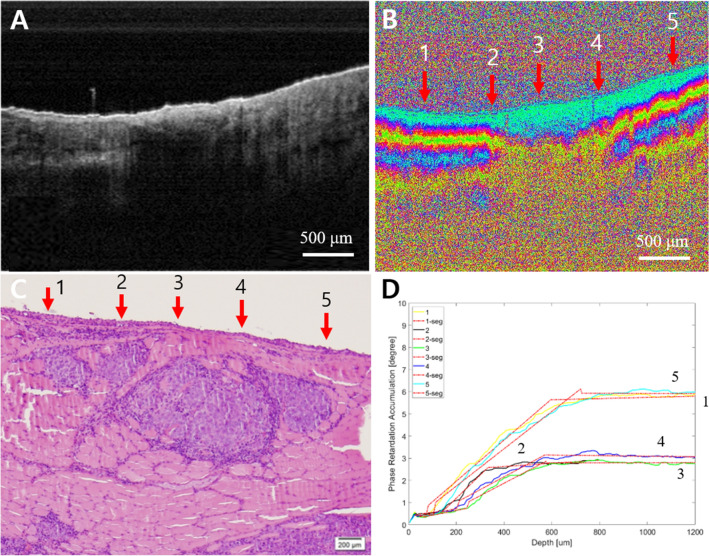
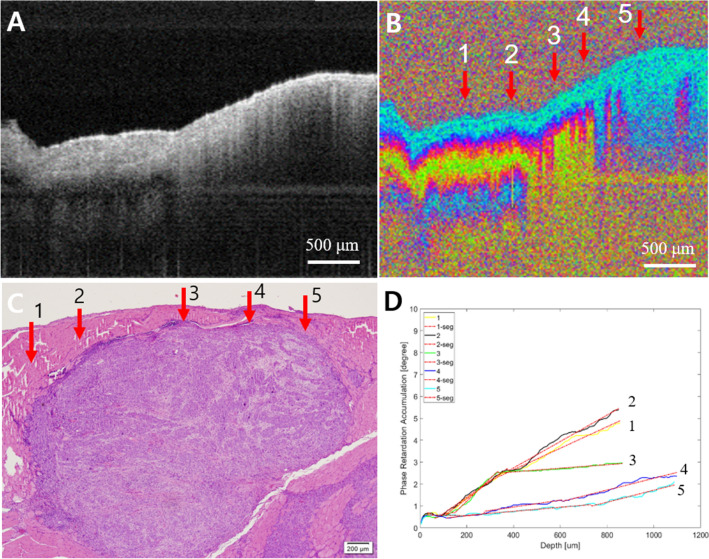
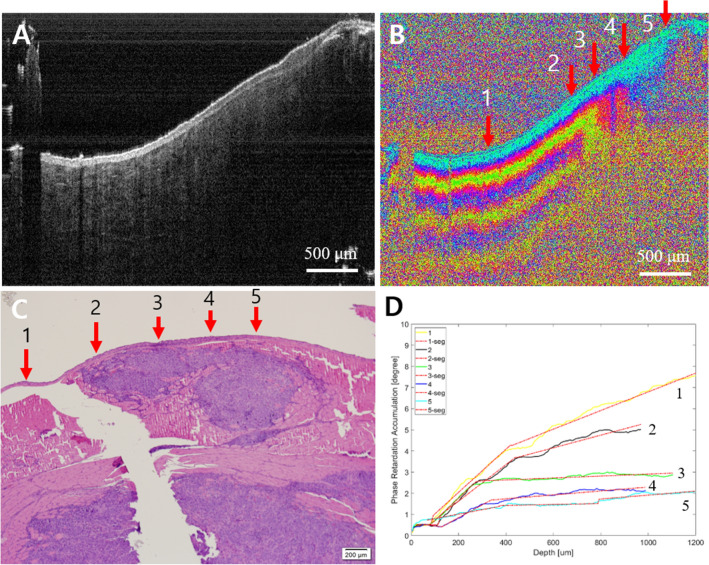
In contrast, the signals from the cancer dramatically changed. From the PS-OCT images, the stages of subpleural cancer were specifically divided into early or advanced according to the damaged layers. Although the earlier cancer could not be distinguished from normal tissue in the intensity OCT images (Figs. 6A and 7A), the PS-OCT images (Figs. 6B and 7B) visualized the destroyed birefringence pattern in the muscle layer with no damage to the pleura. The PS-OCT findings were supported by pathological results (Figs. 6C and 7C). The phase retardation rate across the depth (Figs. 6D and 7D) showed that the damaged muscle had a slower phase retardation rate compared to healthy areas. Unlike the earlier stage of cancer (Figs. 8, 9), advanced cancer area was confirmed in the intensity image (Figs. 8A and 9A). The imaging results of PS-OCT (Figs. 8B and 9B) and pathology (Figs. 8C and 9C) showed the damaged and thickened pleural layer, and these findings were supported by the phase retardation results (Figs. 8D and 9D). Based on the differences of slope retardation by submucosal tumor invasion, PS-OCT have an important potential to guide the surface margin of submucosal tumor, which invaded submucosally beneath normal mucosa.
Fig. 6.
Early cancer. A Intensity OCT image, B PS-OCT image, 1–5 are selected A-lines for phase retardation analysis (1 and 5: normal-looking, 2 and 4: transition, and 3: lesion), C pathology, and D phase retardation accumulation graph. In the PS-OCT image, 2–4 showed the collapsed structure by the tumor. It also showed the tumor in pathology. In the graph, 2–4 have relatively lower phase retardation than 1 or 5
Fig. 7.
Early cancer. A Intensity OCT image, B PS-OCT image, 1–5 are selected A-lines for phase retardation analysis (1 and 5: normal-looking, 2 and 4: transition, and 3: lesion), C pathology, and D phase retardation accumulation graph. In the PS-OCT image, 2–4 showed the collapsed structure by the tumor. It also showed the tumor in pathology. In the graph, 2–4 have relatively lower phase retardation than 1 or 5
Fig. 8.
Advanced cancer. A Intensity OCT image, B PS-OCT image, 1–5 are selected A-lines for phase retardation analysis (1: normal-looking, 2 and 3: transition, and 4 and 5: lesion), C pathology, D phase retardation accumulation graph. The intensity OCT and the PS-OCT images showed a completely collapsed structure by the tumor overgrown enough to get close to the surface of the tissue, as 4 and 5 in pathology. The graph showed low phase retardation, especially at 4 and 5
Fig. 9.
Advanced cancer. A Intensity OCT image, B PS-OCT image, 1–5 are selected A-lines for phase retardation analysis (1: normal-looking, 2 and 3: transition, and 4 and 5: lesion), C pathology, D phase retardation accumulation graph. The intensity OCT image showed a relatively thinned epithelium layer on the right side, and the PS-OCT image showed the layer structure collapsed by the tumor at 2–5. The graph showed a lower phase retardation, especially at 3–5
In conclusion, subpleural cancer is a challenging disease to visualize in the early stages due to difficulties in accessing the chest wall for conventional imaging techniques. Moreover, cases of the early stage cancer may not be detected by structure imaging. In this study, we were able to observe subpleural cancer which was visualized and analyzed by PS-OCT, which provided structural and functional information. The results of image and phase retardation analysis matched well with the pathologic examinations. PS-OCT could therefore be utilized to understand the early stages of this cancer. For further studies, various approaches into other diseases using polarization light are expected to have positive results.
Acknowledgements
This study was supported by a Grant from the National Research Foundation of Korea (NRF) (2017R1D1A1B03035048, 2019M3E5D1A02070860, 2019M3E5D1A02070865, 2019M3E5D1A02070866).
Compliance with ethical standards
Conflict of interest
The authors declare no conflict of interest.
Ethical statement
The animal studies were performed after receiving approval of the Institutional Animal Care and Use Committee (IACUS) in Kosin University College of Medicine (IACUC approval No. KMAP-16–11).
Footnotes
Publisher's Note
Springer Nature remains neutral with regard to jurisdictional claims in published maps and institutional affiliations.
Jung-Eun Park, Zhou Xin, Daa Young Kwon have contributed equally to this work.
Contributor Information
Yeh-Chan Ahn, Email: ahny@pknu.ac.kr.
Chulho Oak, Email: oaks70@daum.net.
References
- 1.Cense B, Chen TC, Park BH, Pierce MC, de Boer JF. In vivo depth-resolved birefringence measurements of the human retinal nerve fiber layer by polarization-sensitive optical coherence tomography. Opt Lett. 2002;27:1610–1612. doi: 10.1364/OL.27.001610. [DOI] [PubMed] [Google Scholar]
- 2.Yamanari M, Tsuda S, Kokubun T, Shiga Y, Omodaka K, Yokoyama Y, et al. Fiber-based polarization-sensitive OCT for birefringence imaging of the anterior eye segment. Biomed Opt Express. 2015;6:369–389. doi: 10.1364/BOE.6.000369. [DOI] [PMC free article] [PubMed] [Google Scholar]
- 3.De Boer JF, Srinivas S, Malekafzali A, Chen Z, Nelson J. Imaging thermally damaged tissue by polarization sensitive optical coherence tomography. Opt Express. 1998;3:212–218. doi: 10.1364/OE.3.000212. [DOI] [PubMed] [Google Scholar]
- 4.Yasuno Y, Makita S, Sutoh Y, Itoh M, Yatagai T. Birefringence imaging of human skin by polarization-sensitive spectral interferometric optical coherence tomography. Opt Lett. 2002;27:1803–1805. doi: 10.1364/OL.27.001803. [DOI] [PubMed] [Google Scholar]
- 5.Pierce MC, Sheridan RL, Hyle Park B, Cense B, de Boer JF. Collagen denaturation can be quantified in burned human skin using polarization-sensitive optical coherence tomography. Burns. 2004;30:511–517. doi: 10.1016/j.burns.2004.02.004. [DOI] [PubMed] [Google Scholar]
- 6.Pircher M, Goetzinger E, Leitgeb R, Hitzenberger C. Three dimensional polarization sensitive OCT of human skin in vivo. Opt Express. 2004;12:3236–3244. doi: 10.1364/OPEX.12.003236. [DOI] [PubMed] [Google Scholar]
- 7.de Boer JF, Milner TE, van Gemert MJ, Nelson JS. Two-dimensional birefringence imaging in biological tissue using polarization-sensitive optical coherence tomography. Opt Lett. 1997;22:934–936. doi: 10.1364/OL.22.000934. [DOI] [PubMed] [Google Scholar]
- 8.Matcher SJ, Winlove CP, Gangnus SV. The collagen structure of bovine intervertebral disc studied using polarization-sensitive optical coherence tomography. Phys Med Biol. 2004;49:1295–1306. doi: 10.1088/0031-9155/49/7/016. [DOI] [PubMed] [Google Scholar]
- 9.Pasquesi JJ, Schlachter SC, Boppart MD, Chaney E, Kaufman SJ, Boppart SA. In vivo detection of exercise-induced ultrastructural changes in genetically-altered murine skeletal muscle using polarization-sensitive optical coherence tomography. Opt Express. 2006;14:1547–1556. doi: 10.1364/OE.14.001547. [DOI] [PubMed] [Google Scholar]
- 10.Ju MJ, Hong YJ, Makita S, Lim Y, Kurokawa K, Duan L, et al. Advanced multi-contrast jones matrix optical coherence tomography for Doppler and polarization sensitive imaging. Opt Express. 2013;21:19412–19436. doi: 10.1364/OE.21.019412. [DOI] [PubMed] [Google Scholar]
- 11.Hanna N, Saltzman D, Mukai D, Chen Z, Sasse S, Milliken J, et al. Two-dimensional and 3-dimensional optical coherence tomographic imaging of the airway, lung, and pleura. J Thorac Cardiovasc Surg. 2005;129:615–622. doi: 10.1016/j.jtcvs.2004.10.022. [DOI] [PubMed] [Google Scholar]
- 12.Tateishi U, Gladish GW, Kusumoto M, Hasegawa T, Yokoyama R, Tsuchiya R, et al. Chest wall tumors: radiologic findings and pathologic correlation: part 2. Malignant tumors. Radiographics. 2003;23:1491–1508. doi: 10.1148/rg.236015527. [DOI] [PubMed] [Google Scholar]
- 13.Sakuma K, Yamashiro T, Moriya H, Murayama S, Ito H. Parietal pleural invasion/adhesion of subpleural lung cancer: Quantitative 4-dimensional CT analysis using dynamic-ventilatory scanning. Eur J Radiol. 2017;87:36–44. doi: 10.1016/j.ejrad.2016.12.004. [DOI] [PubMed] [Google Scholar]
- 14.Rednic N, Orasan O. Subpleural lung tumors ultrasonography. Med Ultrason. 2010;12:81–87. [PubMed] [Google Scholar]


