Abstract
Spectral splitting is an approach to the design of hybrid photovoltaic-thermal (PVT) collectors that promises significant performance benefits. However, the ultimate efficiency limits, optimal PV cell materials and optical filters of spectral-splitting PVT (SSPVT) collectors remain unclear, with a lack of consensus in the literature. We develop an idealized model of SSPVT collectors and use this to determine their electrical and thermal efficiency limits, and to uncover how these limits can be approached through the selection of optimal PV cell materials and spectral-splitting filters. Assuming that thermal losses can be minimized, the efficiency limit, optimal PV material and optimal filter all depend strongly on a coefficient w, which quantifies the value of the delivered thermal energy relative to that of the generated electricity. The total (electrical plus thermal) efficiency limit of SSPVT collectors increases at higher w and at higher optical concentrations. The optimal spectral-splitting filter is defined by sharp lower- and upper-bound energies; the former always coincides with the bandgap of the cell, whereas the latter decreases at higher w. The total effective efficiency limit of SSPVT collectors is over 20% higher than those of either standalone PV modules or standalone ST collectors when w is in the range from 0.35 to 0.50 and up to 30% higher at w ≈ 0.4. This study provides a method for identifying the efficiency limits of ideal SSPVT collectors and reports these limits, along with guidance for selecting optimal PV materials and spectral-splitting filters under different conditions and in different applications.
Subject terms: Optical physics, Solar energy and photovoltaic technology
Optimizing the performance of hybrid photovoltaic-thermal collectors
Scientists have developed a method for predicting and optimizing the performance of hybrid photovoltaic-thermal (PVT) collectors. Photovoltaic (PV) cells use only a portion of the solar spectrum to generate electricity, limiting the efficiency of single-junction cells to 20–30%. PVT collectors improve on this overall solar utilization by recovering unused thermal energy and delivering a useful thermal output. Spectral splitting is a promising approach for improving the performance of PVT collectors by exploiting the spectral sensitivity of PV cells. Christos Markides and Gan Huang from Imperial College London, in collaboration with Kai Wang from Zhejiang University, have developed a comprehensive framework for modelling spectral-splitting PVT collectors, which they have used to determine the efficiency limits of such collectors and how these limits can be approached through the selection of optimal PV cell materials and spectral-splitting optical filters.
Introduction
Solar energy is a clean and abundant energy source. Current methods of harvesting solar energy include solar thermal (ST) and photovoltaic (PV) technologies. The latter have attracted considerable interest in recent decades, as PV cells are able to convert solar energy directly into valuable electricity without noise and moving parts in simple systems that are easy to install1–3. Global PV capacity crossed the milestone of 500 GW in 2018, overtaking solar water-heating collector capacity for the first time and continuing to grow, reaching 630 GW in 20194. Common solar cell materials include semiconductors, such as Si5, CdTe6, GaAs7, CIGS8 and perovskites9. Single-junction Si cells remain dominant within the global PV market owing to their low costs and mature manufacturing processes10.
Only an incident photon with a higher energy level than the bandgap of solar cells can activate an electron-hole pair and generate electricity. Thus, solar cells are sensitive to only a part of the solar spectrum that can be converted to electricity. The theoretical efficiency limit of Si solar cells is ~30% under one sun according to the seminal research of Shockley and Quisser11. Other solar cells also experience this partial spectral sensitivity12. The unused portion of the solar spectrum dissipates as waste heat in solar cells, increasing their operating temperature and leading to a monotonic deterioration in their electrical efficiency. The electrical efficiency of mono- and polycrystalline Si cells typically decreases by 4.0–6.5% for every 10 °C increase in operating temperature13. Radiative cooling approaches can be used to further improve these efficiencies14.
PVT technology has been attracting increased interest as a solution that promotes broader solar utilization. Flat-plate PVT collectors are the most common design, most of which are based on attaching a thermal absorber to the back of PV modules. The thermal absorber cools the PV cells but also harvests waste heat from the cells as useful thermal energy, which can be utilized downstream for domestic hot water or space heating15,16. This makes PVT collectors significantly more efficient overall than standalone PV modules17,18. However, in these arrangements, the thermal absorber is designed to be in good thermal contact with the PV cells, leading to similar PV cell and absorber operating temperatures and compromising the PV efficiency if a higher-temperature thermal output is pursued. This ‘thermal coupling’ feature of conventional PVT collectors unavoidably limits their performance and applications.
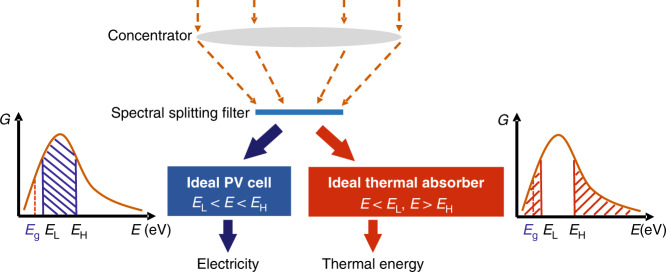
Spectral splitting, as proposed in various forms as early as the 1970s and 1980s, is a promising approach for improving the performance of PVT collectors by exploiting the partial spectral sensitivity of PV cells while minimizing, through alternative designs, the thermal coupling in these collectors. The conceptual principle of a spectral-splitting PVT (SSPVT) collector is illustrated in Fig. 1.
Fig. 1.
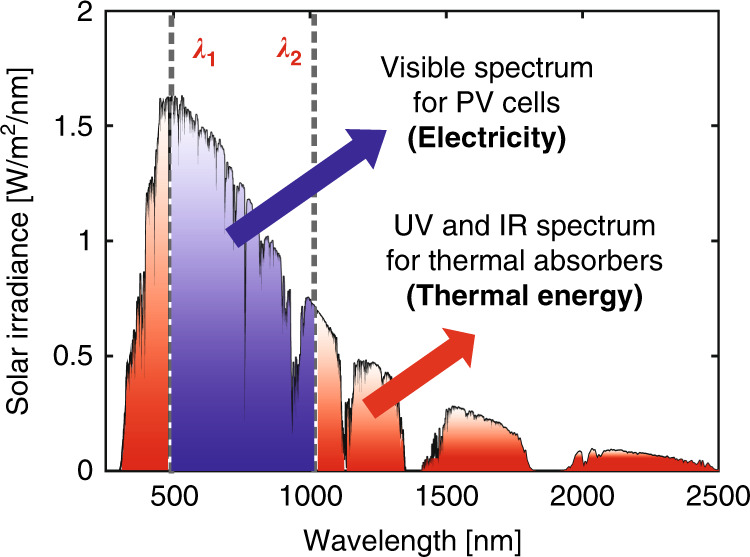
Spectral-splitting concept motivation as applied to PVT collectors.
As shown in this figure, in SSPVT collector concepts, the solar spectrum is separated into three different parts at wavelengths λ1 and λ2, of which only the visible part of the spectrum (λ1 < λ < λ2) is sent to the PV cells for electricity generation, while the rest of the spectrum in the ultraviolet (UV) and IR regions is directed to a thermal absorber. In this way, both the PV cells and thermal absorber can operate at appropriate temperatures and the SSPVT collector is able to produce very high-temperature heat without compromising the PV efficiency. High-temperature heat can be utilized in various industrial applications or, if high enough, for thermal power generation.
Current SSPVT collector concepts typically employ one of two spectral-splitting approaches based on either selectively reflective or absorptive optical filters. Selectively reflective filters, which are used widely in concentrating PVT collector designs, allow part of the solar spectrum to pass through to the PV cells and reflect the rest to a thermal absorber19–23. Selectively absorptive filters, on the other hand, allow only part of the solar spectrum to pass through to the PV cells and directly absorb the rest of the spectrum. Liquid flows, which can act as both optical filters and heat transfer fluids, have been proposed as promising selectively absorptive filters. Within this category, nanofluids (nanoparticle suspensions) are promising and emergent selectively absorptive filter types for SSPVT collectors, which have attracted significant interest recently24–27. The state-of-the-art SSPVT technology based on emerging nanomaterials has been summarized in a recent review article28.
The optical characteristics of the spectrum-splitting filter are crucial to the performance of SSPVT collectors, as this strongly determines the electrical, thermal and total (electrical plus thermal) efficiencies of such collectors. A number of real filters have been developed to date, including thin-film reflective and nanofluid absorptive filters. However, identifying the optimum filter, i.e., optimal values of λ1 and λ2 in Fig. 1, remains a challenge, with various studies reporting different optimum filters even for the same PV cell. The optimal wavelengths for Si cells in SSPVT collectors were reported as 751–1126 nm in Taylor et al.25, 732–1067 nm in Crisostomo et al.29, 640–1127 nm in Bierman et al.30, 600–1150 nm in Otanicar et al.31, 400–1100 nm in Shou et al.32, and 300–1100 nm in Soule et al.19. This widespread reveals a lack of consensus in the literature concerning the definition of the optimal filter, even for the most common solar cell. Furthermore, although many PV materials (Si, CdTe, GaAs and InGaP) have been applied to SSPVT collector applications, the optimal PV material for a SSPVT collector also remains unclear. Therefore, the efficiency limits of SSPVT collectors, which depend strongly on the PV material and spectral-splitting filter, remain unclear.
In this study, we develop a methodology and a model capable of rationally identifying the optimal PV cell material and spectral-splitting optical filter in different applications and of predicting the ideal efficiency limits of concentrating SSPVT collectors employing these cells and filters. The performance of SSPVT collectors in a typical application of thermal power generation is analysed. We also consider the performance of SSPVT collectors with common PV materials (Si, CIGS, CdTe, GaAs, GaInP and others) and seek to identify corresponding optimal spectral-splitting filters.
Results
Physical and mathematical modelling framework
A physical model of an ideal concentrating SSPVT collector is shown in Fig. 2. Solar illumination is concentrated by an ideal concentrator and then spectrally separated into parts by a spectral-splitting filter according to the energy of the incident photons. Photons with energy EL < E < EH are directed to an ideal PV cell with a bandgap energy Eg and the rest (E < EL, E > EH) are absorbed by an ideal thermal absorber to generate high-temperature thermal energy. Here, EL and EH are defined as the lower and upper bounds of the optical filter (in eV), and the range between EL and EH is referred to as the ‘filter window’. Of note is that an ideal PV cell will inevitably generate waste heat even if only the desired photons are directed to the cell. The waste heat in the PV cell is challenging to recover in the form of high-temperature thermal energy both due to the low temperature limits of PV cells, which assign a low value (heat grade) to this energy, and due to the associated complexity and cost of related solutions. The SSPVT collector design employed in this study, therefore, does not attempt to recover the low-temperature waste heat in the PV cell, such that this heat is ultimately rejected to the environment.
Fig. 2.
Physical model of an ideal concentrating SSPVT collector.
The mathematical model in this paper is based on the following assumptions: (1) the PV cell is ideal, has a quantum efficiency of 1 and is maintained at 300 K via efficient heat rejection; (2) the optical concentrator is ideal and concentrates the incident sunlight (AM1.5) with negligible optical losses; and (3) the spectral-splitting filter ideally separates the incident photons into two parts, as shown in Fig. 2, without optical losses. The SSPVT collector model is developed on the basis of the above assumptions to determine the efficiency limits of concentrating SSPVT collectors.
The electrical efficiency of the (ideal) PV cell can be determined from:
| 1 |
where C is the concentration ratio, Gs(λ) is the incident solar spectral irradiance based on AM1.5, VPV is the applied cell voltage and IPV is the current in a single-junction solar cell11,33,34:
| 2 |
where QE is the quantum efficiency, TPV is the temperature of the PV cell and Eg is the bandgap energy of the cell. Detailed equations are introduced in the final section of this paper (i.e., ‘Materials and Methods’).
The thermal efficiency of the thermal absorber can be determined from:
| 3 |
where ηth,loss is the fraction of the total incident solar energy that is lost from the collector through heat transfer and Eth is the useful thermal energy gained by the thermal absorber.
Four concentration ratios (C = 100, 210, 1000 and 45,000) are investigated in this study, where C = 210 and 45,000 are taken as limits for linear concentrators (e.g., parabolic trough concentrators) and circular concentrators (e.g., parabolic dish concentrators and solar towers), respectively35, and C = 100 is taken as a typical concentration ratio that can be achieved in practice by current parabolic trough concentrators or parabolic dish concentrators36. Finally, C = 1000 is taken as a typical concentration ratio of current solar towers36. The heat loss ratio ηth,loss decreases as the concentration ratio increases. The heat loss can also be significantly suppressed via emissivity control and evacuation37. Thus, the term ηth,loss for a concentrating collector can be made small at high concentration ratios, e.g., ηth,loss of a typical evacuated tube ST collector is <1% at a concentration ratio of 100 when the output temperature is ~400 °C above the ambient temperature37,38. Therefore, this term is assumed to be small in this work. It is noted, however, that in cases where this assumption is not valid, this framework can be easily extended to account for realistic losses if desired, e.g., by expressing ηth,loss in terms of suitable radiative and convective loss terms.
As the values of heat and electricity are different and depend strongly on the application and the demands for these two energy vectors, a total effective efficiency can be defined as:
| 4 |
where w is a weight coefficient that converts the thermal energy to an equivalent amount of electricity and reflects the worth of thermal energy relative to that of electricity. This coefficient can be based on a thermodynamic value (e.g., via second-law arguments or heat engine conversion efficiencies), a cost value (e.g., through a price ratio of heat/electricity) or a ratio of environmental benefits (e.g., displaced or mitigated emissions). The optimum filter in a SSPVT collector depends on the definition of the total effective efficiency, i.e., the value of w. In this study, the total effective efficiency is also treated as the merit function in the optimization of the filter and the bandgap energy of the PV cell.
Total effective efficiency limits of SSPVT collectors for different w
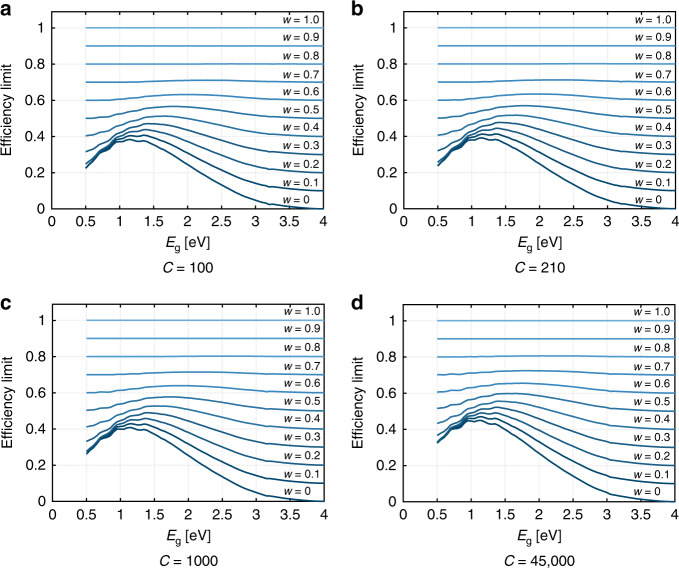
The total effective efficiency ηtot of SSPVT collectors reaches a maximum value for optimal values of EL and EH. Figure 3a shows the limit of the total effective efficiency of SSPVT collectors for different PV cells with different bandgap energies and for different w at a concentration ratio of C = 100. The curve generated for w = 0 corresponds to the electrical efficiency limit of standalone concentrating PV cells with different bandgap energies. The thermal energy becomes more valuable (relative to electricity) as the weight coefficient w increases, leading to a significant increase in the limit of the total effective efficiency, as similar to pure ST collectors vis-a-vis PV modules, the conversion of sunlight to heat is more efficient than its conversion to electricity. At an extreme scenario of w = 1, the thermal energy has an equal value to that of the generated electricity. In this case, a ST collector delivers the highest efficiency of 100% (as we assume no heat losses at high concentrations). The total effective efficiency limit is sensitive to the solar cell bandgap energy when w is in the range from 0 to 0.5, corresponding to scenarios in which electricity is at least twice as valuable as thermal energy. The bandgap energy has a slight influence on the total effective efficiency limit when w is larger than 0.8, indicating that PV cells are less necessary when the thermal energy delivered is of comparable value to electricity. In summary, the total effective efficiency limit of SSPVT collectors depends strongly on not only the solar cell bandgap energy but also the relative value of thermal energy relative to that of electricity (i.e., w).
Fig. 3.
Limit of the total effective efficiency for different w and C = 100, 210, 1000, 45,000.
The total effective efficiency limits of SSPVT collectors with higher concentration ratios of C = 210, 1000 and 45,000 are shown in Fig. 3b–d. The efficiency limits shift upwards as the concentration ratio increases when the value of w is smaller than 0.5, but when w is above 0.5, this effect is minor. The standalone PV cell efficiency limit increases from 38% to 45% as C increases from 100 to 45,000. The limit of the total effective efficiency of SSPVT collectors thus increases as the concentration increases owing to the increased PV efficiency when w is below 0.5. In either case, the total effective efficiency limit is more sensitive than that of the concentration ratio, which suggests that the application is a greater determinant of performance than the solar conditions or the concentrating optical design of the system.
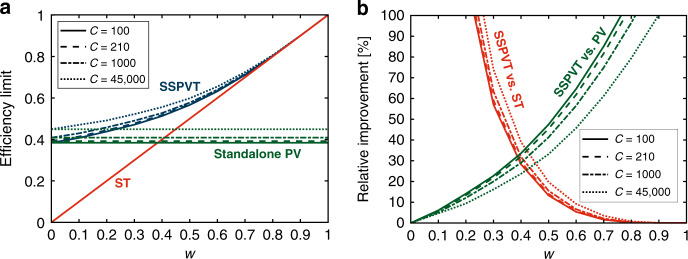
Also of interest are comparisons of the efficiency limits of SSPVT collectors to those of standalone single-junction PV modules and ST collectors in Fig. 4a. SSPVT collectors are able to adjust the fraction of the solar energy directed to the PV cell and to the thermal absorber according to the value of w, to optimize the collector and maximize the total effective efficiency. Thus, a SSPVT collector always has a higher efficiency than either standalone PV modules or standalone ST collectors when 0 < w < 1. The total effective efficiency limit of SSPVT collectors equals that of standalone PV modules at w = 0, and that of standalone ST collectors at w = 1. The total effective efficiency limit of SSPVT collectors also increases as the concentration ratio C increases.
Fig. 4.
a Efficiency limits of SSPVT, ST and standalone PV, and b relative improvement of SSPVT compared to ST and PV as a function of w for different C = 100, 210, 1000, 45,000.
The relative improvement offered by SSPVT collectors over ST collectors, in terms of total efficiency, decreases as w increases, whereas the relative improvement of SSPVT collectors over standalone PV modules increases as w increases, as shown in Fig. 4b. Too large or too small values of w decrease the advantage offered by SSPVT collectors over either standalone ST collectors or standalone PV modules. In particular, SSPVT collectors have a considerable advantage over standalone PV modules and standalone ST collectors when w is within a given range that depends on the concentration. For example, the total effective efficiency limit of SSPVT collectors at the maximum concentration ratio (C = 45,000) is over 20% higher (in relative terms) than those of both standalone PV modules and standalone ST collectors when w is between 0.35 and 0.50.
Of particular interest are the crossing points in Fig. 4b, which indicate design conditions for which SSPVT collectors have a maximum advantage over either standalone PV modules or ST collectors in applications where both electricity and heat are required and when all of these technologies are available for selection. To the left of these points, PV modules are preferred to ST collectors; to the right, ST collectors offer a better total efficiency than PV modules. These efficiency limit crossover points of SSPVT collectors for C = 100, 210, 1000 and 45,000 are 33%, 32%, 31% and 29% higher than those of standalone PV modules or ST collectors when w = 0.38, 0.39, 0.40 and 0.45, respectively, as shown in Fig. 4b.
The optimal solar cell bandgap energy Eg and the corresponding optimal lower-bound EL and upper-bound EH for different w and different concentration ratios C are shown in Fig. 5. The optimal lower-bound EL always coincides with the bandgap energy Eg. An incident photon can convert only a part of its energy equalling the PV bandgap energy to electricity, while the rest of the photon energy is dissipated as waste heat. Low-energy photons with an energy close to the PV bandgap can be fully utilized by PV cells at high electrical conversion efficiency (relative to high-energy photons). Thus, the optimal lower-bound EL always equals the bandgap energy Eg to maximize the total effective efficiency, considering that thermal energy is normally less valuable than electricity.
Fig. 5. Optimal PV bandgap energy and corresponding optimal filters for different w.
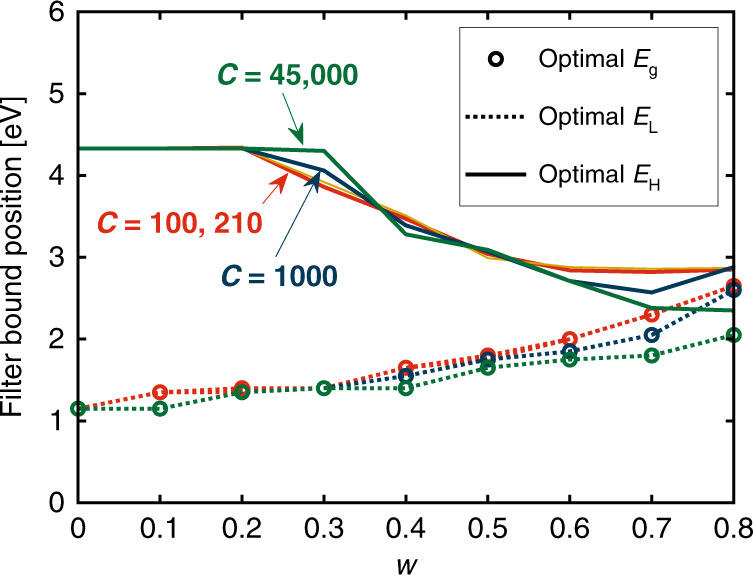
Energies (in eV) can be converted to wavelengths (in nm) via λ(nm) = 1240/E(eV), e.g., 4.4eV ≈ 280 nm.
The optimal upper-bound EH decreases at higher values of w. High-energy photons (in the UV spectrum) have a lower electrical conversion efficiency than low-energy photons but also have a high thermal conversion efficiency. Thus, the optimal EH decreases as w increases, such that more high-energy photons are directed to the thermal absorber as the value of thermal energy increases. The upper limit of Eh is ~4.4 eV, which is the maximum energy of the incident photons. The optimal bandgap energy for SSPVT collectors increases from 1.05 to 2.05 eV as w increases from 0 to 0.8 when C = 45,000. Once the values of w and C of an application are specified, both the optimal PV material (i.e., optimal Eg) and the optimal filter (i.e., optimal EL and EH) can be selected by referring to Fig. 5. It is noteworthy that all energies can be readily converted to wavelengths via the expression λ(nm) = 1240/E(eV).
Performance of SSPVT collectors in power-generation applications
The definition and value of w depend strongly on the specific application. In this section, the performance of SSPVT collectors in power-generation applications is considered, in which the thermal energy produced by the SSPVT collectors is used downstream to generate secondary electricity via a heat engine. In this case, the total electricity generated by this combined system is equal to that generated by the PV cells in the SSPVT collectors plus that generated by the secondary heat-to-work conversion process.
This section considers SSPVT collectors that are able to produce high-temperature heat, which can be utilized for electricity generation via thermodynamic cycles. The weight coefficient w in Eq. (4) can be defined for this particular scenario by considering the thermodynamic value of the heat delivered by the SSPVT collectors. Following a technology agnostic approach, we can define an ideal conversion process from heat to work (electricity) via an ideal (Carnot) heat-engine engine with:
| 5 |
where Th is the output (heat delivery) temperature of the SSPVT collector, which is considered to be approximately equal to the temperature of the thermal absorber of the collector, and Tc is the cold sink temperature of the heat engine (Tc = 300 K in this study). The term w in Eq. (5) presents the highest value of heat relative to that of electricity when the delivered heat is converted to electricity. In this context, the total effective efficiency limits of SSPVT collectors, as expressed in Eq. (4), correspond to the total electrical efficiency of the combined system described above.
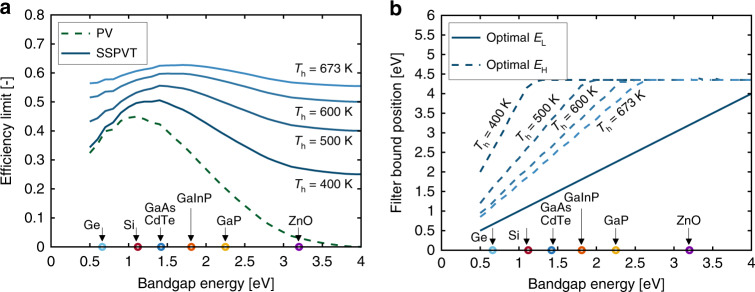
The total SSPVT effective efficiencies at the maximum concentration ratio for different ST output temperatures (Th = 400, 500, 600 and 673 K) are shown in Fig. 6a, where 673 K is taken as the maximum limiting temperature of the common high-temperature heat transfer oil Therminol VP-139. At temperatures of 400, 500, 600 and 673 K, we obtain corresponding w-values of 0.25, 0.40, 0.50 and 0.55, respectively. From this figure, we observe that integrating SSPVT collectors with ST power generation leads in all cases to significantly higher total electrical efficiencies than standalone PV systems. The total effective efficiency limit of SSPVT collectors increases as the output temperature Th increases, driven by the increase in the value of higher-temperature heat. The total effective efficiency limit reaches a peak at 63% at the highest temperature of Th = 673 K (w = 0.55) but is also sensitive to the bandgap energy of the PV cell material. Seven PV materials with different bandgap energies are marked on the abscissa of Fig. 6a: Ge (0.66 eV), Si (1.12 eV), GaAs (1.42 eV), CdTe (1.43 eV), GaInP (1.81 eV), GaP (2.25 eV) and ZnO (3.20 eV)40. The optimal PV materials for the SSPVT collector with Th = 400 K (w = 0.25) are GaAs and CdTe, which have an efficiency limit of 51%. The selection of the PV material is crucial to SSPVT collectors when Th = 400 K (w = 0.25), as the efficiency limit is sensitive to the bandgap energy of the cell. The optimal bandgap energy moves to higher values as the output temperature increases. The optimal PV material for SSPVT collectors with Th = 673 K (w = 0.55) is GaInP. The total effective efficiency limit of SSPVT collectors with Th = 673 K varies in the range 55–63%, as the bandgap is varied (corresponding to different PV materials). The selection of the PV material has a slight influence (only 7%) on the total effective efficiency limit of SSPVT collectors when Th = 673 K, as indicated in Fig. 7a.
Fig. 6.
a Total effective efficiency limits and b optimal lower and upper bounds of spectral-splitting filters for SSPVT power-generation applications (w = 1 − Th/Tc, C = 45,000). Output temperatures Th = 400, 500, 600 and 673 K correspond to w = 0.25, 0.40, 0.50 and 0.55, respectively.
Fig. 7. Total effective efficiency limits of SSPVT collectors in power-generation applications for different concentration ratios.
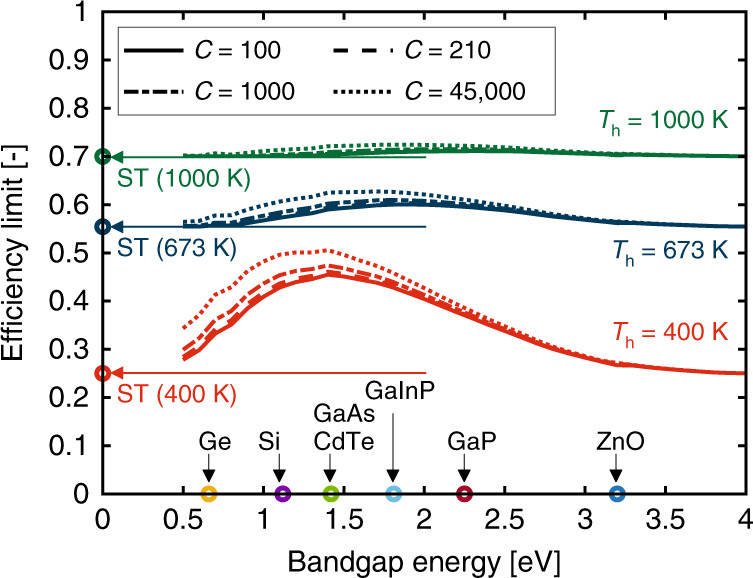
Output temperatures Th = 400, 500, 600 and 673K correspond to w = 0.25, 0.40, 0.50 and 0.55, respectively.
The optimal spectral-splitting filters at four different output temperatures (Th = 400, 500, 600 and 673 K) are shown in Fig. 6b. The optimal lower-bound EL always equals the bandgap energy of the PV material, whereas the optimal upper-bound EH depends not only on the PV material but also on the temperature of the thermal output. Higher-temperature heat is more valuable, as it can be converted to electricity with a higher efficiency. Therefore, the optical filter window narrows as Th increases from 400 K to 673 K (as w increases from 0.25 to 0.55), indicating that more solar energy is directed to the thermal absorber as less solar energy is directed to the PV cells. For example, the optimal filter for the Si-based SSPVT collector directs only 19% of the incident solar energy to the thermal absorber when Th = 400 K, but it directs 62% of the solar energy to the thermal absorber when Th = 673 K.
The total effective efficiency limits of SSPVT collectors in power-generation applications for different concentration ratios are shown in Fig. 7. The efficiency limit increases as the concentration ratio C increases, owing to the higher PV efficiency at higher concentration ratios. However, although the concentration ratio has an influence on the electrical efficiency and the total effective efficiency, which is noticeable at low temperatures, this decreases at higher temperatures, at which the contribution of the PV electrical output decreases relative to that of the collector’s thermal output. When the temperature reaches Th = 1000 K (w = 0.70), only 17% of the solar energy is directed to the PV cells and the effect of concentration becomes negligible, as shown in the figure.
Furthermore, from Fig. 7, we can observe that optimum SSPVT collectors have a total efficiency advantage over ST collectors, although this gradually diminishes at progressively higher Th. The total efficiency limit of SSPVT collectors at lower temperatures (here, 400 K) is close to double that of ideal ST collectors but is only 3–4% higher, in relative terms, when the output temperature is as high as 1000 K.
Performance of SSPVT collectors with common PV materials
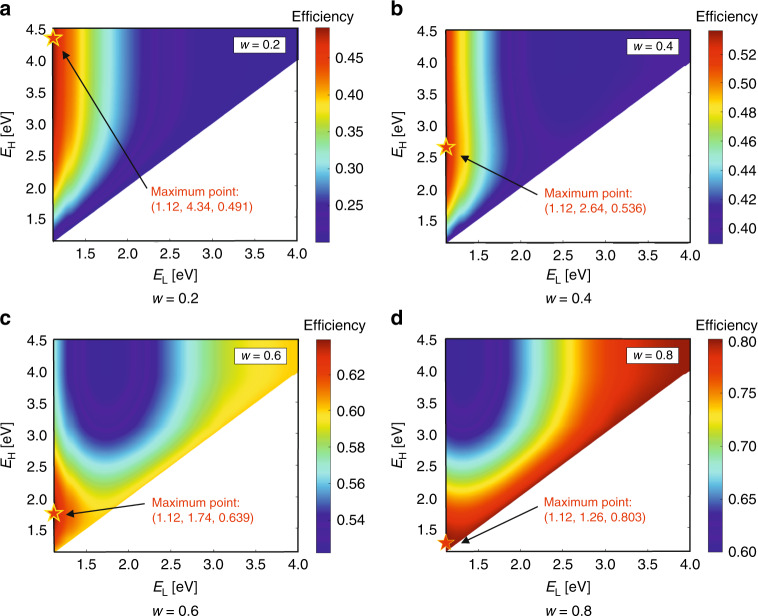
Si is the most common PV material and accounts for over 90% of the current global PV market. The bandgap energy of Si is 1.12 eV (1110 nm). Distributions of the total effective efficiency limits of SSPTV collectors with different spectral-splitting filters for w = 0.2, 0.4, 0.6 and 0.8 are shown in Fig. 8. The lower and upper bounds of the spectral-splitting filter significantly affect the total effective efficiency limits of these collectors. The maxima in Fig. 9 are presented in terms of (EL, EH, ηtot), which indicate the optimal lower bounds, upper bounds and maximum total effective efficiencies for different w. We note that the value of w has a significant influence on the total effective efficiency limit and on the optimal filter. The optimal lower bound and upper bound are 1.12 eV and 4.34 eV, respectively, for w = 0.2, as shown in Fig. 8a. As the energy limit of solar photons is ~4.4 eV, nearly all incident photons with energy higher than the bandgap energy are directed to the Si solar cell by the optimal filter when w = 0.2, corresponding to a scenario where electricity is much more valuable than heat. The optimal upper-bound EH decreases from 4.34 to 2.64 eV as w increases from 0.2 to 0.4. In this case, more photons with higher energy (in the UV region) are sent to the thermal absorber as the value of thermal energy increases. Interestingly, the optimal lower-bound EL is always 1.12 eV for all scenarios, which coincides with the bandgap energy of Si. The optimal upper-bound EH approaches the lower-bound EL for the case of w = 0.8, as shown in Fig. 8d, indicating that nearly all incident solar photons are directed to the thermal absorber when thermal energy has comparable value to that of electricity.
Fig. 8. Total effective efficiency for different EL, EH and w-values (C = 45,000, PV material: Si).
The values stated at the maximum points are (EL, EH, ηtot).
Fig. 9.
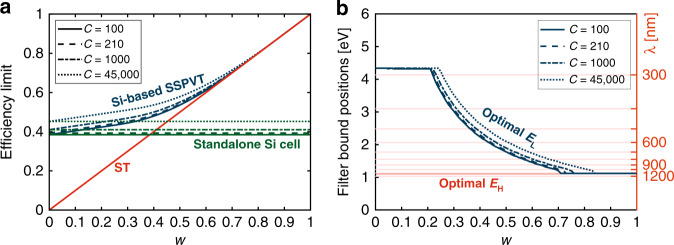
a Total effective efficiency limit of Si-based SSPVT collectors, standalone Si cells and ST collectors, and b optimal spectral-splitting filter of SSPVT collectors with Si solar cells.
Figure 9a compares the total effective efficiency limits of Si-based SSPVT collectors to those of standalone Si cells and ST collectors for different weights w and concentrations C. The total effective efficiency of Si-based SSPVT collectors increases significantly at higher w or C. The electrical efficiency of the standalone Si cell increases from 39% to 45% as C increases from 100 to 45,000. The advantage of Si-based SSPVT collectors over standalone ideal Si cell modules becomes larger as w increases and the performance of these SSPVT collectors approaches that of the ideal ST collector.
The optimal filters of Si-based SSPVT collectors are shown in Fig. 9b. The left ordinate is in terms of electron energy (eV), whereas the right ordinate is in terms of wavelength (nm). When w is <0.2, the optical filter window spans the maximum extent from 1.12 to 4.34 eV (290 to 1110 nm), which coincides with the entire spectral sensitivity (i.e., quantum efficiency) range of Si solar cells. In this case, the maximum extent of the spectrum is directed to the cells, because electricity is more valuable than thermal energy. The filter window for the Si-based collector ‘closes’ at w = 0.72 and 0.85 when C = 100 and 45,000, respectively, which means that all the solar radiation is directed to the thermal absorber and the PV cell is no longer necessary, corresponding to the scenario in which thermal energy has an equivalent value to electricity. The optimal lower-bound EL always equals the bandgap energy of Si 1.12 eV (1110 nm) for all scenarios. The optimal upper-bound EH increases as the concentration ratio increases. Figure 9b provides a detailed guidance for selecting an optimal filter for the Si-based SSPVT collector according to the values of w and C in specific applications.
Other common PV materials include Si, GaAs, CdTe, Cu(In,Ga)(Se,S)2 (CIGS) and GaInP40. As mentioned earlier, Si cells dominate the current global PV market, followed by CdTe and CIGS41. The bandgap energies of the above materials are 1.12 eV (Si), 1.42 eV (GaAs), 1.43 eV (CdTe) and 1.81 eV (GaInP)40. The bandgap energy of CIGS can be continuously tuned from ≈1.0 to 2.4 eV by varying the ratios of In/Ga and Se/S40. The bandgap of the current record-efficiency CIGS solar cells is ~1.10–1.13 eV40,42,43, which is close to the bandgap energy of Si. Thus, the bandgap energy of CIGS is taken as 1.12 eV in this section. Ge (0.66 eV) and GaP (2.25 eV) are also included in the analysis considering their utilization of a very different region of the solar spectrum. In addition, in the context of PVT applications, GaAs has good performance at high temperatures44.
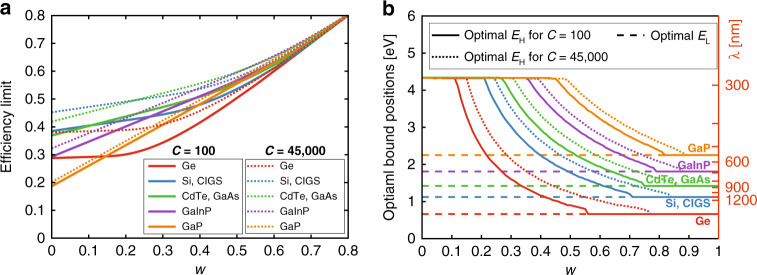
The total effective efficiency limits of SSPVT collectors employing the aforementioned PV materials are shown in Fig. 10. As the bandgap of CIGS is close to that of Si, while that of CdTe is close to that of GaAs, Si and CIGS share a single pair of curves in this figure, whereas CdTe and GaAs share another. Figure 10a shows that the limits of the total effective efficiency increase as w or C increases for all PV materials. The performance of SSPVT collectors with different materials becomes increasingly similar as w increases, with the material having a very slight influence on performance for w > 0.7. Below this value of w, the optimal PV cell material depends strongly on the values of w and C, so the material needs to be selected carefully, because it determines the ultimate efficiency limit of SSPVT collectors. In general, Si, CIGS, CdTe and GaAs are more suitable for use in SSPVT collectors than in other solar cells, delivering a higher total effective efficiency limit. GaInP gradually catches up as w increases. Ge and GaP are largely unsuitable PV cell materials for SSPVT collectors due to their bandgap energies, which are either too low or too high.
Fig. 10.
a Limits of total effective efficiency and b optimal spectral-splitting filters for different common PV cell materials.
The optimal spectral-splitting filters for different PV materials are shown in Fig. 10b. The optimal lower-bound EL always equals the bandgap energy of the PV material, which is consistent with earlier observations in this study. Similarly, the upper-bound EH decreases as w increases, as observed above. The optical filter windows for all PV materials finally cross at certain ‘closing’ points (i.e., the cross points of the curves of optimal EL and EH) as w increases. The filter windows for Si/CIGS, CdTe/GaAs and GaInP are close at w = 0.85, 0.87 and 0.89, respectively, when C = 45,000. The SSPVT collectors operate effectively as ST collectors when w exceeds the value at the closing point. The closing point moves rightward as the bandgap energy of the PV cell increases, as shown in Fig. 10b. Figure 10 provides guidance for selecting an optimal PV material and the corresponding optimal spectral-splitting filters that maximize the total effective efficiency limit of SSPVT collectors for different scenarios (i.e., different w and C).
Sensitivity analysis of non-ideal factors
In the above sections, we employed an idealized model to determine the total effective efficiency limits of SSPVT collectors. However, in practice, there is a gap between the characteristics of real materials (PV cells, optical filters and thermal absorbers) and those of ideal materials, which will lead to a performance loss. In this section, we consider the impact of non-ideal PV cells, optical filters and thermal absorbers on real SSPVT collector performance. For this purpose, we define two coefficients that describe the non-ideality of real components, one in relation to the PV cells and one to the thermal absorber:
| 6 |
| 7 |
where ηPV_idl is the efficiency of ideal PV cells with Shockley–Queisser (S-Q) limit efficiencies, ηth_idl is the efficiency of an ideal thermal absorber with 100% efficiency (see also the justification for this ideal assumption in the present work below Eq. (3)), and ηPV_act and ηth_act are the actual efficiencies of real PV cells and thermal absorbers, respectively. The ICPV value of Si solar cells reached ≈90% in 201945, whereas the ICth value of thermal absorbers in solar towers has also been reported to reach ≈90%46.
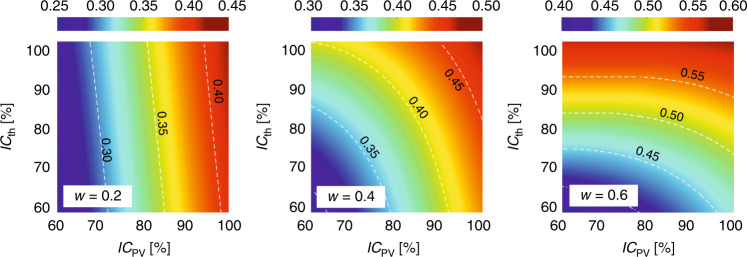
The influence of the two coefficients above, ICPV and ICth, on the total effective efficiency limit of SSPVT collectors is shown in Fig. 11, with Si selected as the PV material due to its widespread use and a concentration ratio that has been set to C = 100, which is readily realized in practice.
Fig. 11.
Influence of non-ideal coefficients of the PV cells and thermal absorber, ICPV and ICth, on the SSPVT total effective efficiency limit ηtot (C = 100, PV material: Si).
We note that the influence of ICPV and ICth on the SSPVT total effective efficiency limit depends strongly on the value of w. Compared to ICth, ICPV has a more significant influence on this efficiency limit for w = 0.2, corresponding to scenarios in which electricity is considerably more valuable than heat. Both ICPV and ICth affect the total effective efficiency limit when w = 0.4 and ICth becomes the main influencing factor when w = 0.6. Therefore, to improve the total effective efficiency limit of real SSPVT systems with non-ideal PV cells and thermal absorbers, the designer should focus on improving ICPV when w is small (e.g., w = 0.2) and on improving ICth when w is large (e.g., w = 0.6).
Beyond the PV cells and thermal absorber, the optical filter is another component that can affect the performance of real SSPVT collectors, because, as above, the lower and upper bounds of real filters may deviate from their optimal ideal values. The deviations of these two bounds (i.e., ΔEL and ΔEH) are:
| 8 |
| 9 |
where EL_opt and EH_opt are the lower and upper bounds of the ideal optimal filter, respectively, and EL_act and EH_act are the real bounds. The influence of ΔEL and ΔEH (units: eV) on the total effective efficiency limit of SSPVT collectors is shown in Fig. 12.
Fig. 12.
Influence of deviations of EL and EH from their optimal values on the SSPVT total effective efficiency limit ηtot (C = 100, PV material: Si).
The deviation ΔEL always has a more significant influence on the SSPVT total effective efficiency limit than ΔEH, which is found to have only a slight influence on this efficiency limit within the range ±0.5 eV. Therefore, it is more important for the designer to ensure that the lower bound of the real optical filter EL is close to its optimal value if the ideal optimal cut-off cannot be achieved in practice. The optimal EL value always equals the bandgap of the PV cells, e.g., 1.12 eV (1110 nm) for Si cells. Furthermore, a positive deviation of EL from its ideal value (i.e., ΔEL > 0) leads to a more significant reduction in the total efficiency limit than a negative deviation for w = 0.2, whereas a negative deviation (i.e., ΔEL < 0) leads to a more significant reduction in the efficiency limit for w = 0.6.
Other non-ideal factors that can influence the present results include the PV material bandgap energy, which can shift with temperature if the cells are not sufficiently cooled, and the concentrator optical efficiency. In practice, it may be difficult to cool the PV cells to 300 K at high solar concentrations, with increased PV temperatures usually decreasing the bandgap energy. For example, the bandgap of Si decreases by ≈3% from 1.12 to 1.09 eV as the temperature increases from 300 to 400 K. The effect of this PV bandgap energy shift on the total effective efficiency limits of SSPVT collectors can be seen in Fig. 3, which shows only a slight influence on the efficiency limits that vanishes asymptotically at higher w.
Discussion
We have proposed a framework for predicting the performance of SSPVT collectors, with the aims of identifying the total effective efficiency limits of SSPVT collectors and of providing detailed guidance for selecting optimal PV materials and optimal spectral-splitting filters capable of delivering a combined thermal and electrical performance that reaches the efficiency limits of this technology.
The value of a weighing coefficient w, which considers the relative value of thermal energy to that of electricity, has a significant influence on the total effective efficiency limits, the optimal PV cell material and the optimal spectral-splitting filter of ideal SSPVT collectors. The limit of the total effective efficiency increases as either w or the concentration ratio, C, increase, but is less sensitive to the latter, which suggests that the application is a greater determinant of the ultimate performance of such systems. The total effective efficiency of SSPVT collectors is also particularly sensitive to the bandgap energy of the PV material when w is <0.5, corresponding to scenarios in which the electricity is at least twice as valuable as the generated thermal energy. The optimal lower-bound absorption energy of the spectral-splitting filter always equals the bandgap energy of the employed PV material, whereas the upper-bound filter absorption energy decreases as w increases. The optical filter window between the two bounds becomes narrower at higher w, indicating that more solar energy is directed to the thermal absorber as the thermal output attains a higher value.
SSPVT collectors have an advantage over PV modules that grows monotonically as w increases from zero (which is associated with higher thermal-output temperatures, Th). Specifically, when w = 1, SSPVT collectors have ~2.5 times the total efficiency of PV modules. On the other hand, the advantage of ideal SSPVT collectors over ST collectors improves as w decreases from unity (which is associated with lower Th). The total effective efficiency limit of SSPVT collectors in cogeneration applications requiring lower-temperature heat (i.e., ≈100 °C) is approximately double that of ideal ST collectors when considering the relative thermodynamic values of electricity and heat. At intermediate temperatures, SSPVT collectors have the greatest advantage over either of these standalone conventional technologies and systems when both are available for selection and installation. The total effective efficiency limit of SSPVT collectors is over 20% higher than those of both standalone PV modules and ST collectors when w is in the range from 0.35 to 0.50 and is up to 30% higher at w ≈ 0.4.
The optimal PV cell material for SSPVT collectors depends strongly on the values of w and C, which in turn are set by the specifics of the application. Suitable PV materials for high-concentration SSPVT collectors are Si and CIGS when w < 0.22 or CdTe and GaAs when w > 0.22; these same solar cell materials also appear to be the best choice for lower-concentration SSPVT collectors, with GaInP appearing as an additional promising material at higher w (above ≈0.4). On the other hand, Ge and GaP emerge from this analysis as less suitable for SSPVT collectors due to their extreme (low/high) bandgap energies. Finally, CIGS cells are considered particularly promising for SSPVT collector applications, owing to their adjustable bandgap energy within the range of ≈1.0–2.4 eV.
The optimal lower and upper bounds of the spectral-splitting filter depend on the PV material, concentration ratio C and weighting coefficient w.
In summary, detailed maps and other results in this study can assist designers in selecting appropriate PV cell materials and spectral-splitting optical filters, depending on the conditions and application, to achieve optimal overall performance accounting for both energy vectors (i.e., electricity and heat) being provided by these collectors and wider systems.
Materials and methods
In the model of SSPVT collectors in the main text, the PV electrical efficiency is obtained by a classical PV model. The energy of a photon, corresponding to its wavelength λ, can be calculated from:
| 10 |
where h is Planck’s constant, c is the speed of light, q is the elementary charge and λ is the photon wavelength.
The number of electron-hole pairs generated in the semiconductor can be calculated from11:
| 11 |
where QE is the quantum efficiency, Gs(λ) is the incident solar spectral irradiance based on AM1.5, and λ1 and λ2 are the lower- and upper-bound wavelengths of the optical filter, corresponding to EH and EL, respectively. The radiative recombination loss of electron-hole pairs can be ignored in an ideal PV cell. Furthermore, the solar concentration ratio C is defined as C = Aa/Ar, where Aa is the aperture area of the optical concentrator and Ar is the receiver area.
The short-circuit current generated by electron-hole pairs can be calculated from:
| 12 |
Thus, according to the standard diode equation, the current in a single-junction solar cell under solar illumination is given by33:
| 13 |
where VPV is the applied cell voltage, kb is the Boltzmann constant, TPV is the temperature of the PV cell and n is the ideality factor (=1 in an ideal single p–n junction solar cell).
In the expression above (i.e., Eq. (13)), I0 is the dark saturation current, the limit of which is a function of the bandgap energy33,34:
| 14 |
where Eg is the bandgap energy of the PV cell in units of eV and where the thermodynamic limit of I00 is given by Kiess and Rehwald34:
| 15 |
Based on the above, the electrical efficiency of the ideal PV cell can be determined from:
| 16 |
Furthermore, the solar energy absorbed by the thermal absorber is given by:
| 17 |
Once Eth is known, the thermal efficiency of the thermal absorber can be determined from:
| 18 |
| 19 |
where Eloss is the heat loss, including convective and radiative losses from the thermal absorber to the ambient environment, and ηth,loss is the ratio of the heat loss to the total incident solar energy.
An in-house code was developed to solve the above set of equations. The one-dimensional integrals were solved by a numerical integration method based on Riemann sums47. The extreme PV efficiency value (i.e., maximum power point) was identified via a first derivative algorithm, whereas the optimal lower and upper bounds of the optical filter and the optimal PV bandgap were identified via an enumeration algorithm.
The PV model is an important element of the present framework. The electrical efficiency limits of different single-junction solar cells under one sun are calculated using the above model and numerical methodology, and then compared to results from other authoritative publications to validate the model in our study. The well-known S-Q limit has been widely used to estimate the electrical efficiency limits of single-junction solar cells11,48. The electrical efficiency limits predicted in our study agree well with the S-Q limit and the recent result from Meillaud et al.33, as shown in Fig. 13.
Fig. 13.
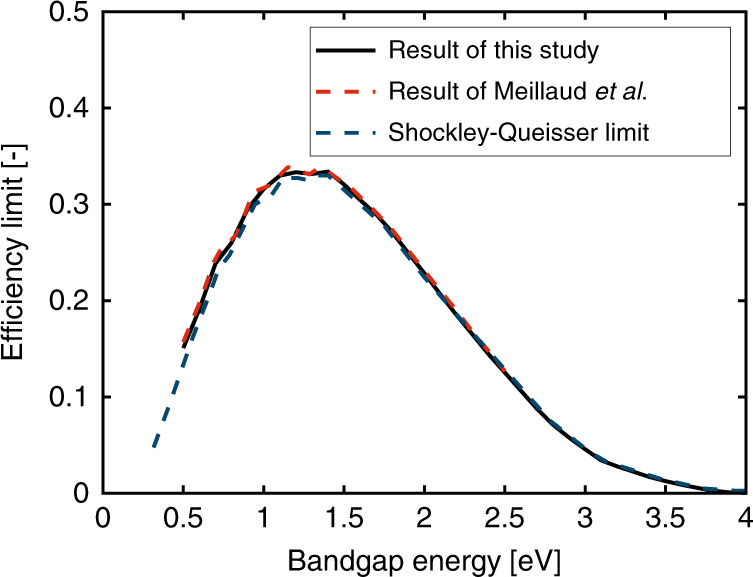
Electrical efficiency limits of single-junction solar cells under the AM1.5 standard predicted by this study, validated against the results from Meillaud et al.33, and Shockley and Queisser11,48.
Acknowledgements
This work was supported by the UK Engineering and Physical Sciences Research Council (EPSRC) (grant numbers EP/M025012/1 and EP/R045518/1). The work was also supported by the Imperial College London EPSRC Impact Acceleration Account (grant number EP/R511547/1). We thank UK company Solar Flow Ltd (www.solar-flow.co.uk). We acknowledge helpful discussions with Dr. Benjamin Franchetti and Dr. Ioannis Pesmazoglou. Data supporting this publication can be obtained on request from cep-lab@imperial.ac.uk.
Author contributions
G.H., K.W. and C.N.M. conceived the project. G.H. performed the analysis. G.H., K.W. and C.N.M. wrote the paper. C.N.M. supervised the project.
Conflict of interest
The authors declare that they have no conflicts of interest.
References
- 1.Green MA. The path to 25% silicon solar cell efficiency: history of silicon cell evolution. Prog. Photovolt. 2009;17:183–189. doi: 10.1002/pip.892. [DOI] [Google Scholar]
- 2.Hodes G. Perovskite-based solar cells. Science. 2013;342:317–318. doi: 10.1126/science.1245473. [DOI] [PubMed] [Google Scholar]
- 3.Yoshikawa K, et al. Silicon heterojunction solar cell with interdigitated back contacts for a photoconversion efficiency over 26% Nat. Energy. 2017;2:17032. doi: 10.1038/nenergy.2017.32. [DOI] [Google Scholar]
- 4.REN21. Renewables 2020 Global Status Report, http://www.ren21.net/wp-content/uploads/2019/05/gsr_2020_full_report_en.pdf (2020).
- 5.Carlson DE, Wronski CR. Amorphous silicon solar cell. Appl. Phys. Lett. 1976;28:671–673. doi: 10.1063/1.88617. [DOI] [Google Scholar]
- 6.Wu XZ. High-efficiency polycrystalline CdTe thin-film solar cells. Sol. Energy. 2004;77:803–814. doi: 10.1016/j.solener.2004.06.006. [DOI] [Google Scholar]
- 7.Kosten ED, et al. Highly efficient GaAs solar cells by limiting light emission angle. Light Sci. Appl. 2013;2:e45. doi: 10.1038/lsa.2013.1. [DOI] [Google Scholar]
- 8.Kaelin M, Rudmann D, Tiwari AN. Low cost processing of CIGS thin film solar cells. Sol. Energy. 2004;77:749–756. doi: 10.1016/j.solener.2004.08.015. [DOI] [Google Scholar]
- 9.Na GR, Zhang LJ. Stable and luminescent halide perovskite fabricated in water. Light Sci. Appl. 2020;9:106. doi: 10.1038/s41377-020-0340-x. [DOI] [PMC free article] [PubMed] [Google Scholar]
- 10.Singh R. Why silicon is and will remain the dominant photovoltaic material. J. Nanophotonics. 2009;3:032503. doi: 10.1117/1.3196882. [DOI] [Google Scholar]
- 11.Shockley W, Queisser HJ. Detailed balance limit of efficiency of p-n Junction solar cells. J. Appl. Phys. 1961;32:510–519. doi: 10.1063/1.1736034. [DOI] [Google Scholar]
- 12.Field, H. Solar cell spectral response measurement errors related to spectral band width and chopped light waveform. In Proc. Conference Record of the 26th IEEE Photovoltaic Specialists Conference 471–474 (IEEE, Anaheim, California, 1997).
- 13.Radziemska E. The effect of temperature on the power drop in crystalline silicon solar cells. Renew. Energy. 2003;28:1–12. doi: 10.1016/S0960-1481(02)00015-0. [DOI] [Google Scholar]
- 14.Li W, Buddhiraju S, Fan SH. Thermodynamic limits for simultaneous energy harvesting from the hot sun and cold outer space. Light Sci. Appl. 2020;9:68. doi: 10.1038/s41377-020-0296-x. [DOI] [PMC free article] [PubMed] [Google Scholar]
- 15.Herrando M, Markides CN, Hellgardt K. A UK-based assessment of hybrid PV and solar-thermal systems for domestic heating and power: system performance. Appl. Energy. 2014;122:288–309. doi: 10.1016/j.apenergy.2014.01.061. [DOI] [Google Scholar]
- 16.Guarracino I, et al. Dynamic coupled thermal-and-electrical modelling of sheet-and-tube hybrid photovoltaic/thermal (PVT) collectors. Appl. Therm. Eng. 2016;101:778–795. doi: 10.1016/j.applthermaleng.2016.02.056. [DOI] [Google Scholar]
- 17.Wang K, et al. Technoeconomic assessments of hybrid photovoltaic-thermal vs. conventional solar-energy systems: case studies in heat and power provision to sports centres. Appl. Energy. 2019;254:113657. doi: 10.1016/j.apenergy.2019.113657. [DOI] [Google Scholar]
- 18.Wu JS, et al. A review of thermal absorbers and their integration methods for the combined solar photovoltaic/thermal (PV/T) Modules. Renew. Sustain. Energy Rev. 2017;75:839–854. doi: 10.1016/j.rser.2016.11.063. [DOI] [Google Scholar]
- 19.Soule, D. E. et al. Efficient hybrid photovoltaic-photothermal solar conversion system with cogeneration. In Proc. SPIE 0562, Optical Materials Technology for Energy Efficiency and Solar Energy Conversion IV 166–175 (SPIE, San Diego, 1985).
- 20.Wang K, et al. Spectral-splitting hybrid PV-thermal (PVT) systems for combined heat and power provision to dairy farms. Renew. Energy. 2020;159:1047–1065. doi: 10.1016/j.renene.2020.05.120. [DOI] [Google Scholar]
- 21.Jiang S, et al. Optical modeling for a two-stage parabolic trough concentrating photovoltaic/thermal system using spectral beam splitting technology. Sol. Energy Mater. Sol. Cells. 2010;94:1686–1696. doi: 10.1016/j.solmat.2010.05.029. [DOI] [Google Scholar]
- 22.Widyolar B, et al. Theoretical and experimental performance of a two-stage (50X) hybrid spectrum splitting solar collector tested to 600 °C. Appl. Energy. 2019;239:514–525. doi: 10.1016/j.apenergy.2019.01.172. [DOI] [Google Scholar]
- 23.Liang HX, et al. Experimental investigation on spectral splitting of photovoltaic/thermal hybrid system with two-axis sun tracking based on SiO2/TiO2 interference thin film. Energy Convers. Manag. 2019;188:230–240. doi: 10.1016/j.enconman.2019.03.060. [DOI] [Google Scholar]
- 24.Hjerrild NE, et al. Hybrid PV/T enhancement using selectively absorbing Ag–SiO2/carbon nanofluids. Sol. Energy Mater. Sol. Cells. 2016;147:281–287. doi: 10.1016/j.solmat.2015.12.010. [DOI] [Google Scholar]
- 25.Taylor RA, Otanicar T, Rosengarten G. Nanofluid-based optical filter optimization for PV/T systems. Light Sci. Appl. 2012;1:e34. doi: 10.1038/lsa.2012.34. [DOI] [Google Scholar]
- 26.Hassani S, et al. Environmental and exergy benefit of nanofluid-based hybrid PV/T systems. Energy Convers. Manag. 2016;123:431–444. doi: 10.1016/j.enconman.2016.06.061. [DOI] [Google Scholar]
- 27.An W, et al. Experimental investigation of a concentrating PV/T collector with Cu9S5 nanofluid spectral splitting filter. Appl. Energy. 2016;184:197–206. doi: 10.1016/j.apenergy.2016.10.004. [DOI] [Google Scholar]
- 28.Huang G, et al. Challenges and opportunities for nanomaterials in spectral splitting for high-performance hybrid solar photovoltaic-thermal applications: a review. Nano Mater. Sci. 2020;2:183–203. doi: 10.1016/j.nanoms.2020.03.008. [DOI] [Google Scholar]
- 29.Crisostomo F, et al. Spectral splitting strategy and optical model for the development of a concentrating hybrid PV/T collector. Appl. Energy. 2015;141:238–246. doi: 10.1016/j.apenergy.2014.12.044. [DOI] [Google Scholar]
- 30.Bierman DM, Lenert A, Wang EN. Spectral splitting optimization for high-efficiency solar photovoltaic and thermal power generation. Appl. Phys. Lett. 2016;109:243904. doi: 10.1063/1.4971309. [DOI] [Google Scholar]
- 31.Otanicar T, et al. Experimental evaluation of a prototype hybrid CPV/T system utilizing a nanoparticle fluid absorber at elevated temperatures. Appl. Energy. 2018;228:1531–1539. doi: 10.1016/j.apenergy.2018.07.055. [DOI] [Google Scholar]
- 32.Shou CH, et al. Investigation of a broadband TiO2/SiO2 optical thin-film filter for hybrid solar power systems. Appl. Energy. 2012;92:298–306. doi: 10.1016/j.apenergy.2011.09.028. [DOI] [Google Scholar]
- 33.Meillaud F, et al. Efficiency limits for single-junction and tandem solar cells. Sol. Energy Mater. Sol. Cells. 2006;90:2952–2959. doi: 10.1016/j.solmat.2006.06.002. [DOI] [Google Scholar]
- 34.Kiess H, Rehwald W. On the ultimate efficiency of solar cells. Sol. Energy Mater. Sol. Cells. 1995;38:45–55. doi: 10.1016/0927-0248(94)00214-2. [DOI] [Google Scholar]
- 35.Duffie, J. A., Beckman, W. A. & Blair, N. Solar Engineering of Thermal Processes, Photovoltaics and Wind. 5th edn (Wile, Hoboken, NJ, 2020).
- 36.Breeze, P. Solar Power Generation (Academic Press, London, 2016).
- 37.Yılmaz IH, Mwesigye A. Modeling, simulation and performance analysis of parabolic trough solar collectors: a comprehensive review. Appl. Energy. 2018;225:135–174. doi: 10.1016/j.apenergy.2018.05.014. [DOI] [Google Scholar]
- 38.Stine, W. B. & Geyer, M. Power from the Sun, Ch. 5, https://www.powerfromthesun.net (2020).
- 39.THERMINOL. Therminol VP-1 Heat Transfer Fluid, http://www.therminol.com/product/71093459 (2020).
- 40.Polman A, et al. Photovoltaic materials: present efficiencies and future challenges. Science. 2016;352:aad4424. doi: 10.1126/science.aad4424. [DOI] [PubMed] [Google Scholar]
- 41.Ramanujam J, Singh UP. Copper indium gallium selenide based solar cells–a review. Energy Environ. Sci. 2017;10:1306–1319. doi: 10.1039/C7EE00826K. [DOI] [Google Scholar]
- 42.Kamada, R. et al. New world record Cu(In, Ga)(Se, S)2 thin film solar cell efficiency beyond 22%. In Proc. 43rd IEEE Photovoltaic Specialists Conference 1287–1291 (IEEE, Portland, OR, 2016).
- 43.Nakamura M, et al. Cd-free Cu(In,Ga)(Se,S)2 thin-film solar cell with record efficiency of 23.35% IEEE J. Photovolt. 2019;9:1863–1867. doi: 10.1109/JPHOTOV.2019.2937218. [DOI] [Google Scholar]
- 44.Maros, A. et al. High temperature characterization of GaAs single junction solar cells. In Proc. 42nd IEEE Photovoltaic Specialists Conference 1–5 (IEEE, New Orleans, 2015).
- 45.Green MA, et al. Solar cell efficiency tables (version 54) Prog. Photovolt. 2019;27:565–575. doi: 10.1002/pip.3171. [DOI] [Google Scholar]
- 46.Wang WQ, et al. Coupled optical and thermal performance of a fin-like molten salt receiver for the next-generation solar power tower. Appl. Energy. 2020;272:115079. doi: 10.1016/j.apenergy.2020.115079. [DOI] [Google Scholar]
- 47.Hamming, R. W. Numerical Methods for Scientists and Engineers 2nd edn. (Dover, 2012).
- 48.Rühle S. Tabulated values of the Shockley–Queisser limit for single junction solar cells. Sol. Energy. 2016;130:139–147. doi: 10.1016/j.solener.2016.02.015. [DOI] [Google Scholar]


