

Abstract
Background
Non‐small cell lung cancer (NSCLC) accounts for 85% of lung cancer which is the most frequently diagnosed malignancy in China. Colon cancer associated transcript 1 (CCAT1) acts as an oncogene in enhancing tumor progression. However, the effects of CCAT1 in NSCLC remain unclear. The purpose of this study was to explore the role of CCAT1 in NSCLC.
Methods
Wound healing and transwell assays were performed to measure cell migration. RT‐qPCR was employed to calculate the mRNA level of CCAT1 and miR‐490.
Results
High expression of CCAT1 was observed in NSCLC tissues and cells, with low expression of miR‐490. CCAT1 promoted the proliferation and metastasis of H1299 and A549 cells, while miR‐490 had the opposite effect. CCAT1 could specifically bind to miR‐490 and regulate its expression. MiR‐490 partially reversed the inhibitory effect of CCAT1 on cell proliferation and metastasis.
Conclusions
The CCAT1/miR‐490 molecular axis has been shown to be important for the treatment of NSCLC.
Keywords: CCAT1, migration, miR‐490, non‐small cell lung cancer
CCAT1 promotes the survival and metastasis of H1299 cells, while miR‐490 has the opposite effect.The CCAT1/miR‐490 molecular axis has been shown to be important for the treatment of non‐small cell lung cancer.
Introduction
Lung cancer is one of the most frequently determined malignancies, with the highest mortality reported in China. 1 Non‐small cell lung cancer (NSCLC) accounts for 85% of lung cancer. The main subtypes of NSCLC are adenocarcinoma, squamous cell carcinoma and large cell carcinoma. 2 Currently, despite improvements in the treatment of NSCLC, the five‐year survival rate for patients remains at less than 15%. Thus, it is important that the novel molecular biomarkers for the early diagnosis of NSCLC are explored.
Long non‐coding RNA (lncRNA) is a new type of RNA molecule with a length of more over 200 nt. 3 RNAs are thought not to be able to code for proteins because they lack long open reading frames (ORFs). Several lncRNAs, which have tumor suppressor or oncogenic properties, are reported to be highly dysregulated in multiple cancers. 4 , 5 For example, lncRNA colon cancer associated transcript 1 (CCAT1), a 2628 bp lncRNA located at chromosome 8q24.21, has been found to be overexpressed in several cancers, including colorectal cancer, breast cancer and hepatocellular carcinoma. 6 , 7 , 8 CCAT1 function as an oncogene in human cancer and is involved in tumor‐genesis, progression, metastasis, and patient survival. 9 Knockdown of CCAT1 was found to inhibit cell growth, invasion and peritoneal metastasis in gastric cancer in a study by Li et al. 10
Accumulating evidence indicates that lncRNA acts as a microRNA (miRNA) sponge to capture miRNAs, and regulate cancer progression. 11 LncRNA CCAT1 has been found to contribute to cell growth and invasion of gastric cancer by sponging miR‐219. 12 CCAT1 was found to promote cell migration via targeting miR‐490 in gastric cancer in a report by Zhou et al. 13 Moreover, in a study by Dou et al., CCAT1 functioned as a competing endogenous RNA to regulate hepatocellular carcinoma progression by sponging miR‐490. 14 Low expression of miR‐490 has been reported in multiple tumors, including prostate cancer, bladder cancer and hepatocellular carcinoma. 15 , 16 , 17 In this study, we highlight that CCAT1 promotes cell proliferation and migration via sponging miR‐490 in NSCLC. These findings will provide more insight into how CCAT1 promotes the metastasis of NSCLC, which will help to develop new therapeutic targets for NSCLC.
Methods
Human samples
Between 2016 and 2018, 45 NSCLC tissues and adjacent normal tissue samples were obtained from patients undergoing lung cancer resection at The Affiliated Hospital of Qingdao University. All the patients in the study had received no radiation or chemotherapy before surgery. The surgically excised NSCLC and normal lung tissue samples of patients were immediately frozen and stored in liquid nitrogen. The experiment was approved by the Ethics Committee of The Affiliated Hospital of Qingdao University and the tissues were collected with the consent of all the patients.
Cell culture and transfection
The NSCLC cells (A549 and H1299) and a finite cell line MRC‐5 were purchased from ATCC. All the cells were cultured in RPMI‐1640 medium (Gibco, Carlsbad, CA, USA) containing 10% FBS (Gibco) at 37°C and 5% CO2.
MiR‐490 mimic and CCAT1 overexpressed plasmid (pEX‐CCAT1) were designed and purchased from GenePharma (Shanghai, China). MiR‐490 inhibitor and CCAT1 knockdown vector (shRNA‐CCAT1) were obtained from RiboBio Company (Guangzhou, China). 2 × 10⁵ H1299 cells were seeded in each well of six‐well plates. The transfection was performed using lipofectamine 2000 (Invitrogen).
Real‐time quantitative polymerase chain reaction (RT‐qPCR)
TRIzol reagent (Invitrogen, Carlsbad, CA, USA) was utilized to isolate total RNAs. After detecting the purity and concentration using NanoDrop ND‐2000 spectrophotometer (NanoDrop Wilmington DE), the RNA was reverse transcribed to cDNA. Next, the SYBR Green PCR Master mix (Thermo Fisher Scientific, USA) was utilized to perform the qPCR on ABI 7300 machine (Applied Biosystems, Foster City, CA, USA). U6 and GAPDH were used as the internal control to normalize miR‐490 and CCAT1 expression. The 2–ΔΔCt method was applied to evaluate CCAT1 and miR‐490 relative expression.
MTT assay
3‐(4,5‐dimethylthazol‐2‐yl)‐2,5‐diphenyltetrazolium bromide (MTT) assay was conducted to measure the cell proliferative ability. H1299 cells were seeded in 96‐well plates, and cultivated for 24, 48, and 72 hours. The absorbance was measured at a wavelength of 490 nm using a multimicroplate test system (POLARstar OPTIMA; BMG Lab technologies, Germany).
Transwell assay
Transwell assay (BD Biosciences, San Jose, CA, USA) was performed to assess cell migration in 24‐well inserts. H1299 cells were suspended in 200 μL serum‐free RPMI 1640 medium, and then seeded on the upper chamber. The lower chamber was filled with 600 μL normal RPMI 1640 medium containing 20% serum. After cultivation for 24 hours, the unmigrated cells were wiped with a cotton swab. Meanwhile, the migrated cells were fixed and then stained using 4% polyformaldehyde and 0.1% crystal violet. The migrated cells number were then counted under a microscope.
Wound healing assay
Transfected cells were grown on 24‐well collagen IV or fibronectin coated plates (BD Biocoat) pretreated with mitomycin C (1 μg/mL) 12 hours before an artificial wound was created at 0 hours. Photographs were taken (x10) at 0 hours and 6 hours. The distances subtracted across the wound at 0 hours and 6 hours were expressed as μm/hour.
Dual luciferase reporter gene assay
Dual luciferase reporter gene assay was utilized to confirm the relationship between CCAT1 and miR‐490. The wild‐type or mutant CCAT1 and miR‐490 mimic were cotransfected in H1299 cells. After transfection for 48 hours, the luciferase activity was measured using the dual luciferase reporter assay system (Promega, Madison, WI, USA).
Statistical analysis
The comparison between two or multiple groups were performed using the two‐tailed unpaired student's t‐test or post hoc Tukey HSD test. The linear correlations between two variables were measured using Pearson's correlation coefficient (r).
Results
CCAT1 overexpressed in NSCLC tissues and cells
To detect the functions of CCAT1 in human NSCLC, quantitative real‐time PCR (qRT‐PCR) analysis was utilized to measure CCAT1 expression in 51 pairs of human NSCLC tissues and corresponding adjacent normal tissues. CCAT1 was found to be overexpressed in NSCLC tissues versus the adjacent normal tissues (P < 0.05) (Fig 1a). Similarly, CCAT1 expression was also evaluated in two cell lines, A549 and H1299, and a normal cell line MRC‐5. We discovered that CCAT1 expression was higher in NSCLC cells than that of MRC‐5 (P < 0.05) (Fig 1b).
Figure 1.
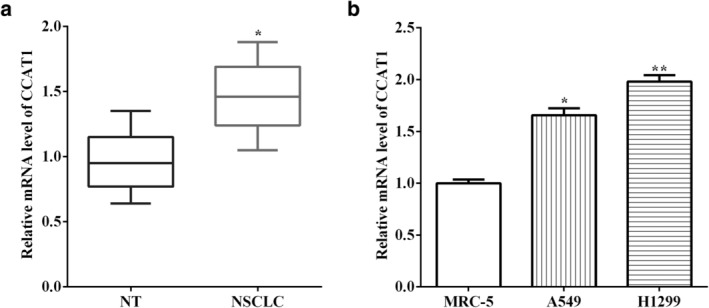
CCAT1 is overexpressed in NSCLC tissues and cells (a) CCAT1 was overexpressed in NSCLC tissues versus adjacent normal tissues. (b) CCAT1 expression was also evaluated in two cell lines, A549 and H1299, and a normal cell MRC‐5.
LncRNA CCAT1 depletion attenuated proliferation of NSCLC in vitro and in vivo
To clarify the role of CCAT1 in NSCLC cells, CCAT1 expression was assessed after transfection with overexpressed CCAT1 or silencing of CCAT1 in H1299 cells (P < 0.05) (Fig 2a). Cell proliferation was measured by an MTT assay. Transfection of pEX‐CCAT1 promoted cell proliferation, whereas cell proliferation was inhibited by knocking down CCAT1 (P < 0.05) (Fig 2b). In addition, H1299 cells stably transfected with shRNA‐CCAT1 and a negative control were subcutaneously injected into nude mice, and cultivated for 26 days. The length and width of the tumors were measured every three days, and we found that knockdown CCAT1 inhibited tumor volume (P < 0.05) (Fig 2c). After dissection of the mice, the tumor volumes were calculated, and it was found that shENA‐CCAT1 had smaller volumes than the control mice (P < 0.05) (Fig 2d).
Figure 2.
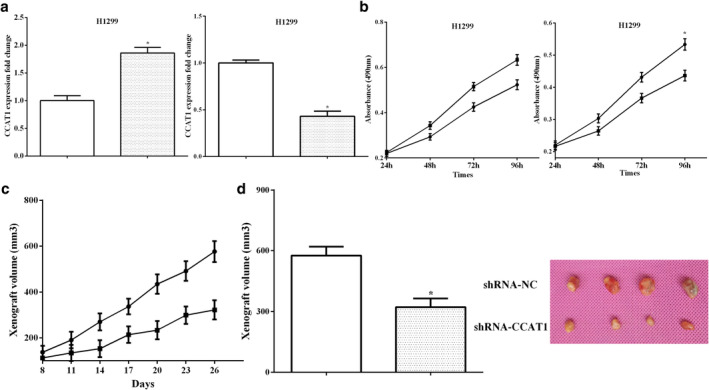
LncRNA CCAT1 depletion attenuated the proliferation of NSCLC in vitro and in vivo (a) CCAT1 expression was assessed after transfection with overexpressed CCAT1 or silencing of CCAT1 in H1299 cells  , pEX‐NC;
  , pEX‐CCAT1;
  , shRNA‐NC;
  , shRNA‐CCAT1. (b) Transfection of pEX‐CCAT1 promoted cell proliferation, whereas cell proliferation was inhibited by knocking down CCAT1
  , pEX‐NC;
  , pEX‐CCAT1;
  , shRNA‐NC;
  , shRNA‐CCAT1. (c) Knockdown CCAT1 inhibited tumor volumes
  , shRNA‐NC;
  , shRNA‐CCAT1. (d) It was found that shENA‐CCAT1 had smaller volumes than the control mice
  , shRNA‐NC;
  , shRNA‐CCAT1.
CCAT1 suppressed cell migration in NSCLC
Wound healing and transwell assays were performed to measure cell migration when altering CCAT1 in NSCLC cells H1299. As expected, compared with the control group, overexpression of CCAT1 promoted cell migration (P < 0.05), whereas H1299 cells transfected with sh‐CCAT1 inhibited cell migration compared with the control group (P < 0.05) (Fig 3a). Similarly, the wound healing method also revealed that cell migration was enhanced by overexpression of CCAT1 (P < 0.05), while knockdown of CCAT1 suppressed cell migration (P < 0.05) (Fig 3b). Taken together, these results indicated that CCAT1 promoted the migration of H1299 cells.
Figure 3.
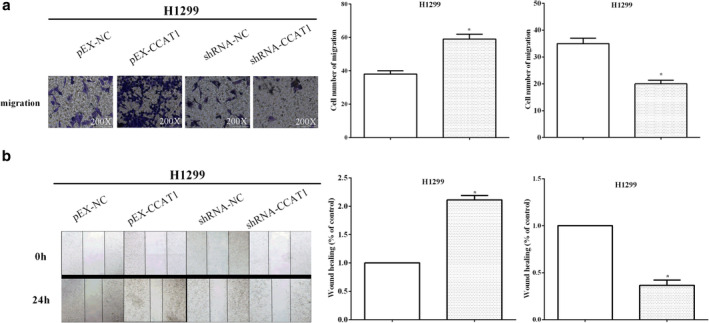
CCAT1 suppressed cell migration in H1299 cells (a) Overexpression of CCAT1 promoted cell migration, whereas transfected sh‐CCAT1 inhibited cell migration  , pEX‐NC;
  , pEX‐CCAT1;
  , shRNA‐NC;
  , shRNA‐CCAT1. (b) ound healing method also revealed that cell migration was changed by altering CCAT1
  , pEX‐NC;
  , pEX‐CCAT1;
  , shRNA‐NC;
  , shRNA‐CCAT1.
To further confirm that CCAT1 regulated NSCLC cell progression, we also used A549 cells to perform cell functional experiments. First, CCAT1 was upregulated (P < 0.05) or downregulated (P < 0.05) in A549 cells by transfecting pEX‐CCAT1 or shRNA‐CCAT1 (Fig 4a). MTT and transwell assays were then performed to measure cell proliferative and migratory abilities. Similar to the H1299 cell results, we found that overexpression of CCAT1 promoted cell proliferation (P < 0.05) and migration (P < 0.05) in A549 cells. However, silencing of CCAT1 inhibited cell proliferation (P < 0.05) and migration (P < 0.05) in A549 cells (Fig 4b and c). The results confirm that CCAT1 promoted proliferation and migration in both H1299 and A549 cells.
Figure 4.
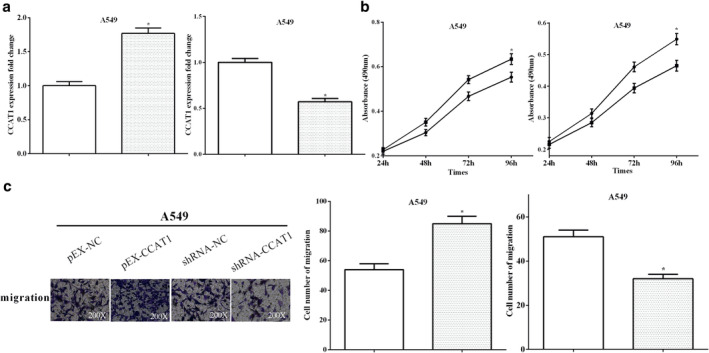
CCAT1 suppressed cell proliferation and migration in A549 cells (a) pEX‐CCAT1 or shRNA‐CCAT1 were used to overexpress or knockdown CCAT1 in A549 cells  , pEX‐NC;
  , pEX‐CCAT1;
  , shRNA‐NC;
  , shRNA‐CCAT1. (b) Transfection of pEX‐CCAT1 enhanced cell proliferation, while transfection of shRNA‐CCAT1 inhibited cell proliferation in A549 cells
  , pEX‐NC;
  , pEX‐CCAT1;
  , shRNA‐NC;
  , shRNA‐CCAT1. (c) Cell migration was enhanced by transfecting pEX‐CCAT1, but was suppressed by transfecting shRNA‐CCAT1 in A549 cells
  , pEX‐NC;
  , pEX‐CCAT1;
  , shRNA‐NC;
  , shRNA‐CCAT1.
CCAT1 functioned as miR‐490 sponge and regulated its expression in H1299 cells
It has been reported that CCAT1 acts as a carcinogenic lncRNA promoting the proliferation and invasion of NSCLC cells. LncRNA can be utilized as a ceRNA to regulate the expression of miRNA and cell biological function. StarBase was utilized to predict that miR‐490 contains binding sequences for CCAT1, and dual luciferase reporter assay was performed to verify CCAT1 binding to miR‐490 (Fig 5a). We determined that miR‐490 mimic decreased the luciferase activity of wild type CCAT1 compared with the control (P < 0.05). However, there was no difference in luciferase activity between miR‐490 mimic + mutant CCAT1 and miR‐490 mimic + mutant CCAT1 in H1299 cells (P > 0.05) (Fig 5b). Real‐time quantitative PCR was utilized to calculate the levels of miR‐490 after altering CCAT1 in H1299 cells. We found that miR‐490 was downregulated after transfection with pEX‐CCAT1 vectors (P < 0.05), and that it was upregulated after silencing CCAT1 in H1299 cells (P < 0.05) (Fig 5c).
Figure 5.
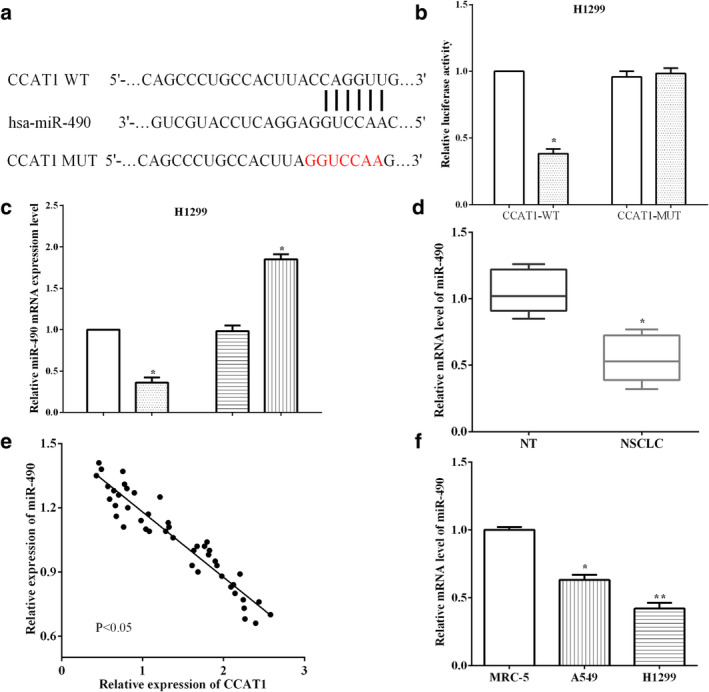
CCAT1 functioned as a miR‐490 sponge and regulated its expression in H1299 cells (a) StarBase was utilized to predict that miR‐490 contains binding sequences for CCAT1. (b) MiR‐490 mimic decreased luciferase activity of wild‐type CCAT1 compared with the control  , NC;
, NC;  , miR‐490 mimic. (c) MiR‐490 was downregulated after being transfected with pEX‐CCAT1 vectors, and upregulated after silencing of CCAT1 in H1299 cells
  , pEX‐NC;
  , pEX‐CCAT1;
  , shRNA‐NC;
  , shRNA‐CCAT1. (d) MiR‐490 level was lower in cancer tissue specimens than normal tissue samples. (e) CCAT1 had negative connection with miR‐490. (f) There was low expression of MiR‐490 in H1299 and A549 cells versus normal cells MRC‐5.
To explore the function of miR‐490 in NSCLC, miR‐490 expression was assessed in tissues and cells. MiR‐490 level was found to be lower in cancer tissue specimens than normal tissue samples (P < 0.05) (Fig 5d). The connection between CCAT1 and miR‐490 expression was calculated in NSCLC tissues, and we discovered that CCAT1 had a negative connection with miR‐490 (P < 0.05) (Fig 5e). miR‐490 expression in cells was also evaluated, and we found that there was lower expression of miR‐490 in H1299 and A549 cells versus normal cells MRC‐5 (P < 0.05) (Fig 5f).
MiR‐490 suppressed proliferation and migration in H1299 cells
RT‐qPCR showed that miR‐490 mimic transfection promoted miR‐490 expression in H1299 cells (P < 0.05) (Fig 6a). MTT and transwell assays were utilized to evaluate cell proliferation and migration, and as expected, miR‐490 impaired the proliferation of H1299 cells after transfection with miR‐490 mimic (P < 0.05) (Fig 6b). The number of migrated cells was also reduced when miR‐490 was overexpressed in H1299 cells (P < 0.05) (Fig 6c). All the findings indicate that miR‐490 inhibited cell proliferation and migration in H1299 cells.
Figure 6.
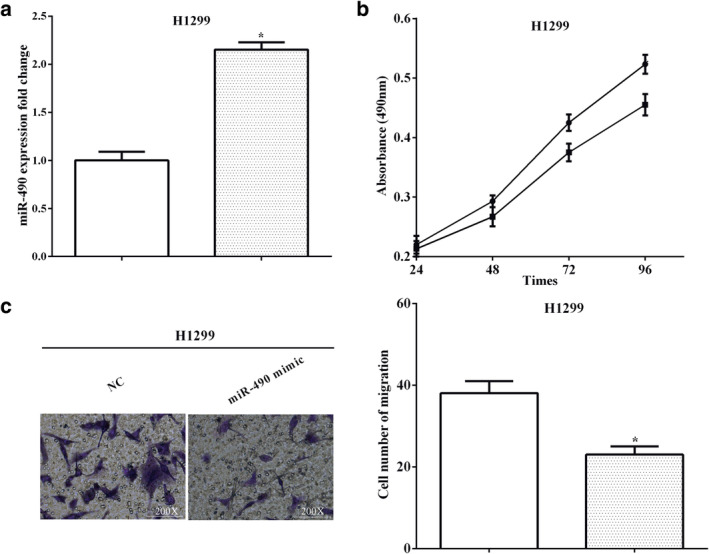
MiR‐490 suppressed proliferation and migration in H1299 cells (a) RT‐qPCR showed that miR‐490 mimic transfection promoted miR‐490 expression in H1299 cells  , NC;
, NC;  , miR‐490 mimic. (b) MiR‐490 impaired the proliferation of H1299 cells after transfection with miR‐490 mimic
  , NC;
, NC;  , miR‐490 mimic. (c) The number of migrated cells was also reduced when miR‐490 was overexpressed in H1299 cells
  , NC;
, NC;  , miR‐490 mimic.
MiR‐490 partially restored the promotion of CCAT1 on cell proliferation and migration
Because we found that CCAT1 reduced miR‐490 expression, we sought to assess the effect of miR‐490 on CCAT1‐mediated NSCLC cells. MiR‐490 mimic and shRNA‐CCAT1 were cotransfected into H1299 cells (P < 0.05) (Fig 7a). MTT assay indicated that compared to transfection with shRNA‐CCAT1 alone, transfection of miR‐490 mimics and shRNA‐CCAT1 significantly reduced the proliferation of NSCLC cells (P < 0.05) (Fig 7b). Transwell assay produced similar results, and miR‐490 mimic and shRNA‐CCAT1 cotransfected into cells showed lower migration compared with transfection of shRNA‐CCAT1 alone (P < 0.05) (Fig 7c).
Figure 7.
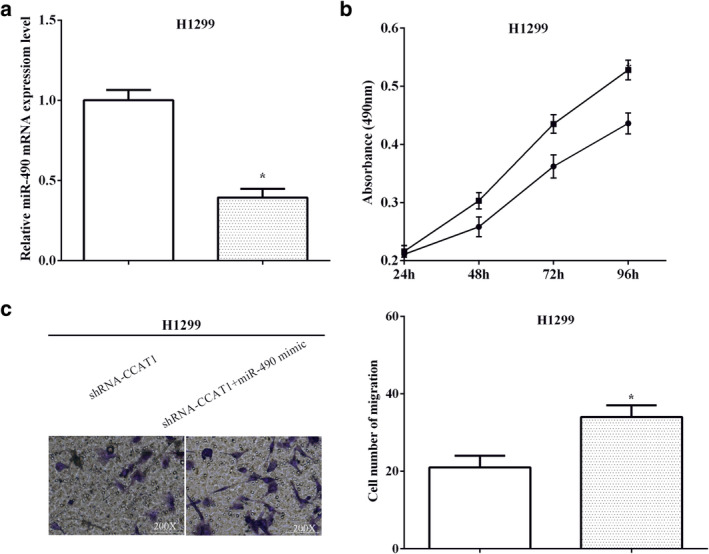
MiR‐490 partially restored the promotion of CCAT1 on cell proliferation and migration (a) MiR‐490 mimic and shRNA‐CCAT1 were cotransfected into H1299 cells  , shRNA‐CCAT1;
  , shRNA‐CCAT1+miR‐490 mimic. (b) Transfection of miR‐490 mimics and shRNA‐CCAT1 significantly reduced the proliferation of NSCLC cells
  , shRNA‐CCAT1;
  , shRNA‐CCAT1+miR‐490 mimic. (c) MiR‐490 mimic and shRNA‐CCAT1 cotransfected into cells showed lower migration compared with transfection of shRNA‐CCAT1 alone , shRNA‐CCAT1; , shRNA‐CCAT1+miR‐490 mimic.
Discussion
LncRNAs have been widely reported to contribute to the physiological processes of tumors. LncRNA CCAT1 has been reported to act as a biomarker for cell proliferation in esophageal cancer and prostate cancer. 18 , 19 Recent studies have shown that the expression of lncRNA CCAT1 is increased in multiple types of cancers. In this study, we discovered that CCAT1 expression was higher in NSCLC tissue specimens than normal tissue specimens. Similarly, CCAT1 was also upregulated in NSCLC cells A549 and H1299 versus normal cells MRC‐5. Consistent with the findings of previous studies, we found that upregulation of CCAT1 promoted cell proliferation, and knockdown CCAT1 suppressed cell proliferation in vitro and in vivo. Moreover, it has been reported that CCAT1 accelerates cell migration in cervical cancer and bladder cancer. 20 , 21 In this study, we found that CCAT1 promoted the migration of H1299 and A549 cells. These findings indicate that CCAT1 may act as an oncogene, thus contributing to NSCLC progression.
There is increasing evidence that lncRNA might play a competitive endogenous RNA (ceRNA) role, often interacting with miRNAs and mutually regulating expression of each other. 22 CCAT1 has been reported to function as a ceRNA of several miRNAs, including miR‐218, miR‐181, miR‐30c and miR‐185 in a number of studies. 23 , 24 , 25 , 26 CCAT1 has also been found to sponge miR‐490 to enhance TGFβ1‐induced EMT of ovarian cancer cells. 27 In this study, miR‐490 was determined to directly bind to CCAT1 which was confirmed by luciferase reporter assay. The expression of miR‐490 was downregulated after overexpressing CCAT1, and enhanced by silencing CCAT1. There was low expression of MiR‐490 in NSCLC tissues and cells versus corresponding tissues and normal cells. MiR‐490 has a negative correlation with CCAT1 in NSCLC tissues, which is consistent with the findings of Zhao et al. in their study on glioma. 28 Overexpression of miR‐490 impaired H1299 cell viability and migration. In addition, miR‐490 partially restored the inhibitory effect of knockdown CCAT1 on cell viability and migration. All the findings in this study demonstrated that CCAT1 affected tumor progression by sponging miR‐490.
In conclusion, we determined that LncRNA CCAT1 enhances the proliferation and metastasis of NSCLC cells through sponging miR‐490. However, other possible mechanisms leading to CCAT1‐mediated NSCLC cell metastasis should be studied in the future. Our findings revealed that CCAT1 promotes cancer metastasis by regulating miR‐490 and facilitates the development of effective therapies for NSCLC.
Disclosure
The authors confirm that there are no conflicts of interest.
References
- 1. Bray F, Ferlay J, Soerjomataram I, Siegel RL, Torre LA, Jemal A. Global cancer statistics 2018: GLOBOCAN estimates of incidence and mortality worldwide for 36 cancers in 185 countries. CA Cancer J Clin 2018; 68 (6): 394–424. [DOI] [PubMed] [Google Scholar]
- 2. Nieder C, Norum J. Early palliative care in patients with metastatic non‐small cell lung cancer. Ann Palliat Med 2012; 1 (1): 84–6. [DOI] [PubMed] [Google Scholar]
- 3. Ulitsky I, Bartel DP. lincRNAs Genomics, evolution and mechanisms. Cell 2013; 154 (1): 26–46. [DOI] [PMC free article] [PubMed] [Google Scholar]
- 4. Wang KC, Chang HY. Molecular mechanisms of long noncoding RNAs. Mol Cell 2011; 43 (6): 904–14. [DOI] [PMC free article] [PubMed] [Google Scholar]
- 5. He RZ, Luo DX, Mo YY. Emerging roles of lncRNAs in the post‐transcriptional regulation in cancer. Genes Dis 2019; 6 (1): 6–15. [DOI] [PMC free article] [PubMed] [Google Scholar]
- 6. Chen S, Liu Y, Wang Y et al LncRNA CCAT1 promotes colorectal cancer tumorigenesis via a miR‐181b‐5p/TUSC3 axis. Oncotargets 2019; 12: 9215–25. [DOI] [PMC free article] [PubMed] [Google Scholar]
- 7. Tang T, Guo C, Xia T et al LncCCAT1 promotes breast cancer stem cell function through activating WNT/beta‐catenin signaling. Theranostics 2019; 9 (24): 7384–402. [DOI] [PMC free article] [PubMed] [Google Scholar]
- 8. Liu Z, Ma C, Tang X et al The reciprocal interaction between LncRNA CCAT1 and miR‐375‐3p contribute to the downregulation of IRF5 gene expression by solasonine in HepG2 human hepatocellular carcinoma cells. Front Oncol 2019; 9: 1081. [DOI] [PMC free article] [PubMed] [Google Scholar]
- 9. Liu Z, Chen Q, Hann SS. The functions and oncogenic roles of CCAT1 in human cancer. Biomed Pharmacother 2019; 115: 108943. [DOI] [PubMed] [Google Scholar]
- 10. Li N, Jiang K, Fang LP et al Knockdown of long noncoding RNA CCAT1 inhibits cell growth, invasion and peritoneal metastasis via downregulation of Bmi‐1 in gastric cancer. Neoplasma 2018; 65 (5): 736–44. [DOI] [PubMed] [Google Scholar]
- 11. Sun W, Lan X, Zhang H et al NEAT1_2 functions as a competing endogenous RNA to regulate ATAD2 expression by sponging microRNA‐106b‐5p in papillary thyroid cancer. Cell Death Dis 2018; 9 (3): 380. [DOI] [PMC free article] [PubMed] [Google Scholar]
- 12. Li Y, Zhu G, Ma Y et al LncRNA CCAT1 contributes to the growth and invasion of gastric cancer via targeting miR‐219‐1. J Cell Biochem 2017. [DOI] [PubMed] [Google Scholar]
- 13. Zhou B, Wang Y, Jiang J et al The long noncoding RNA colon cancer‐associated transcript‐1/miR‐490 axis regulates gastric cancer cell migration by targeting hnRNPA1. IUBMB Life 2016; 68 (3): 201–10. [DOI] [PubMed] [Google Scholar]
- 14. Dou C, Sun L, Jin X, Han M, Zhang B, Li T. Long non‐coding RNA colon cancer‐associated transcript 1 functions as a competing endogenous RNA to regulate cyclin‐dependent kinase 1 expression by sponging miR‐490‐3p in hepatocellular carcinoma progression. Tumour Biol 2017; 39 (4): 1–9. [DOI] [PubMed] [Google Scholar]
- 15. Hu Y, Hong Z, Cheng C, Xu J. The effect of the overexpression of miR‐490 on the biological function of prostate cancer cell PC‐3. J BUON 2019; 24 (3): 1186–93. [PubMed] [Google Scholar]
- 16. Fan H, Zhang YS. miR‐490‐3p modulates the progression of prostate cancer through regulating histone deacetylase 2. Eur Rev Med Pharmacol Sci 2019; 23 (2): 539–46. [DOI] [PubMed] [Google Scholar]
- 17. Fang ZQ, Li MC, Zhang YQ, Liu XG. MiR‐490‐5p inhibits the metastasis of hepatocellular carcinoma by down‐regulating E2F2 and ECT2. J Cell Biochem 2018; 119 (10): 8317–24. [DOI] [PubMed] [Google Scholar]
- 18. Hu M, Zhang Q, Tian XH et al lncRNA CCAT1 is a biomarker for the proliferation and drug resistance of esophageal cancer via the miR‐143/PLK1/BUBR1 axis. Mol Carcinogen 2019; 58 (12): 2207–17. [DOI] [PubMed] [Google Scholar]
- 19. You Z, Liu C, Wang C et al LncRNA CCAT1 promotes prostate cancer cell proliferation by interacting with DDX5 and MIR‐28‐5P. Mol Cancer Ther 2019; 18 (12): 2469–79. [DOI] [PubMed] [Google Scholar]
- 20. Shen H, Wang L, Xiong J et al Long non‐coding RNA CCAT1 promotes cervical cancer cell proliferation and invasion by regulating the miR‐181a‐5p/MMP14 axis. Cell Cycle 2019; 18 (10): 1110–21. [DOI] [PMC free article] [PubMed] [Google Scholar]
- 21. Zhang C, Wang W, Lin J, Xiao J, Tian Y. lncRNA CCAT1 promotes bladder cancer cell proliferation, migration and invasion. Int Braz J Urol 2019; 45 (3): 549–59. [DOI] [PMC free article] [PubMed] [Google Scholar]
- 22. Song C, Zhang J, Liu Y et al Construction and analysis of cardiac hypertrophy‐associated lncRNA‐mRNA network based on competitive endogenous RNA reveal functional lncRNAs in cardiac hypertrophy. Oncotarget 2016; 7 (10): 10827–40. [DOI] [PMC free article] [PubMed] [Google Scholar]
- 23. Han C, Li X, Fan Q, Liu G, Yin J. CCAT1 promotes triple‐negative breast cancer progression by suppressing miR‐218/ZFX signaling. Aging 2019; 11 (14): 4858–75. [DOI] [PMC free article] [PubMed] [Google Scholar]
- 24. Guo J, Ma Y, Peng X et al LncRNA CCAT1 promotes autophagy via regulating ATG7 by sponging miR‐181 in hepatocellular carcinoma. J Cell Biochem 2019; 120 (10): 17975–83. [DOI] [PubMed] [Google Scholar]
- 25. Zhang J, Cai M, Jiang D et al Upregulated LncRNA‐CCAT1 promotes hepatocellular carcinoma progression by functioning as miR‐30c‐2‐3p sponge. Cell Biochem Funct 2019; 37 (2): 84–92. [DOI] [PubMed] [Google Scholar]
- 26. Ma D, Cao Y, Wang Z et al CCAT1 lncRNA promotes inflammatory bowel disease malignancy by destroying intestinal barrier via downregulating miR‐185‐3p. Inflamm Bowel Dis 2019; 25 (5): 862–74. [DOI] [PubMed] [Google Scholar]
- 27. Mu Y, Li N, Cui YL. The lncRNA CCAT1 upregulates TGFbetaR1 via sponging miR‐490‐3p to promote TGFbeta1‐induced EMT of ovarian cancer cells. Cancer Cell Int 2018; 18: 145. [DOI] [PMC free article] [PubMed] [Google Scholar]
- 28. Zhao L, Tang X, Luo R, Duan J, Wang Y, Yang B. MicroRNA‐490‐5P targets CCND1 to suppress cellular proliferation in glioma cells and tissue through cell cycle arrest. Curr Neurovasc Res 2018; 15 (3): 246–55. [DOI] [PubMed] [Google Scholar]