

Abstract
The RAF family kinases function in the RAS-ERK pathway to transmit signals from activated RAS to the downstream kinases MEK and ERK. This pathway regulates cell proliferation, differentiation, and survival, enabling mutations in RAS and RAF to act as potent drivers of human cancers. Drugs targeting the prevalent oncogenic mutant BRAF(V600E) have shown great efficacy in the clinic, but long-term effectiveness is limited by resistance mechanisms that often exploit the dimerization-dependent process by which RAF kinases are activated. Here, we investigated a proteolysis targeting chimera (PROTAC) approach to BRAF inhibition. The most effective PROTAC termed P4B displayed superior specificity and inhibitory properties relative to non-PROTAC controls in BRAF(V600E) cell lines. In addition, P4B displayed utility in cell lines harboring alternate BRAF mutations that impart resistance to conventional BRAF inhibitors. This work provides a proof of concept for a substitute to conventional chemical inhibition to therapeutically constrain oncogenic BRAF.
Introduction:
The RAF family kinases are key regulators of cell proliferation, growth, differentiation, and survival. The family functions downstream of mitogen receptors, such as EGFR, and the small GTPase RAS to relay signals through a kinase-activation cascade involving the downstream MEK and ERK kinases (collectively known as the RAS-RAF-MEK-ERK or RAS-ERK pathway). Not unexpectedly, the dysregulation of pathway signaling, commonly through activating mutations in RAS and RAF, is a potent driver of cancer development and progression (reviewed in 1,2,3).
Inhibitors of the prevalent BRAF(V600E) cancer-causing mutant, including dabrafenib, vemurafenib, and encorafenib show remarkable utility in the clinic. However, these inhibitors show limited activity against tumours driven by lesions in upstream pathway components such as RAS and EGFR despite that they still signal through the RAS-ERK pathway to promote tumour growth. In addition, the progression-free period in responding patients carrying the BRAF(V600E) allele is typically short lived (6 to 8 months) due to acquired resistance mechanisms frequently involving the activation of RAS or upstream growth factor receptors 4 or by further mutations in BRAF itself 5,6. These mechanisms can reactivate the RAS-ERK pathway upon which the tumors have grown dependent (reviewed in 7,8).
Many of the limitations of current RAF inhibitors are underpinned by the mechanism by which RAF kinases are normally activated; specifically by the adoption of a well-defined side-to-side dimer configuration of their kinase domain, which serves to allosterically activate protein kinase catalytic function 9,10. Whereas inhibitors that bind to the active site of a RAF kinase are effective at disabling its catalytic output by precluding ATP binding, they are far less effective at preventing RAF dimerization. Indeed, some inhibitors are potent promoters of RAF kinase domain dimerization 11. This druggability defect allows an inhibitor bound RAF kinase to participate in the trans-activation of a partner RAF kinase when saturating levels of inhibitor are not achieved, giving rise to paradoxical pathway activation 12,13,14.
The limitations of current RAF inhibitors provide a rationale for the exploration of alternate therapeutic strategies employing novel inhibitor mechanisms of action (MOA). PROTACs (proteolysis targeting chimeras) are bifunctional molecules that induce the degradation of a target protein by exploiting the cellular ubiquitination machinery 15. PROTACs consist of a chemical tag that binds to a target protein of interest connected through a linker to a second tag that binds to a cellular E3 ubiquitin ligase (reviewed in 16,17). By simultaneous binding to a target and an E3 ligase, the PROTAC stimulates the ubiquitination and subsequent degradation of the target by the 26S proteasome. Here, we sought to generate an effective PROTAC against BRAF(V600E) to determine if this approach would confer advantageous therapeutic characteristics in modulating the pharmacology of the RAF signaling cascade.
Results
PROTAC Synthesis
We synthesized small molecule chimeras involving either of two BRAF binders, namely the FDA approved drug dabrafenib or the preclinical inhibitor BI 882370 18, combined with either of three E3 ubiquitin ligase binders, namely pomalidomide (or its close analogue thalidomide) which engages the CUL4A E3 ligase cereblon 19 (CRBN) or VH032 which engages the CUL2 E3 ligase Von Hippel-Lindau 20,21. We also employed flexible linkers of variable length and composition with two different attachment points in the case of dabrafenib and one attachment point in the case of BI 882370. In total 16 different PROTACs were initially synthesized (see Fig. 1A, Supplementary Table 1 and Supplementary Table 2).
Figure 1∣. Design strategy for BRAF PROTACs.

a, Chemical structures of the precursor molecules used to synthetize BRAF PROTACs (* denotes structural analogues of inhibitors). Sites for chemical ligation are highlighted by circles. b, Chemical structures of P4B and the non-E3 binding control P4BME.
Functional analysis of PROTACs in vitro
We tested all 16 PROTACs and the 3 parental BRAF inhibitor precursors (1–19) for their ability to inhibit BRAF(V600E), BRAF, CRAF and ARAF catalytic function in vitro (Supplementary Table 1). Most candidate PROTACs behaved as potent inhibitors of BRAF(V600E), the primary target of dabrafenib and BI 882370, indicating that our design strategies for linker attachment did not perturb target engagement.
Functional analysis in cells
A375 melanoma cells are homozygous for the BRAF(V600E) mutation (no BRAFWT expression) and thus highly responsive to BI 882370 and dabrafenib. We performed dose response titrations with each PROTAC to assess their ability to down-regulate BRAF(V600E) protein levels (Supplementary Fig. 1,2, and summarized in Supplementary Table 1) and pathway signaling. Only one dabrafenib-based PROTAC (19) reduced BRAF(V600E) levels and then only weakly (~50%) (Supplementary Fig. 2c). In contrast, all BI 882370-based PROTACs showed some effectiveness at reducing BRAF levels and pathway signaling (Supplementary Fig. 1). In particular, the BI 882370-based PROTACs 3 and 4 (denoted P4B and P5B, respectively) bearing linkers with 4 and 5 PEG moieties, respectively, were most effective in terms of target degradation properties. We therefore synthesized negative E3-binding controls for each (20 and 21 denoted P4BME and P5BME, respectively) in which the pomalidomide moiety was methylated at the nitrogen position of the glutarimide ring 19 to abolish CRBN engagement (Fig. 1b).
Comparisons at 100 nM concentration showed that both P4B and P5B reduced BRAF(V600E) protein levels by almost 70%, and this correlated with almost complete repression of pathway signaling. In contrast, P4BME and P5BME failed to reduce BRAF(V600E) protein levels, which correlated with reduced pathway inhibitory activity (Fig. 2a). BI 882370* displayed no effect on BRAF(V600E) levels but an ability to inhibit pathway signalling comparable to P4B and P5B.
Figure 2∣. Functional analysis of BRAF PROTACs in cells.
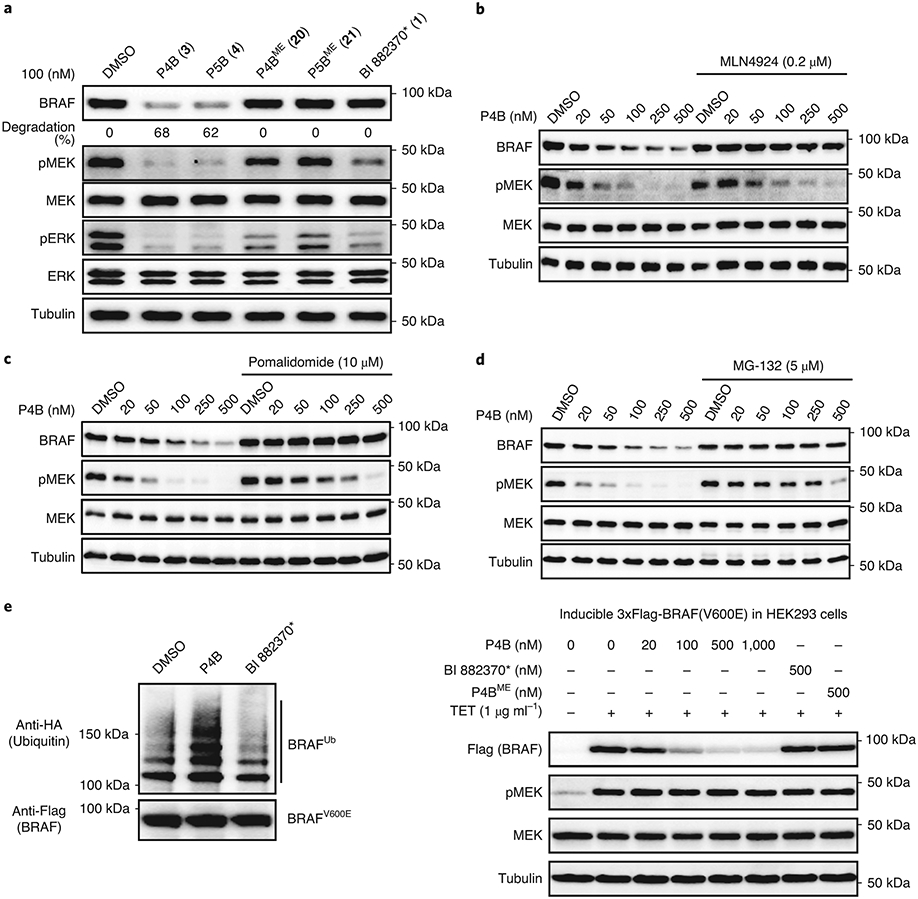
a, P4B and P5B treatment leads to efficient suppression of BRAF protein level and pathway signaling. A375 cells were treated for 24 h with the indicated compounds. Numbers in bracket refer to compound entry in Supplementary Table 1. b-d, Confirmation of a CULIN-based E3 degradation mechanism. Cells were treated for 24 h with increasing doses of P4B, in the absence or presence of neddylation inhibitor MLN4924 (b), pomalidomide (c), MG132 (d). a-d, Lysates were analyzed for BRAF and downstream kinases by immunoblot, tubulin serves as a loading control. e, P4B induced ubiquitination of BRAF in cells. (left panel) HEK293 cells stably expressing 3X-Flag-BRAF(V600E) and transiently expressing HA-ubiquitin were treated for 4 hours with 0.5 μM P4B or BI 882370* and 5 μM MG132 and PR-619. Anti-Flag pulldowns were performed on whole-cell extracts and samples were analyzed by anti-HA and anti-Flag immunoblot. (right panel) Tetracycline-inducible expression of integrated 3X-Flag-BRAF(V600E) in HEK293 cells is sensitive to P4B-induced degradation. Expression of 3X-Flag-BRAF(V600E) was induced for 24 h by the addition of tetracycline. Cells were then treated with the indicated concentrations of P4B, BI 882370* or P4BME for 24 h. Immunoblot analysis was performed on whole cell lysates. Tubulin served as a loading control. Data shown in the figure are representative of minimally two independent experiments.
We then investigated changes to the linker structure of P4B and connectivity to BI 882370* while minimizing changes to length (Supplementary Table 1, compounds 22 to 27). None of the six analogs induced superior degradation relative to P4B, but three (22 - 24) displayed a complete loss of degrader function (Supplementary Fig. 3). As P4B proved the most effective degrader of BRAF(V600E) based on DC50 (the concentration at which 50% of maximal degradation was observed) and Dmax (the maximal level of degradation observed) metrics (Supplementary Table 1), we sought to characterize its mechanism of action in greater detail.
Structure of P4B bound to the BRAF kinase domain
We solved the 3.29 Å X-ray crystal structure of P4B bound to the BRAF kinase domain (See Supplementary Table 3 for data collection and refinement statistics). Only the BI 882370 portion of P4B was ordered (Extended Data Fig. 1a) and as expected engaged the ATP binding pocket of BRAF in a manner highly similar to that of BI 882370 18 (Extended Data Fig. 1b-f). One major difference relates to the conformation of the DFG motif, which is OUT in the BI 882370 co-structure and IN in the P4B co-structure. This difference is likely due to the displacement of the DFG phenylalanine side chain from its IN position by an ordered glucose molecule used as a cryo-protectant for BRAF:BI 882370 co-crystallization (Extended Data Fig. 1b). Supporting the notion that the linker and pomalidomide moieties of P4B did not significantly alter the binding mode of the BI 882370 moiety to the BRAF kinase domain, P4B and P4BME (as well as P5B and P5BME) were as effective as BI 882370* at competitively displacing a fluorescent tracer from the catalytic cleft of BRAF and CRAF (Supplementary Fig. 4a-b).
Validation of P4B mechanism of action
We tested the function of P4B in A375 cells. At the 24 hour time point P4B displayed a Dmax of 82% for BRAF(V600E) with a DC50 of 15 nM (Extended Data Fig. 2a) while Pmd and PEG4-BI (corresponding to P4B without the Pmd moiety) failed to reduce BRAF protein levels. At high concentrations P4B showed reduced suppression of BRAF levels, a common behaviour of PROTACs 22. P4B did not reduce ARAF levels but did appear to slightly reduce CRAF levels (Dmax = 20–45% over multiple experiments) at higher concentrations (DC50 ≅ 1000 nM) (Extended Data Fig. 2b). Similar observations were made in the homozygous BRAF(V600E) cell line SK MEL-28 (Extended Data Fig. 2c). Lastly, P4B had no effect on the level of the RAF family member KSR1 or SRMS, a protein kinase previously identified as an off-target of BI 882370 (Extended Data Fig. 2b) 18.
We investigated the time dependency of P4B on BRAF(V600E) levels (Extended Data Fig. 2d). Maximal degradation of BRAF was achieved at 16 hours, after which a steady state level of ~ 20% BRAF protein was maintained. Inhibition of pathway signaling showed similar kinetics and achieved 100% inhibition at the same 16 hour time point.
To confirm that reduction of BRAF levels by P4B occurred through the expected degradation mechanism, we tested the effect of adding MLN4924 (a CULLIN neddylation inhibitor), free pomalidomide (a competitive binder of Cereblon), or MG-132 (cell-permeable proteasome inhibitor) to our dose response analyses with P4B (Fig. 2b,c,d respectively). Treatments greatly attenuated the ability of P4B to induce BRAF degradation and this correlated with a reduced ability to inhibit pathway signaling. We recapitulated P4B-induced ubiquitination of BRAF by exploiting the stabilizing action of MG132 and the deubiqutinase inhibitor PR619 in HEK293 cells (Fig. 2e), or by in vitro reconstitution of the ubiquitination reaction (Extended Data Fig. 2e).
Next we benchmarked P4B potency against P4BME and BI 882370*. In A375 cells, only P4B reduced BRAF levels and P4B was also more effective at inhibiting pMEK and pERK levels (~ 10-fold difference in IC50) (Fig. 3a,b). We next measured BRAF levels at two time points; at 1 hour, at which time no BRAF destruction was achieved, and at 24 hours at which time maximal BRAF destruction was achieved. At 1 hour, all three inhibitors displayed similar potencies on pathway inhibition (Supplementary Fig. 5a; Supplementary Table 4) indicating similar abilities to enter the cell and engage BRAF to inhibit enzyme activity. However, at 24 hours P4B demonstrated greater pathway inhibition than either P4BME or BI 882370* (Supplementary Fig. 5b; Supplementary Table 4). This result highlighted the added benefit of inducing BRAF degradation versus solely inhibiting enzyme activity.
Figure 3∣. Benchmark comparisons of PROTAC function.

a, Immunoblot analysis of P4B and P4BME function in A375 cells after 24h treatment at the indicated concentrations. b, Immunoblot analysis of P4B and BI 882370* function in A375 cells after 24h treatment at the indicated concentrations. Data shown in a and b are representative of minimally two independent experiments. c, Dose-dependent inhibition of proliferation (left panel) and phospho-ERK (right panel) following P4B, P4BME and BI 882370* treatment in A375 cell line. Data shown are representatives of minimally three independent experiments. Data represent mean values ± s.d.
We next tested the effect of P4B, P4BME and BI 882370* on cellular proliferation, monitoring at the same time effects on pERK levels by AlphaLISA. P4B demonstrated superior antiproliferative activity relative to P4BME and BI 882370* against homozygous A375 cells (Fig. 3c; Supplementary Table 4) and superior or similar activity respectively against heterozygous COLO-205 and RKO cells (BRAF(WT/V600E)) and triploid HT-29 cells (BRAF(WT/V600E/V600E)) (Extended Data Fig. 3a-c). However, less efficient BRAF degradation was observed in the COLO-205 and HT-29 cells relative to A375 cells (Extended Data Fig. 4a,b), suggesting possible resistance of the BRAF(WT) protein to degradation.
We next assessed compound activity in MeWo cell line that is homozygous for BRAF(WT) but harbours a NF1 loss of function allele, leading to hyperactive RAS signaling 23. P4B had no effect on cellular proliferation and this correlated with greatly reduced ability to degrade BRAF (Extended Data Fig. 3d, 4c, respectively). In this context, P4B, P4BME and BI 882370* induced paradoxical ERK activation. Considering that P4B was similarly potent at inhibiting the enzymatic activity of BRAF(WT) and BRAF(V600E) in vitro (IC50 = 58 vs 12 nM; Supplementary Table 1), these results highlight the surprising degradation selectivity of P4B for BRAF(V600E) in cells. Furthermore, the results demonstrate that the inability to degrade BRAF(WT) protein is not an impediment to the effectiveness of P4B in cells bearing mixed BRAF(WT) and BRAF(V600E) alleles.
Analysis of durability of response in cells
To investigate the durability of cellular response to P4B treatment, we conducted wash out analyses after treating cells for 22 hours with either P4B (100 nM), P4BME (500 nM) or BI 882370* (500 nM) (Extended Data Fig. 4d). At time zero post washout, all three inhibitors displayed near complete inhibition of pathway signaling as measured by pMEK and pERK levels. As expected, only P4B reduced BRAF levels. At further time points, a faster recovery of pathway signaling was observed for P4BME relative to P4B, which paralleled the slow recovery in BRAF levels. Interestingly, an even slower recovery of pathway signaling was observed for the washout of BI 882370*. This behaviour was noted previously for BI 882370* relative to dabrafenib and attributed to potentially slow binding kinetics 18. However, SPR analysis revealed similar binding kinetics for BI 882370*, P4B, the dabrafenib analog 17 and the ineffective dabrafenib-based PROTAC 19 (Supplementary Fig. 6) suggesting an alternate mechanism.
P4B function in cells with alternate pathway mutations
P4B displayed robust inhibitory activity on the proliferation of the melanoma cell line WM266–4 harbouring the heterozygous BRAF(V600D) driver mutation (Fig. 4a, Extended Data Fig. 5a, Supplementary Table 4). This antiproliferative activity correlated with a potent induction of BRAF degradation (Dmax = 76 %; DC50 = 15 nM) and enhanced ability to repress pathway signaling relative to P4BME and BI 882370*.
Figure 4∣. Identification of BRAF-driven tumor cell lines sensitive to P4B.

a-c, Dose-dependent inhibition of proliferation (left panel) and phospho-ERK (right panel) following P4B, P4BME and BI 882370* treatment in WM266-4 (a), NCI-H1666 (b) and A375-VR (c) cell lines. Data shown are representative of minimally three independent experiments performed in technical duplicate. Data represent mean values ± s.d.
P4B had a detectable but weak inhibitory effect at high concentrations on the proliferation of the NCI-H1666 cell line harbouring the heterozygous BRAF(G466V) mutation (Fig. 4b, Extended Data Fig. 5b) but no effect on the NCI-H508 and NCI-H1755 cell lines harbouring the heterozygous BRAF(G596R) and BRAF(G469A) mutations, respectively (Extended Data Fig. 3e,f). In the NCI-H1666 cell line, the antiproliferative effect correlated with a detectable but shifted ability to repress pathway signaling (pERK levels) compared to the A375 cell line, and a weak ability (Dmax ≤ 30%) to reduce BRAF levels (Fig. 4b, Extended Data Fig. 5b,). In NCI-H508, NCI-H1755 and NCI-H1666 cell lines, BI 882370* behaved more similarly to P4B than P4BME, despite its inability to reduce BRAF levels.
Tandem duplication of the kinase domain in one allele imparts inhibitor resistance to tumors bearing the homozygous BRAF(V600E) mutation 5. P4B displayed greater inhibitory effect on cell proliferation and pathway signaling than P4BME in a vemurafenib-resistant A375 cell line harbouring this lesion (Fig. 4c and Supplementary Table 4). Analysis of protein levels revealed that both the BRAF(V600E) single kinase domain protein (90 kDa band) and the double kinase domain protein (~130 kDa) were sensitive to degradation by P4B (Extended Data Fig. 5c). In contrast to the NCI-H1666 cell line, BI 882370* behaved more similar to P4BME than P4B in this cellular context.
We next tested the HCT116 cell line harbouring the KRAS(G13D) driver mutation (with BRAF(WT) alleles) that was shown previously to be resistant to treatment with BI 882370 18. P4B showed no ability to reduce BRAF levels, similar to P4BME and BI 882370* (Extended Data Fig. 4e), and all three compounds displayed the characteristic paradoxical pathway activation properties common to BRAF inhibitors in RAS mutant cellular contexts. Consistent with their inability to repress pERK levels, P4B, P4BME and BI 882370* were equally ineffective at inhibiting cell proliferation and pathway signaling (Extended Data Fig. 3g). Similar trends of behavior were observed using SK-MEL-2 melanoma cells harbouring the NRAS(Q61R) mutation (Extended Data Fig. 3h).
Lastly, we tested two cell lines with mixed mutation backgrounds, namely MDA-MB-231 (BRAF(G464V/WT)/KRAS(G13D)) and NCI-H2087 (BRAF(L597V/WT)/KRAS(Q61K)). In both contexts, P4B was not more effective than P4BME or BI 882370* in inhibiting pathway signaling or proliferation (Extended Data Fig. 3i,j). Collectively, these profiling experiments suggest that a PROTAC approach directed at BRAF could have added utility relative to conventional enzyme inhibition in some but not all BRAF mutant tumors (e.g. BRAF(V600E), BRAF(V600D), kinase domain duplication, and potentially BRAF(G466V)) and not in RAS mutant tumors.
Activated RAS blocks P4B degradation of BRAFV600E
The development of clinical resistance to inhibitors in BRAF(V600E) driven cancers can involve the upregulation of RAS function, which acts by driving monomer drug-responsive BRAF(V600E) protein into a drug-unresponsive dimeric state with CRAF as a partner 24,25. To test if activated RAS would confer an inherently sensitive cell line with resistance to P4B, we transduced the A375 cell line with lentiviruses expressing oncogenic H-, K- and NRAS isoforms harboring G12V alleles (Extended Data Fig. 6a). Transduction caused marked resistance to P4B at the level of cellular proliferation, pERK signalling, and BRAF degradation (Fig. 5, Extended Data Fig. 6b).
Figure 5∣. Activated RAS confers BRAF(V600E) resistance to degradation by P4B.

a-e, Dose-dependent inhibition of proliferation (left panel) and phospho-ERK (right panel) following treatment with the indicated inhibitors in A375 cell lines transduced with the indicated lentivirus. Data shown are representative of 3 or more independent experiments performed in duplicate.
Conversely, we tested if elimination of all RAS isoforms would confer P4B sensitivity to an inherently insensitive cell line bearing WT BRAF alleles. We employed a conditional Ras knockout mouse embryo fibroblast cell line of the following genotype: Hras−/−, Nras−/−, Kraslox/lox (denoted ‘KrasWT-lox/lox’), that allows removal of the Kras gene by 4-hydroxytamoxifen (4-OHT) treatment (referred to as ‘RASless’ after long-term 4-OHT incubation) 26. We first confirmed disappearance of RAS proteins by western blot after 18 days of 4-OHT treatment (Extended Data Fig. 6c). In both 4-OHT treated and untreated MEF cell lines, P4B treatment had no effect on BRAF levels or cellular proliferation (Extended Data Fig. 6d,e). Thus, resistance of BRAF(WT) protein to degradation by P4B is unrelated to RAS activity.
Given that the V600E mutation confers sensitivity to P4B-mediated BRAF degradation, we used RASless MEFs, whose proliferation potential was rescued by stable expression of human BRAF(V600E) (noted as RASless + BRAF(V600E)) to profile P4B and P4BME. Similar to A375 and WM266–4 cells, P4B was more potent than P4BME at inhibiting proliferation and pERK and at reducing BRAF(V600E) levels (Extended Data Fig. 6f,g). These findings highlight the fact that RAS activity is a contributing factor to resistance of cells to P4B but not the only mechanism by which BRAF(WT) resists degradation.
Ternary complex formation in vitro and in cells
To assess if sensitivity of BRAF mutants to P4B was due to the ability of P4B to selectively promote their interaction with CRBN, we first examined ternary complex formation using a simplified in vitro system with purified kinase domains of BRAF(WT) or BRAF(V600E) and CRBN /DDB1. We used fluorescein-labelled pomalidomide as a binding probe to CRBN (Kd = 227 nM) (Extended Data Fig. 7a). Free pomalidomide was an effective displacer of the probe from CRBN (IC50 = 1.06 μM) and this activity was not affected by the kinase domain of BRAF(WT) or BRAF(V600E), consistent with pomalidomide not binding to either protein (Extended Data Fig. 7b). P4B was also effective at displacing the probe from CRBN (IC50 = 0.9 μM) but its effectiveness was diminished equally by the BRAF(WT) and BRAF(V600E) kinase domains, with an apparent cooperativity factor alpha of 0.38 and 0.35, respectively (defined as αapp = IC50[binary]/ IC50[ternary]) (Extended Data Fig. 7c). Testing of 5 additional PROTACs with, DC50 parameters ranging from 15 to 100 nM, and DMAX parameters ranging from 51 to 84% (Supplementary Table 1) revealed highly similar negative cooperativity parameters comparable to that for P4B (Extended Data Fig. 7d-h).
We next examined the dose dependent ability of P4B to promote ternary complexes with full length RAF kinases and CRBN in cells. Expression of flag-tagged CRBN in the A375 (BRAF(V600E/V600E)) cell line followed by immunoprecipitation with anti-flag resin and immunoblotting revealed robust P4B-induced ternary complexes with BRAF(V600E) (Fig. 6a), an effect only detectable in the presence of MG132 and MLN4924 to prevent BRAF degradation (Extended Data Fig. 8a). Weaker ternary complex formation was detected for ARAF and CRAF, the latter primarily at higher concentrations of P4B. Analysis in the HEK293T cell line (BRAF(WT/WT)) revealed similar results for ARAF and CRAF and a reduced signal for BRAF that was shifted to higher concentrations of P4B (Fig. 6b). Corroborating results were obtained using the SPPIER (Separation of Phases-based Protein IntEraction Reporter) assay 27 (Fig. 6c,d; Extended Data Fig, 8b). Thus the selective effectiveness of P4B degrader function correlates with the ability to promote ternary complexes of full-length target proteins with CRBN in cells.
Figure 6∣. Analysis of ternary complex formation induced by P4B.

a-b, A375 (homozygous BRAF(V600E)) (a) or HEK293T (homozygous BRAF(WT)) (b) cells ectopically expressing flag-tagged CRBN/DDB1 were treated for 5-6 h with P4B, P4BME or BI 882370* at the indicated concentrations. Flag-tagged CRBN was immunoprecipitated using anti-Flag magnetic beads. Lysates and immunoprecipitates were subjected to immunoblot analysis with the indicated antibodies. 5 μM MG132 was included in all treatments to prevent BRAF degradation. Data are representative of minimally two independent experiments.
c-d, Analysis of BRAF-P4B-CRBN ternary complex formation in cells using the Separation of Phases-based Protein Interaction Reporter assay. Ternary complex formation was monitored by quantification of cells with > 3 fluorescent foci. (c) HEK293T cells expressing the BRAF(V600E) reporter were treated with 0.5 μM of the indicated compounds. (d) HEK293T cells expressing BRAF(WT) or BRAF(V600E) were treated with DMSO only or 0.5 μM P4B. Replicate data points are shown as black circles with the mean shown as a horizontal bar. Data are representative of minimally two independent experiments.
e, Competitive displacement of fluorescein-labelled pomalidomide probe from CRBN-DDB1 by P4B with CRBN alone or in the presence of the kinase domains of the indicated proteins. IC50 values were obtained by fitting FP signal using a variable slope - four parameter equation in GraphPad Prism. Data are representative of two independent experiments each performed in triplicate. Data represent mean values ± s.d.
MEK binds to the front face of BRAF 28, which places it in position to sterically impinge on the ability of P4B to induce a ternary complex with BRAF and CRBN/DDB1. Since the BRAFV600E oncogenic mutant is found to interact less strongly with MEK 28, we reasoned that this could contribute to enhanced sensitivity of BRAF(V600E) relative to BRAF(WT) to P4B induced degradation. Consistent with this possibility, addition of MEK to an in vitro binding reaction with purified proteins caused a ~3 fold detrimental shift in ternary complex formation (Fig. 6e). Notably, addition of a MEK(F311S) mutant, which is deficient for binding BRAF 29, had almost no effect on ternary complex formation (Fig. 6e). Thus MEK binding to the kinase domain of BRAF may contribute in part to the relative susceptibility of BRAF(WT) and BRAF(V600E) to P4B induced degradation.
Proteome-wide and transcriptome analysis of P4B function
To probe P4B specificity more broadly, we performed kinome-wide profiling with the broad-spectrum protein kinase inhibitor CTx-0294885 covalently coupled to Sepharose beads30,31, which allowed recovery of ~ 250 protein kinases from A375 cell lysates (Extended Data Fig. 9a). Of these, the majority (157) could be competitively displaced by pre-incubation of free CTx-0294885 in the lysate. In contrast, only 13 and 6 protein kinases (including BRAF) could be displaced by BI 882370* and P4B, respectively. Dose-response profiles for BRAF revealed similar competitive displacement efficiencies for P4B and BI 882370* (Extended Data Fig. 9b). In contrast, P4B was less efficient than BI 882370* at competitively displacing LIMK1, M3K2 (gene MAP3K2), MP2K5 (gene MAP2K5), and RIPK2, suggesting a heightened specificity profile for P4B relative to BI 882370*. Only the protein kinase MK07 (gene MAPK7) appeared to bind preferentially to P4B and not to BI 882370* (Extended Data Fig. 9c), whereas 8 protein kinases appeared to bind preferentially to BI 882370* and not P4B (Extended Data Fig. 9d). Of the latter group, YES1 and LYN kinases were previously identified as off-targets of BI 882370 18.
Proteome-wide analysis of protein levels after 24 hours of P4B treatment (Extended Data Fig. 10a), revealed that out of 7200 detectable proteins in the cell, none were repressed (or enhanced) by greater than the log2 fold change cutoff of +/−1.5 relative to P4BME-treated controls (Extended Data Fig. 10b). Comparison of P4B treated versus DMSO treated cells revealed more significant differences in proteome profiles with 20 proteins repressed and 14 proteins enhanced in P4B relative to DMSO treated cells (Extended Data Fig. 10c). These differences likely reflect the effect of selectively inhibiting the RAS-ERK pathway, which results in perturbations at multiple levels, including transcription.
Lastly, we compared the transcriptome of A375 cells treated with BI 882370*, P4B and P4BME versus cells treated with the MEK inhibitor trametinib, and the structurally distinct BRAF inhibitors, dabrafenib, and vemurafenib (Supplementary Fig. 7a-c). Unsupervised hierarchical clustering of the cross-correlation matrix showed that all RAS-ERK pathway inhibitors display similar transcriptomes (Spearman correlations >0.95; Supplementary Fig. 7b). Analysis of genes differentially expressed in BI 882370*, P4B and P4BME treated A375 cells (see Methods) revealed that BI 882370* altered the most genes (195), and that of the 136 genes altered by P4B, 77% (105) were common with BI 882370* (Supplementary Fig. 7c and Supplementary Table 5). P4BME-treated cells displayed the least changes (49 genes), 92% of which were common with BI 882370*. These results are consistent with a strong molecular concordance in P4B and BI 882370* mechanism of action. Together, these kinase-, proteome- and transcriptome-wide analyses indicate that the added benefits of incorporation of the BI 882370* moiety into the effective PROTAC P4B, are unlikely to be offset by unfavourable off-target liabilities. Despite poor in vivo exposure, preliminary PK/PD analysis revealed on-target activity for P4B in A375 (BRAF(V600E)) tumor xenografts (Supplementary Fig. 8).
Discussion:
P4B is an effective PROTAC against BRAF(V600E) (DC50 = 12 nM; Dmax = 82%) that works through the expected degrader mechanism. P4B displays advantageous characteristics relative to P4BME, its matched non-E3 binding control, and in some cases relative to its parent inhibitor, BI 882370*. In particular, P4B displays enhanced inhibitory function in cell lines driven by some BRAF mutations that impart resistance to conventional inhibitor treatment. Included are the NCI-H1666 cell line harbouring the BRAF(G466V) mutation and the A375-VR cell line harbouring BRAF(V600E) with a tandem duplication of the kinase domain. In the latter case, the duplicated kinase domain mutant is almost as efficient a target for degradation as the single kinase domain mutant. This leads us to speculate that an optimized PROTAC inhibitor could in principle provide an effective remedy for some resistance mechanisms that render current BRAF inhibitors ineffective in the clinical setting.
Considering the similar sensitivity of BRAF(WT) and BRAF(V600E) to enzymatic inhibition by P4B in vitro, it is quite remarkable that the two nearly identical proteins display such drastic differences in sensitivity to degradation by P4B. This raises the important question of what properties of BRAF(V600E) render it an effective degradation substrate. Our data point to two likely determinants: the first relates to the conformational status of BRAF and the second relates to the ability of specific conformational states to integrate into ternary complexes with CRBN in response to P4B binding. BRAF(WT) exists as either higher order inactive monomers or active dimers, facilitated by its multi-domain architecture and by binding to 14–3-3 and MEK 32,33. Both BRAF(WT) states appear resistant to P4B induced ternary complex formation with CRBN and degradation. The V600E oncogenic mutation liberates BRAF into a distinct active monomer state characterized by reduced interaction with MEK 28. We posit that this altered conformation renders BRAF(V600E) a more efficient target for ternary complex formation with CRBN and hence degradation. Consistent with this model, the BRAF(G466V) mutant, which also displays reduced interaction with MEK in cells 28, displays some sensitivity to P4B-induced degradation. Highlighting the complexity of the system, expression of activated RAS, which can dominantly drive BRAF(V600E) into an active dimer state, also imparts resistance to P4B. These findings raise the intriguing question of whether it may be possible to engineer a PROTAC (either by changing the linker characteristics or by exploiting a binder to an alternate E3 with more liberal target ubiquitination constraints) that can degrade BRAF in its auto-inhibited monomer or active dimer states. Such a degrader would have obvious therapeutic utility.
Online Methods:
Synthesis of PROTAC compounds.
For detailed description of the synthetic routes and supporting 1H, 13C, and 19F NMR and mass spectrometry information see Supplementary Notes.
Spacer-length calculation.
The structure of each PROTAC was drawn in three dimensions using Chem3D (V15.1). MM2 energy minimization was performed using 4 different starting conformations to avoid conformational bias. The spacer length was obtained from the average of the four measurements between the 2 nitrogen or oxygen atoms at each end of the linker.
In vitro kinase assays.
BRAF, CRAF, ARAF, SRMS, LCK, and CSF1R kinase activity (IC50 Values) was measured using the Kinase Profiler service (Eurofins Pharma Discovery Services UK Limited (‘Eurofins’)). Compounds were sent to Eurofins as dry powders. Individual Kinase Assay Protocols used in the Eurofins KinaseProfiler radiometric protein kinase assays are described in http://www.komabiotech.co.kr/www/product/DD/KinaseProfiler_Assay_Protocol_Guide_Eurofins_v86.pdf
Protein purification.
The kinase domain of BRAF16mut (residues 444–723, WT and V600E) including 16 mutations to improve solubility 34 were expressed in bacteria and purified to homogeneity as described previously 35 into a final buffer containing 20 mM HEPES pH 7.5, 200 mM NaCl, 1 mM TCEP, 5 mM MgCl2 and 5% (v/v) glycerol.
The kinase domain of BRAF (residues 432–726) was co-expressed with CDC37 in Sf9 cells and purified as described previously 28 into a final buffer containing 25 mM HEPES pH 7.5, 150 mM NaCl, 1 mM TCEP and 5% (v/v) glycerol.
N-terminal histidine–ZZ domain tagged human CRBN (residue 40–442) and untagged human DDB1 (residues 1–1140) were co-expressed in Sf9 cells. Full length histidine-tagged CUL4 and full length untagged RBX1 were co-expressed in SF9 cells. Cell pellets were lysed by sonication in 50 mM HEPES pH 7.5, 500 mM NaCl, 10 mM imidazole, 10% glycerol, 2 mM TCEP, 1X EDTA-free protease inhibitor cocktails (Roche) and 250U Benzonase (Sigma). After centrifugation, protein was purified using a 5mL HiTrap HP Nickel-affinity column (GE Healthcare) and eluted with 500 mM imidazole. For CRBN/DDB1, the his-Tag was removed by TEV cleavage overnight and further purified by via ion-exchange chromatography (Hi-Trap Q-XL; GE Healthcare) and size-exclusion chromatography (S200, GE Healthcare) in buffer containing 50 mM HEPES pH 7.5, 200 mM NaCl, 1 mM TCEP. His tagged CUL4/RBX was concentrated and further purified on a Superdex S200 column in buffer containing 20 mM HEPES 7.5, 200 mM NaCl, 1 mM TCEP.
His-GST tagged Ube1, his-tagged Ube2D2 and his-tagged Ube2G1 were individually expressed in BL21 cells and lysed in 25 mM HEPES pH 7.5, 500 mM NaCl, 5 mM imidazole, 5 mM β-mercaptoethanol and 2 mM phenylmethylsulfonyl fluoride (PMSF). Clarified lysate was loaded on a 5mL HiTrap chelating column (GE Healthcare) and eluted with buffer containing 500 mM imidazole. Following dialysis and TEV cleavage, protein was passed through a second nickel affinity column then loaded onto a Superdex S200 (for Ube1) or Superdex S75 (for Ube2D2 and Ube2G1) column in 25 mM HEPES pH 7.5, 200 mM NaCl and 1 mM DTT.
Flag tag full length human BRAF(WT) and BRAF(V600E) were expressed in Freestyle 293F cells (Thermo-Fisher) transfected with pcDNA3.1-Hygro vector using PEI (25 μg mL−1) 36. Cells were lysed in 20 mM Tris pH 7.5, 250 mM NaCl, 5 mM MgCl2, 10% glycerol, 1mM EDTA, 0.4% CHAPS, 50 μM ATPγS, 1× phosphatase inhibitor cocktail (Sigma-Aldrich), 1 mM sodium vanadate, 20 μM leupeptin, aprotinin (0.15 U mL−1) and 1 mM PMSF. Following centrifugation (14,000g, 10 min, 4 °C) lysates were loaded onto anti-Flag M2-affinity resin (Sigma-Aldrich) for 3 hours. Proteins were eluted by TEV cleavage and further purified twice using a Superose 6 increase 10/300 (GE Healthcare) and a Superdex 200 Increase 10/300 column (GE Healthcare) in a buffer containing 20 mM HEPES 7.5, 137 mM NaCl, 1 mM TCEP, 5 mM MgCl2, 5 μM ATPγS.
Untagged ubiquitin was expressed in BL21 and lysed in 20 mM HEPES pH 7.5, 400 mM NaCl and 2 mM PMSF. Following centrifugation, supernatant was incubated with perchloric acid (Sigma) at 0.7% (v/v). The soluble fraction was dialyzed in 50 mM NaOAc pH 4.5, loaded on a MonoS column (GE Healthcare) and eluted in 250 mM NaCl. Purified ubiquitin was dialyzed into 20 mM HEPES pH 7.5, 100 mM NaCl.
Protein concentrations were determined by UV-Vis absorption spectroscopy using a NanoDrop spectrophotometer (Thermo Scientific).
Protein crystallization and structure determination.
500 μM BRAF16mut and P4B were crystallized at 20 °C in sitting drop with a 1:1 mix of complex and solution containing 20% PEG 6000, 0.1 M HEPES pH 7.0, 0.2 M calcium chloride. X-ray diffraction data were collected on a flash-frozen crystal cryo-protected in mother liquor containing 25% ethylene glycol at 100 K on station 24-ID-E, NE CAT beamline, Advanced Photon Source (APS) at a wavelength of 0.97918 Å. Data reduction was performed using the XDS package 37. The structure was solved by molecular replacement using PDB 6CAD 38 as a search model in Phaser 39. Structure of P4B was built using elbow 40. Model building and refinement was performed using COOT 41 and PHENIX 42. See Supplementary Table 1 for data collection and refinement statistics. Ramachandran statistics are 95.3% favoured, 4.7% allowed, 0% outliers. Structure figures were generated using Pymol.
SPR experiments.
BRAF16mut(WT) and BRAF16mut(V600E) were diluted to 1.55 μM (in 20 mM HEPES pH 7.4; 0.005% Surfactant P20), and coupled via amine-coupling chemistry to CM5 sensor chip (Series S Sensor Chip CM5 from GE) using a Biacore S200 in a running buffer of HBS-EP + 1% DMSO (10 mM HEPES pH 7.4; 150 mM NaCl; 3 mM EDTA; 0.005% Surfactant P20 (Tween-20); 1% DMSO) at 25°C. Compound binding was tested at 25 °C, flow rate 30 μL/min; injection time 180s; dissociation time 600s. Raw sensorgram data was analyzed and fit using the Biacore S200 analysis software (GE).
In Vivo ubiquitination assays.
Stable HEK293 cells integrated with 3X-Flag BRAF(V600E) were transiently transfected with a constitutive expression HA-ubiquitin plasmid. 20 hours post transfection, tetracycline was added to induce 3XFlag- BRAF(V600E) protein expression. Cells were then treated with P4B or control compounds at the indicated concentrations for 3–4 hours before harvest. MG132 (5 μM) was added in all treatments and PR169 (5 μM) was added 1 hour before cell harvest. Cells were lysed in buffer containing 10 mM Tris-HCl pH 8.0, 150 mM NaCl, and 0.5% SDS. Cleared lysates were immunoprecipitated with magnetic anti-Flag resin to pull down 3X-Flag BRAF(V600E) in a final buffer containing 10 mM Tris-HCl pH 8.0, 150 mM NaCl, 1 mM EDTA, 0.2% SDS, and 0.5% Triton X-100. Washed magnetic anti-Flag resin was analysed by SDS-PAGE and Western blotting for detection of ubiquitinated forms of 3-Flag-BRAF(V600E).
In vitro ubiquitination assays.
Ubiquitination reactions were premixed to a final concentration of 1 μM Ube1, 10 μM Ube2D1, 10 μM Ube2G1, 1 μM CUL4-RBX1, 1 μM cerebron-DDB1 and 0.5 μM full-length BRAF(V600E). Compounds were added at the indicated concentrations and to a final DMSO concentration 1%. Reactions were started by addition of 200 μM ubiquitin, 10 mM ATP and 10 mM MgCl2 and then incubated at 30 °C for 2 hours. Samples were analyzed by SDS-PAGE gel and immunoblotted against a 1:5000 dilution of BRAF antibody (F7, Santa Cruz).
Separation of Phases-based Protein Interaction Reporter assay.
HEK293T cells were grown on poly-L-lysine treated coverslips. Cells were transiently transfected with plasmids using lipofectamine until confluency reach ~30%. Cells were imaged 48 hours after transfection. Time-lapse imaging was performed in an incubation chamber at 37 °C and internal CO2 level of 5%. Chemical compounds were added to the incubation chamber as the time-lapse imaging was started. Fluorescence images were acquired every 4 sec for a total of one hour. Image acquisition was controlled by the Zen Microscope Imaging Software v14.0.18.201 (Zeiss). Images were processed using ImageJ v 1.52u (NIH).
Fluorescence Polarization (FP) assay for ternary complex formation.
Binding reactions were performed with 100 nM fluorescein-conjugated pomalidomide, 400 nM of CRBN - DDB1 complex and 2,000 nM of BRAF16mut(WT), 2,000 nM of BRAF16mut(V600E), 1,000 nM of BRAF(WT), 10,000 nM of MEK(WT), 10,000 nM of MEK(F311S) kinase domains (in the indicated experiments) in buffer containing 50 mM HEPES pH 7.5, 200 mM NaCl, 1 mM DTT, 0.01% Brij-35, and 0.1 mg/mL BSA. Small molecules were diluted to a final DMSO concentration of 2.5%. Binding reactions were equilibrated for 30 min in 20 μL reactions in 384-well black flat-bottom low flange plates (Corning, 3573). Fluorescence intensities were measured using a BioTek Synergy Neo plate reader and FP was calculated with the Gen5 Data Analysis Software. To eliminate interference of each compound with the probe, FP readings of diluted compound (with no protein) in the presence of probe was subtracted from readings with protein. IC50 values were calculated using GraphPad Prism v8.4.1.
LanthaScreen™ kinase binding assay.
For BRAF, 12.5 nM of purified poly histidine-tagged BRAF16mut kinase domain was incubated with 1 nM of LANCE® Europium-coupled anti-His antibody (PerkinElmer; AD0110; lot 2277216), 7.5 nM of Alexa Fluor® 647-labeled kinase tracer 178 (Thermo-Fisher) and varying concentrations of kinase inhibitors for 30 min at room temperature in buffer containing 50 mM HEPES pH 7.5, 100 mM NaCl, 3 mM DTT, 10 mM MgCl2, 1 mM EDTA, 0.01% Brij-35. For CRAF, the same procedure was conducted with GST-fused CRAF kinase domain (residues 306-end; Sigma) and the LANCE® Europium-coupled anti-GST antibody (PerkinElmer; AD0253; lot 2034861). TR-FRET signals were measured using a Synergy NEO plate reader (Biotek). The relative reduction in TR-FRET signal was calculated by normalizing each data point to background and vehicle-treated wells. IC50 values were calculated using log(agonist) versus response – variable slope(four parameters) function in GraphPadPrism.
Reagents for Immunoprecipitation and Western Blot analysis of PROTAC treated cells.
A375, SK-MEL-28, Colo-205, HT-29, MeWo, NCI-H1666, NCI-H508, SK-MEL-2, MDA-MB-231, NCI-H2087, HCT116, HEK293T, RKO, WM-266–4 and NCI-H1755 cell lines were purchased from ATCC and maintained as instructed.
Antibodies against BRAF (sc-5284; clone F-7; lot C0166; dilution 1:2000), ARAF (A-5, sc-166771), phospho-MEK1/2 (7E10, sc-81503), phospho-ERK (E-4, sc-7383), SRMS (E5, sc-376223), KRAS (sc-30; clone F-234; lot F2713), HRAS (sc-53958; clone M3; lot C1008), NRAS (sc-31; clone F155; lot D1712), were purchased from Santa Cruz; CRAF (9422), phospho-MEK1/2 (9121; lot 56), MEK1/2 (9122; lot 14), ERK1/2 (9102 or 4695), HSP90 (4877; clone C45G5; lot 5) from Cell Signaling; CRAF (610152; clone 53/c-Raf-1; lot 7208706; dilution 1:2000), p27 (610242) from BD Biosciences; KSR1 (EPR2421Y), panRAS (ab108602; clone EPR3255; lot GR11071–26; dilution 1:2000), BRAF(V600E) (RM8 clone) (ab200535) from Abcam; Anti-Flag M2 HRP conjugated (A8592), Anti-Flag M2 magnetic beads (M8823), phospho-ERK (M9692; clone MAPK-YT; dilution 1:2500) and alfa-tubulin (T6199; clone DM1A; lot 078M4796V; dilution 1:5000) from Sigma-Aldrich. MG132 (S2619) was purchased from Selleckchem, MLN4924 from EMD Millipore. Antibodies for Western blotting were used at 1:1000 dilution, unless indicated otherwise.
A375 vemurafenib-resistant (VR) cell line was generated in a selective culture media containing 5 μM vemurafenib for four weeks after which colonies were picked and cloned by limiting dilutions. The genetic lesion in all selected clones corresponded to a duplication of the BRAF(V600E) kinase domain (describe in 5) as confirmed by RT-PCR followed by sequencing and by Western blotting.
Generation of A375 cells expressing activated RAS.
KRAS(G12V), HRAS(G12V) and NRAS(G12V) were inserted in pLX301 (Addgene) using Gateway LR cloning (Thermo). Lentiviral particles were generated in HEK293T cells as described previously29. A375 cells were transduced at a multiplicity of infection of 2 after which puromycin selection (2.5 μg mL−1) was applied for 72 hours. Resistant cells were maintained under puromycin selection until one passage before conducting experiments.
Generation of stable HEK293 cells integrated with 3XFlag-BRAF(V600E).
The human BRAF V600E mutation was generated by PCR (from the ORFeome 8.1 clone accession BC112079), and the resulting BRAF ORF with a stop codon was cloned into the Gateway entry pDONR223 before being transferred to pDEST-pcDNA5–3X-FLAG vector for expression of BRAF(V600E) tagged at the N-terminus. The insert was sequenced. Generation of stable HEK293 cells integrated with 3X-Flag BRAF(V600E) was performed using HEK293 Flp-In T-REx cells seeded in 6-well plates at 50% confluency in DMEM supplemented with 5% FBS, 5% FCS and 100 units/mL penicillin/streptomycin. The next day, media was removed and replaced with DMEM supplemented with 5% FBS and 5% FCS. Cells were transfected with jetPRIME (Polyplus) with 100 ng of the expression construct and 1000 ng of Flp recombinase vector pOG44 according to the manufacturer’s instructions. After 24 hours, cells were transferred to 10 cm plates in DMEM supplemented with 5% FBS, 5% FCS and 100 units/mL penicillin/streptomycin. The next day, media was replaced with selection media (DMEM with 5% FBS, 5% FCS, 100 units/mL penicillin/streptomycin and 200 μg/mL hygromycin). Selection media was replaced every 3 to 5 days to remove non-transfected dead cells, until isolated clones were visible (approximately 10–15 days). Cells were then passaged onto 15 cm plates in selection media. When cells reached 80% confluency in 15 cm plates, the plate was split for freezer stocks and biological replicates.
RASless MEF cells.
The conditional Ras-knockout mouse embryonic fibroblasts (MEFs) (Hras−/−;Nras−/−;KRASlox/lox) and RASless MEFs reconstituted with human BRAF(V600E) (BRAF(V600E);Hras−/−;Nras−/−;Kras−/−) were obtained from the US National Cancer Institute26. To obtain RASless MEFs, Kraslox/lox cells were treated with 1 μM 4-OHT for 18 days with regular passaging26.
Cell culture and Western blot analysis.
Cells were grown in Dulbecco’s Modified Eagle Media (DMEM) (GIBCO), or RPMI-1640 supplemented with 10% FBS, penicillin and streptomycin. At 50–70% confluence, cells were treated as indicated with small molecules or 0.1% DMSO solvent vehicle. Prior to harvesting, cells were washed and scraped into PBS supplemented with 1 mM PMSF. Cell pellets were collected after centrifugation. For wash-out experiments, cells were first treated with compounds for 22 hours, then washed with fresh medium to remove compounds. Cell cultures continued in fresh medium until harvesting at the indicated time points. For in-cell target/PROTAC/E3 ligase ternary complex detection, cells were first transiently transfected with pcDNA-DDB1 and pcDNA-CRBN-Flag plasmids. Transfection reagent was removed and fresh medium added 24 hours post transfection, 16 hours after medium change, cells were treated with P4B, P4BME, BI 882370*, or DMSO. 5 μM MG132 was added to prevent P4B induced BRAF degradation. Cells were harvested 5–6 hours post compound exposure, and cell lysates subjected to immunoprecipitation using anti-Flag magnetic beads and Western blotting. Cells were lysed in a buffer containing 50 mM HEPES pH 7.4, 150 mM NaCl, 5 mM EDTA, 0.5% NP-40, 5 mM NaF, 10% glycerol. The buffer was supplemented with fresh Roche protease inhibitor cocktail (5056489001) and phosphatase inhibitor cocktail PhosStop (4906845001). Cell lysates were clarified by centrifugation at 18,000 g for 30 min, supernatant collected and protein concentration determined by Bradford assay (Bio-Rad). Proteins were separated by SDS-PAGE, transferred onto nitrocellulose membranes and subjected to standard immunoblot protocol. Western blots were visualized using Bio-Rad Clarity ECL Western Blotting Substrate on a Bio-Rad ChemiDoc MP imaging system. Band intensities were quantified by Bio-Rad Image Lab software.
Quantitative evaluation of pERK inhibition and anti-proliferative effect.
For pERK AlphaLisa, cells were plated in 96-well flat-bottomed transparent plates (Costar) at 15,000 to 30,000 cells per well. Cells were treated for the indicated times with compound dilutions then lysed. Cell extracts were subjected to AlphaLISA® SureFire® Ultra™ p-ERK 1/2 (Thr202/Tyr204) (PerkinElmer) reactions according to the manufacturer’s specifications. Signals were recorded using a Synergy™ NEO plate reader (BioTek®).
For assessment of anti-proliferative effect, cells were plated in 384-well flat-bottomed white plates (Greiner) at densities of 400 to 2,000 cells per well. Cells were treated with compound at indicated concentrations. After three days, cells were lysed for 15 minutes in diluted CellTiter-Glo® reagent (5 μL CellTiter-Glo® reagent + 25 μL of PBS) and luminescence was acquired on a Synergy™ NEO plate reader (BioTek®).
For both AlphaLisa and CellTiterGlo® experiments, each plate contained an internal 100% inhibition control (10 μM AZD6224; Selleck Chemicals; CAS# 606143–52-6), which was used for background measurement. After background subtraction, % inhibition was calculated for each data point by normalizing to the vehicle-treated wells. IC50 or EC50 values were determined with GraphPadPrism log(agonist) versus response – variable slope(four parameters) function.
Proteomics profiling of kinase inhibitor specificity
Bisanilino pyrimidine kinase inhibitor CTx-0294885 31 (MedKoo Biosciences) was covalently coupled to NHS Sepharose 4 (GE Healthcare, cat# 17–0906-01), generating iCTx beads. 40 × 15 cm plates of A375 cells were lysed in 1:4 (w/v) volume of [50 mM HEPES pH 7.5, 150 mM NaCl, 0.5% Triton X-100, 1 mM EDTA, 1 mM EGTA, 10 mM NaF, 2.5 mM Na3VO4, 1x Protease Inhibitor Cocktail (Sigma-Aldrich cat#P8340), 1x Phosphatase Inhibitor Cocktail 2 (Sigma-Aldrich cat#P5726), Phosphatase Inhibitor Cocktail 3 (Sigma-Aldrich cat#P0044)] by one freeze-thaw cycle and 12 passages through an 18G needle. Inhibitor in DMSO was added to centrifugation-clarified lysate (3 mg/mL) at the indicated final concentrations and incubated with agitation (45 minutes at 4 °C) before addition of 25 μL pre-washed packed iCTx beads (incubation for another 30 minutes at 4 °C). For the 0 nM inhibitor, the supernatant was kept and incubated with fresh iCTx at 4 °C for 1 hour. Beads were pelleted (500 g) and washed once with 1 mL of lysis buffer and 3 times with 50 mM ammonium bicarbonate buffer (ABC). 1 μg of trypsin in 50 μL of 50 mM ABC was added for incubation at 37 °C overnight and supernatant was supplemented with trypsin (0.5 μg) for further digestion. After 4 hours, formic acid was added (final concentration 4%) and peptides lyophilized.
Coated PicoFrit emitters (75 μm ID, 360 μm OD, 50 cm, New Objective) were packed with Reprosil-Pur 120 C18-AQ, 1.9 μm. 5 μL of peptides in 5% formic acid were directly loaded at 200 nL/min for 25 minutes and eluted at 200 nL/min with a 175 minute acetonitrile gradient (0.1% formic acid) generated by an Eksigent ekspert™ nanoLC 425 directly onto an Orbitrap Fusion™Lumos™Tribrid™. MS1 scan was 50 ms, mass range of 400–1500 Da, Orbitrap resolution of 120,000, 60% RF lens and 2600 volts. MS/MS scans (total cycle time of 3 seconds) were with accumulation time of 35 ms and 32% HCD collision energy for ions with charge state from 2–7 and an AGC target of 2 × 10⁵, isolated using Orbitrap resolution of 15,000 (dynamic exclusion 10 seconds).
Identification and quantification of peptides and proteins were performed with MaxQuant (version 1.6.2.10) 43 against human Swiss-Prot (20,396 protein entries) and common contaminants using the integrated Andromeda search engine 44 and label-free quantification 45, with matching between runs enabled. Methionine oxidation, N-terminal protein acetylation, and asparagine deamidation and two missed cleavages for trypsin/P were allowed. Eight amino acid minimum peptide length and 1% peptide and protein FDR were specified. All other parameters were default settings.
MaxQuant protein group results were filtered to remove contaminants, reverse identifications, and proteins only identified by post-translationally modified peptides. Additional filters were applied so that passing identifications had stable and sufficient data points for curve generation: at least 6 peptides (at least one unique) with intensity above zero, MS/MS count above or equal to 20, and score above 1. Any channel where the majority of intensity values were zeros was removed prior to fitting data for competition binding curves. All protein intensities were normalized to their corresponding DMSO control. To distinguish kinases from non-kinases, proteins were compared to a defined list of 555 human kinases.
Data fitting and deduction of IC50 values were performed in R using a four-parameter log-logistic function (LL.4) and the ‘drc’ package 46. Upon manual review of all dose-response curves, a threshold of quantitative variation of ≥40% between the highest concentration (30 μM) and DMSO control was selected to define proteins as strong binders to the tested inhibitor. Curves from all tested inhibitors were overlaid for comparison.
RNAseq analysis.
A375 cells were treated with 200nM of P4B, P4BME, BI 882370*, dabrafenib, vemurafenib, trametinib, or 0.1% DMSO for 20 hours prior to harvesting RNA using Ambion TRIzol Reagent and performing RNA-Seq on 1 μg of total RNA using the Illumina TruSeq Stranded mRNA Library Preparation Kit. After quality control of fragment size (Agilent Fragment analyzer), and quantification (BioRad ddPCR™), samples were loaded onto an Illumina NextSeq 500 using Hi Output Kit v2.5 (75 Cycles). RNAseq data quality was inspected with FastQC (v0.11.5) 47 and multiQC (v1.8.dev0) 48 and sequences trimmed to a length of 87 bases for mapping to reference genome hg19 using Tophat (version 1.4.1) 49, and bowtie (version 0.12.7) 50 with default parameters. Mapped read files were converted using samtools (version 0.1.18) 51, ambiguous reads filtered, and RPM (Reads Per Million) representing overall transcript level normalized by total mapped reads calculated using in-house scripts52.
A correlation heatmap using spearman correlations and unsupervised clustering was generated with heatmaply (v1.0.0) in R 53. To determine differentially expressed genes (DEGs) between the key sample subsets, both DESeq2 (v1.24.0) 54 and t-tests were used with the raw count data and the RPM data, respectively. FDR adjusted p value cutoffs of <0.01 and log2 fold change cutoffs of <−2 or >2 were applied. Of note, DESeq2 returns about 3x as many DEGs as t-test, and all but 2 genes identified by t-test were incorporated in the DESeq2 dataset. Therefore, the Venn diagram was built using genes identified by both methods.
Whole proteome abundance measurements.
A375 cells were treated with indicated compounds for 24 hours in triplicates, harvested and resuspended in lysis buffer (5% SDS, 50 mM TEAB pH 7.55) and sonicated for 15 seconds on a probe sonicator. Reduction (5 mM TCEP for 30 minutes at 55 °C) and alkylation (10 mM chloroacetamide at room temperature for 45 minutes) were followed by sample concentration, clean up and digestion with 80 μg trypsin/Lys-C (Promega V5073) following the S-Trap™ vendor protocol (Protifi). Peptides were cleaned on a Sep-Pak C18 1 cc Vac Cartridge (WAT054955) and lyophilized. 100 μg of peptide was labeled with TMT10 isobaric label (ThermoFisher, cat #90110) for 1 hour at room temperature, followed by quenching with 5% hydroxylamine and high pH fractionation (Pierce™, Catalog #: 84868) and lyophilization.
Peptides were resuspended in 5% formic acid and analyzed by LC-MS/MS on an Orbitrap Fusion™Lumos™Tribrid™ (see above). Changes to the acquisition procedure were: Orbitrap resolution of 240,000 (MS1), 86 ms and 35% HCD collision energy (MS2); AGC target of 5e4, isolated using Orbitrap resolution of 50,000 Da (dynamic exclusion 12 seconds). Data was analyzed on Proteome Discoverer using default settings for TMT6plex analysis against the human UniProt reference database (72,854 protein entries) with integrated search engine SequestHT and Percolator. Modifications included static N-terminal and variable lysine TMT, along with the defaults: static cysteine carbamidomethyl, and variable methionine oxidation and N-terminal protein acetylation. Quantification of peptides was performed within the same workflow based on the TMT 10plex method. Volcano plots were generated in R after filtering out proteins missing abundance ratios or associated p-values, with applied cut-offs of p-value < 0.01 and log2 fold change cutoffs of <−1.5 or >1.5.
Liver microsomal metabolic stability.
Test compounds were incubated with mouse or human liver microsomes, at 37 °C. Upon completion of 60 minutes, reactions were terminated by adding 2-volumes of ice-cold, acetonitrile. Samples were centrifuged at 4,000 rpm for 10 minutes. Supernatants were transferred for LC/MS analysis. The percent remaining relative to initial time point were reported.
Caco-2 Assay.
Human, epithelial Caco-2 cells were seeded on high-density PET membrane inserts and used after 21 days. The dosing buffer contained metoprolol, atenolol and lucifer yellow. Digoxin was used as a Pgp substrate control. Cell monolayers were dosed on the apical (A-to-B) or basolateral (B-to-A) side and incubated at 37 °C. Samples for LC-MS/MS analysis were taken from the donor and receiver chambers at 120 minutes. The percent of transported drug was calculated based on these peak areas. Each determination was performed in duplicate.
Mice tissue and plasma analysis.
For quantification of drug levels in tissue samples, all tissues were homogenized by bead beating. To both tissue and plasma samples, 2-volumes of acetonitrile was added, vortexed, then centrifuged at 14,000 rpm for 6.5 minutes. Supernatants were transferred to vials for LC-MS/MS analysis. Chromatographic separations were carried out on a C18 column. A Waters Synapt G2S QTof was used for mass spectrometric analysis. All animal procedures were performed in accordance with the regulations of the Canadian Council on Animal Care and the University Health Network. Temperature was ~21°C, rH: 40%, 12 hour light cycles with gradual ‘sunrise’ and ‘sunset’.
A375 xenograft experiments.
NU(NCr)-Foxn1nu female mice, 6–8 weeks old, weighing 18–22 g, were purchased from Charles River. All animal procedures were in accordance to local animal welfare committee of the University of Montreal (Comité de Déontologie en Expérimentation Animale, CDEA) in agreement with regulations of the Canadian Council on Animal Care (CCAC). Animals were maintained at 22°C, 50% humidity with dark/light cycles of 12h/12h. Mice were fed a standard rodent diet and water was supplied ad libitum. A375 cells were dissociated by trypsinization, washed in PBS and re-suspended to a final concentration of 5 × 10⁶ cells/mL in PBS mixed with matrigel (50:50; Corning). Mice were inoculated subcutaneously at the right flank with 1 × 10⁶ cells for tumour development. Tumours were measured starting 10–12 days after cell inoculation and body weights were recorded once a week. Tumor volume was calculated using the standard formula (length × width × thickness) / 2. Compound treatment was performed when mean tumour size reached approximately 200 mm3, with 2 mice for each time point randomized to balance the average tumour size. Mice were administered IP with a solution of P4B at 3 mg/mL prepared in a formulation consisting of 5% DMSO, 20% PEG 400, 75% of 10% Aqueous Tween 80 in a dosing volume of 10 mL/kg to yield 30mg/kg. Plasma and tumor samples were collected at the indicated time points and subjected to mass spectrometric tissue analysis for compound concentration or to Western blotting.
Data Availability Satement:
Coordinates and structure factors (6UUO) are available at the Protein Data Bank, www.rcsb.org.
“The kinase inhibitor competition data used for the protein kinase-biased analysis was also submitted as an incomplete submission to the MassIVE respository (https://massive.ucsd.edu/ProteoSAFe/static/massive.jsp) and assigned the accession number MSV000085271. The dataset is available at ftp://massive.ucsd.edu/MSV000085271/ ”
“Data for the proteome-wide protein level analysis has been deposited as an incomplete submission to the MassIVE repository (https://massive.ucsd.edu/ProteoSAFe/static/massive.jsp) and assigned the accession number MSV000084551. The dataset is available at ftp://massive.ucsd.edu/MSV000084551/”
The RNAseq data reported in this paper are available at the Gene Expression Omnibus database (GEO) with Accession number GSE148500.
All data supporting the findings are available in the paper and Supplementary Information files.
Extended Data
Extended Data Fig. 1. Structure of the BRAF kinase domain bound to P4B.

a, Stereo-view of an unbiased ∣Fo-Fc∣ electron density map contoured at 2.5σ colored green with P4B and the BRAF kinase domain colored orange and blue, respectively. b, Stereo-view of the superimposition of P4B (orange) bound to BRAF (dark blue) and BI 882370 (light green) bound to BRAF (light blue) (PDB of BRAF:BI 882370 structure is 5CSX). c-d, Comparison of the binding mode of P4B (c) and BI 882370 (d) to the BRAF kinase domain. P4B, BI 882370, glucose and the BRAF contacting residues are shown as sticks. e-f, Flat schematic representation of the binding mode of P4B (e) and BI 882370 (f) to the BRAF kinase domain. Blue eyelashes represent hydrophobic interactions and yellow dashed lines represent hydrogen bonds.
Extended Data Fig. 2. Functional analysis of P4B in cells and in vitro.
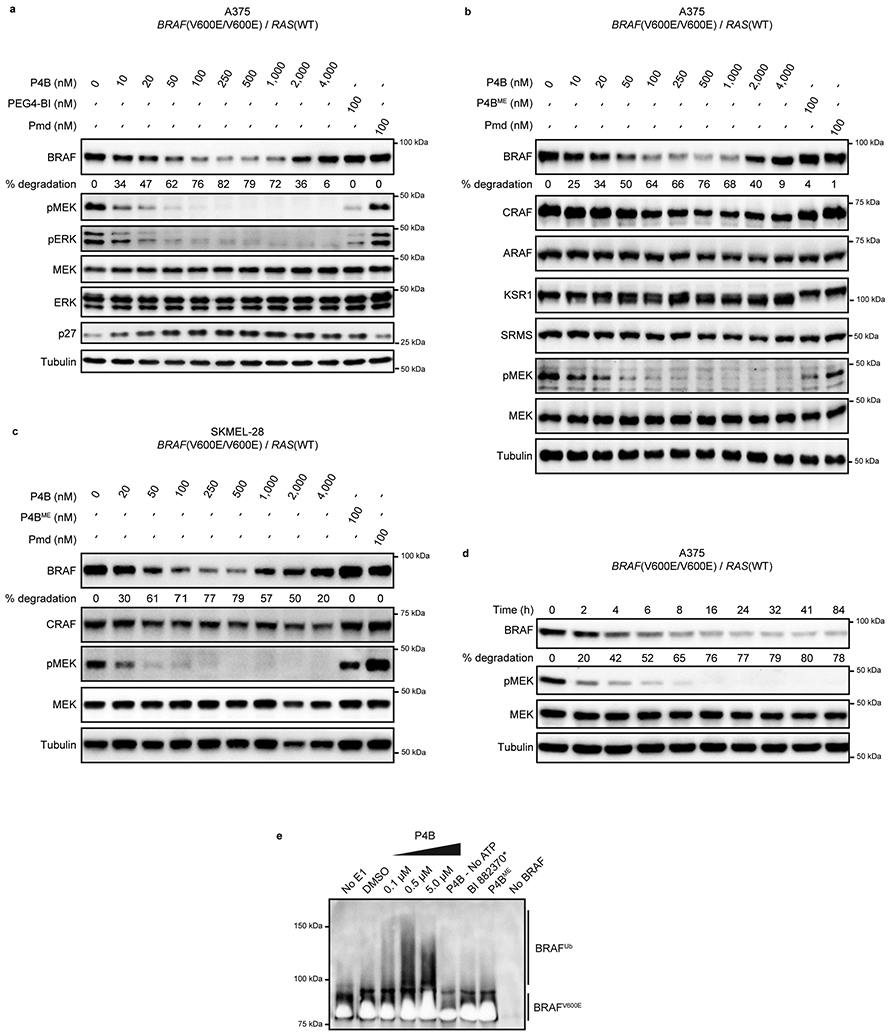
a, P4B dose response analysis in A375 cells. Cells were treated for 24 h with P4B, PEG4-BI, or pomalidomide at the indicated concentrations. p27 accumulation is reflective of G1 cell cycle arrest upon BRAF degradation by P4B treatment.
b, Immunoblot analysis of BRAF, CRAF, ARAF, KSR1, SRMS, pMEK and MEK levels in A375 cells after 24 h treatment cells with P4B, P4BME and pomalidomide at the indicated concentrations.
c, Immunoblot analysis of BRAF, CRAF, pMEK and MEK levels in SKMEL-28 cells after 24 h treatment with P4B, P4BME and Pmd at the indicated concentrations. Tubulin served as a loading control.
d, Time course analysis. A375 cells were treated with 100 nM P4B for the indicated time.
e, Anti-BRAF immunoblot of in vitro ubiquitinatated full-length BRAF(V600E). Ubiquitination reactions were carried out +/− the indicated components. The white signal at the bottom of blot corresponds to saturation of BRAF signal. Data shown are representative of minimally two independent experiments.
Extended Data Fig. 3. Survey of PROTAC potency in cell lines with different RAS-ERK pathway lesions.

a-j, Dose-dependent inhibition of proliferation (left panel) and phospho-ERK (right panel) following P4B, P4BME and BI 882370* treatment in COLO-205 (a), RKO (b), HT-29 (c), MeWo (d), NCI-H508 (e), NCI-H1755 (f), HCT116 (g), SK-MEL-2 (h), MDA-MB-231 (i), and NCI-H2087 (j) cell lines. Data shown are representative of a minimum of three independent experiments performed in technical duplicate.
Extended Data Fig. 4. Immunoblot survey of PROTAC potency in cell lines with different RAS-ERK pathway lesions.
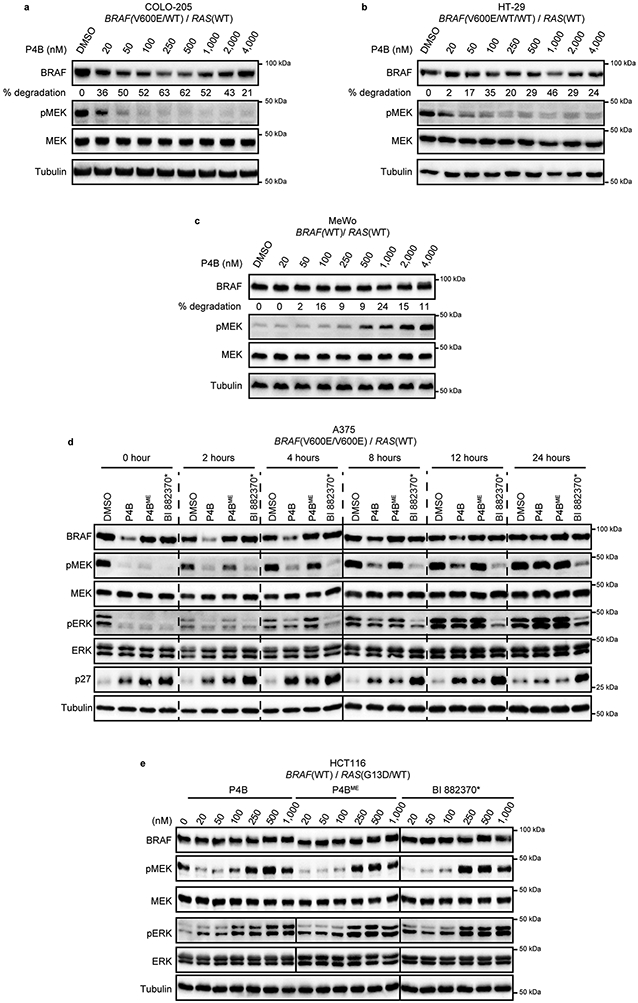
a-c, Immunoblot analysis of COLO-205 (a), HT-29 (b), and MeWo (c), cell lines after 24 h treatment at the indicated compound concentrations. (d), Washout analysis of A375 cells treated with P4B or non-PROTAC controls. Cells were treated with DMSO (0.1%), P4B (100 nM), P4BME (500 nM), or BI 882370* (500 nM) for 22 h followed by washing in medium to remove compounds. Note that a lower concentration of P4B was employed to enable similar starting points of pathway inhibition for comparison. Cells were incubated in fresh medium for the indicated time periods prior to harvesting and immunoblot analysis. Data shown in d are representative of minimally two independent experiments. e, Comparative immunoblot analysis of P4B, P4BME and BI 882370* function in HCT116 cells after 24h treatment at the indicated compound concentrations. Data shown are representative of minimally two independent experiments.
Extended Data Fig. 5. Identification of BRAF-driven tumor cell lines sensitive to P4B.

a-c, Dose-dependent analysis of P4B and P4BME treatment on BRAF, MEK, ERK, pMEK and pERK levels in WM266-4 (a), NCI-H1666 (b) and A375-VR (c) cell lines. Data shown are representative of minimally three independent experiments performed in technical duplicate. Quantification of BRAF levels shown below blots.
Extended Data Fig. 6. Influence of RAS expression on the sensitivity of BRAF to degradation by P4B.

a, Over-expression of individual RAS(G12V) mutant isoforms in A375 cells. Lysates of A375 cells transduced with the indicated lentivirus were analysed by immunoblot. b, Immunoblot analyses of A375 cells transduced with the indicated lentivirus after 24 h treatment with P4B at the indicated concentrations.
c, The MEF Hras−/−, Nras−/−, Kraslox/lox cell line (KrasWT-lox/lox) was treated with 1 μM 4-OHT for 18 days to knock out the KRAS isoform (RASless). Immunoblot was performed on whole cell extracts using the indicated antibodies. d, Immunoblot analyses of BRAF levels in KrasWT-lox/lox and RASless cells treated for 24 h with the indicated concentration of P4B. e, Dose-dependent inhibition of proliferation of KrasWT-lox/lox cells (left panel) and RASless cells (right panel) with increasing concentration of P4B and P4BME. f, Dose-dependent inhibition of proliferation (left panel) and phospho-ERK (right panel) following P4B and P4BME treatment of RASless cells stably expressing BRAF(V600E). g, Immunoblot analyses of BRAF(V600E) (anti-RM8) and total BRAF (WT + V600E) levels in RASless cells stably expressing BRAF(V600E) and treated for 24 h with the indicated concentration of P4B. Data shown are representative of minimally three independent experiments performed in technical duplicates.
Extended Data Fig. 7. Analysis of PROTAC induced ternary complexes between the isolated protein kinase domain of BRAF and CRBN/DDB1 in vitro.

a, Binding of CRBN/DDB1 to a fluorescein-labelled pomalidomide probe assessed by fluorescence polarization. b-h, Competitive displacement of fluorescein-labelled pomalidomide probe from CRBN-DDB1 (at 100 nM and 400 nM, respectively, corresponding to 80% saturated binding) by pomalidomide (Pmd) (b), P4B (c), 2 (d) ,4 (e), 5 (f), 6 (g), 7 (h) assessed in the absence or in the presence of BRAF16mut(WT) kinase domain, or BRAF16mut(V600E) kinase domain. IC50 values were obtained by fitting FP signal using a variable slope - four parameter equation in GraphPad Prism. Data shown are representative of two independent experiments each performed in triplicate. Data represent mean values ± s.d.
Extended Data Fig. 8. P4B induced ternary complexes in cells.

a, A375 cells ectopically expressing flag-tagged CRBN/DDB1 were treated with P4B or BI 882370* at the indicated experimental conditions. Flag-tagged CRBN was immunoprecipitated using anti-Flag magnetic beads. Lysates and immunoprecipitates were subjected to immunoblot analysis with the indicated antibodies. * indicates nonspecific signal. Data are representative of two independent experiments.
b. GFP-fluorescence images of HEK293T cells expressing CRBN-EGFP-HO-Tag6 and BRAF-EGFP-HO-Tag3 (WT or V600E) at the indicated time point after treatment with 0.5 μM of P4B, BI 882370* and P4BME or equivalent volume of DMSO. Data are representative of two independent experiments. Scale bars represent 10μm.
Extended Data Fig. 9. Kinase specificity profiles of P4B and BI 882370*.

a, Summary table of the competition assay. A375 cell lysate was preincubated with DMSO (control), CTx-0294885, P4B or BI 882370* prior to CTx-0294885-based affinity purification and mass spectrometric analysis; only proteins (and kinases) passing the 1% FDR threshold set in MaxQuant are reported (as number of unique genes). The threshold for reporting kinase inhibitor efficiency was a minimal reduction to 60% of its initial recovery value at the highest dose (30 μM). b-d, Individual curves for those kinases that meet the 60% threshold of displacement with both P4B and BI 882370* (b), only with P4B (c) or only with BI 882370* (d). Both Swiss-Prot protein names and NCBI gene names are listed.
Extended Data Fig. 10. Proteome wide protein level analysis.

a, Immunoblot analysis of A375 whole cell lysates used in proteome wide analyses in b and c. Data are representative of two independent duplicates. Changes in protein levels between P4B and P4BME treatments (b) and between P4B and DMSO treatments (c). A375 cells were incubated for 24 hours with 200 μM of P4B, P4BME or DMSO only, prior to lysis, TMT labeling, and mass spectrometric analysis. Blue and red vertical lines are representative of log2 fold change cutoffs of - and + 1.5 and the dotted horizontal line is representative of a p-value cutoff of 0.01. Coloured points represent proteins that are considered significantly decreased (blue) and increased (red), respectively. Only proteins passing these thresholds are listed.
Supplementary Material
Acknowledgements:
We thank G. Seabrook for technical assistance and access to the NMR Core Facility of Princess Margaret Cancer Center. Research was supported by grants from the Canadian Cancer Society (CCSRI-Impact 704116 to FS and 706165 to MT2), the Canadian Institutes of Health Research (FDN 143277 to FS; FDN 388023 to MT2; FRN 414829 to PM1; FDN 144301 to ACG; FDN 143343 to DD), the Ontario Research Fund (RE08-065 to FS, DD, JW, ACG) and the Terry Fox Research Institute to FS, JW and ACG. MT2, ACG, DD and FS are recipients of Tier1 Canada Research Chairs. SD is a recipient of the Banting Postdoctoral Fellowship. Proteomics and RNA-Seq work were performed at the Network Biology Collaborative Centre at the Lunenfeld-Tanenbaum Research Institute, a facility supported by Canada Foundation for Innovation funding, by the Ontarian Government and by Genome Canada and Ontario Genomics (OGI-139). Diffraction work conducted at the Northeastern Collaborative Access Team beamlines was funded by the National Institute of General Medical Sciences from the National Institutes of Health (P41 GM103403) and by an NIH-ORIP HEI grant (S10 RR029205).
Footnotes
Competing Financial Interests Statement:
FS and DD are founders and consultants for Repare Therapeutics. Host institutions LTRI and OICR have filed a patent relating to the PROTAC molecules presented in this study and their uses (pending USPA No. 62/812,567, Applicants are GP2, GP1 and FS). No competing interests were disclosed by the other authors.
References:
- 1.Lavoie H & Therrien M Regulation of RAF protein kinases in ERK signalling. Nat Rev Mol Cell Biol 16, 281–98 (2015). [DOI] [PubMed] [Google Scholar]
- 2.Simanshu DK, Nissley DV & McCormick F RAS Proteins and Their Regulators in Human Disease. Cell 170, 17–33 (2017). [DOI] [PMC free article] [PubMed] [Google Scholar]
- 3.Terrell EM & Morrison DK Ras-Mediated Activation of the Raf Family Kinases. Cold Spring Harb Perspect Med 9(2019). [DOI] [PMC free article] [PubMed] [Google Scholar]
- 4.Nazarian R et al. Melanomas acquire resistance to B-RAF(V600E) inhibition by RTK or N-RAS upregulation. Nature 468, 973–7 (2010). [DOI] [PMC free article] [PubMed] [Google Scholar]
- 5.Kemper K et al. BRAF(V600E) Kinase Domain Duplication Identified in Therapy-Refractory Melanoma Patient-Derived Xenografts. Cell Rep 16, 263–277 (2016). [DOI] [PMC free article] [PubMed] [Google Scholar]
- 6.Poulikakos PI et al. RAF inhibitor resistance is mediated by dimerization of aberrantly spliced BRAF(V600E). Nature 480, 387–90 (2011). [DOI] [PMC free article] [PubMed] [Google Scholar]
- 7.Poulikakos PI & Rosen N Mutant BRAF melanomas--dependence and resistance. Cancer Cell 19, 11–5 (2011). [DOI] [PubMed] [Google Scholar]
- 8.Haarberg HE & Smalley KS Resistance to Raf inhibition in cancer. Drug Discov Today Technol 11, 27–32 (2014). [DOI] [PMC free article] [PubMed] [Google Scholar]
- 9.Rajakulendran T, Sahmi M, Lefrancois M, Sicheri F & Therrien M A dimerization-dependent mechanism drives RAF catalytic activation. Nature 461, 542–5 (2009). [DOI] [PubMed] [Google Scholar]
- 10.Thevakumaran N et al. Crystal structure of a BRAF kinase domain monomer explains basis for allosteric regulation. Nat Struct Mol Biol 22, 37–43 (2015). [DOI] [PubMed] [Google Scholar]
- 11.Lavoie H et al. Inhibitors that stabilize a closed RAF kinase domain conformation induce dimerization. Nat Chem Biol 9, 428–36 (2013). [DOI] [PMC free article] [PubMed] [Google Scholar]
- 12.Karoulia Z et al. An Integrated Model of RAF Inhibitor Action Predicts Inhibitor Activity against Oncogenic BRAF Signaling. Cancer Cell 30, 485–498 (2016). [DOI] [PMC free article] [PubMed] [Google Scholar]
- 13.Yao Z et al. BRAF Mutants Evade ERK-Dependent Feedback by Different Mechanisms that Determine Their Sensitivity to Pharmacologic Inhibition. Cancer Cell 28, 370–83 (2015). [DOI] [PMC free article] [PubMed] [Google Scholar]
- 14.Peng SB et al. Inhibition of RAF Isoforms and Active Dimers by LY3009120 Leads to Anti-tumor Activities in RAS or BRAF Mutant Cancers. Cancer Cell 28, 384–98 (2015). [DOI] [PubMed] [Google Scholar]
- 15.Sakamoto KM et al. Protacs: chimeric molecules that target proteins to the Skp1-Cullin-F box complex for ubiquitination and degradation. Proc Natl Acad Sci U S A 98, 8554–9 (2001). [DOI] [PMC free article] [PubMed] [Google Scholar]
- 16.Pettersson M & Crews CM PROteolysis TArgeting Chimeras (PROTACs) - Past, present and future. Drug Discov Today Technol 31, 15–27 (2019). [DOI] [PMC free article] [PubMed] [Google Scholar]
- 17.Paiva SL & Crews CM Targeted protein degradation: elements of PROTAC design. Curr Opin Chem Biol 50, 111–119 (2019). [DOI] [PMC free article] [PubMed] [Google Scholar]
- 18.Waizenegger IC et al. A Novel RAF Kinase Inhibitor with DFG-Out-Binding Mode: High Efficacy in BRAF-Mutant Tumor Xenograft Models in the Absence of Normal Tissue Hyperproliferation. Mol Cancer Ther 15, 354–65 (2016). [DOI] [PubMed] [Google Scholar]
- 19.Lu J et al. Hijacking the E3 Ubiquitin Ligase Cereblon to Efficiently Target BRD4. Chem Biol 22, 755–63 (2015). [DOI] [PMC free article] [PubMed] [Google Scholar]
- 20.Buckley DL et al. Small-molecule inhibitors of the interaction between the E3 ligase VHL and HIF1alpha. Angew Chem Int Ed Engl 51, 11463–7 (2012). [DOI] [PMC free article] [PubMed] [Google Scholar]
- 21.Buckley DL et al. HaloPROTACS: Use of Small Molecule PROTACs to Induce Degradation of HaloTag Fusion Proteins. ACS Chem Biol 10, 1831–7 (2015). [DOI] [PMC free article] [PubMed] [Google Scholar]
- 22.Douglass EF Jr., Miller CJ, Sparer G, Shapiro H & Spiegel DA A comprehensive mathematical model for three-body binding equilibria. J Am Chem Soc 135, 6092–9 (2013). [DOI] [PMC free article] [PubMed] [Google Scholar]
- 23.Nissan MH et al. Loss of NF1 in cutaneous melanoma is associated with RAS activation and MEK dependence. Cancer Res 74, 2340–50 (2014). [DOI] [PMC free article] [PubMed] [Google Scholar]
- 24.Corcoran RB et al. EGFR-mediated re-activation of MAPK signaling contributes to insensitivity of BRAF mutant colorectal cancers to RAF inhibition with vemurafenib. Cancer Discov 2, 227–35 (2012). [DOI] [PMC free article] [PubMed] [Google Scholar]
- 25.Prahallad A et al. Unresponsiveness of colon cancer to BRAF(V600E) inhibition through feedback activation of EGFR. Nature 483, 100–3 (2012). [DOI] [PubMed] [Google Scholar]
- 26.Drosten M et al. Genetic analysis of Ras signalling pathways in cell proliferation, migration and survival. EMBO J 29, 1091–104 (2010). [DOI] [PMC free article] [PubMed] [Google Scholar]
- 27.Chung CI, Zhang Q & Shu X Dynamic Imaging of Small Molecule Induced Protein-Protein Interactions in Living Cells with a Fluorophore Phase Transition Based Approach. Anal Chem 90, 14287–14293 (2018). [DOI] [PMC free article] [PubMed] [Google Scholar]
- 28.Haling JR et al. Structure of the BRAF-MEK complex reveals a kinase activity independent role for BRAF in MAPK signaling. Cancer Cell 26, 402–413 (2014). [DOI] [PubMed] [Google Scholar]
- 29.Lavoie H et al. MEK drives BRAF activation through allosteric control of KSR proteins. Nature 554, 549–553 (2018). [DOI] [PMC free article] [PubMed] [Google Scholar]
- 30.Medard G et al. Optimized chemical proteomics assay for kinase inhibitor profiling. J Proteome Res 14, 1574–86 (2015). [DOI] [PubMed] [Google Scholar]
- 31.Zhang L et al. Characterization of the novel broad-spectrum kinase inhibitor CTx-0294885 as an affinity reagent for mass spectrometry-based kinome profiling. J Proteome Res 12, 3104–16 (2013). [DOI] [PubMed] [Google Scholar]
- 32.Park E et al. Architecture of autoinhibited and active BRAF-MEK1–14-3–3 complexes. Nature (2019). [DOI] [PMC free article] [PubMed] [Google Scholar]
- 33.Kondo Y et al. Cryo-EM structure of a dimeric B-Raf:14–3-3 complex reveals asymmetry in the active sites of B-Raf kinases. Science 366, 109–115 (2019). [DOI] [PMC free article] [PubMed] [Google Scholar]
Methods References:
- 34.Tsai J et al. Discovery of a selective inhibitor of oncogenic B-Raf kinase with potent antimelanoma activity. Proc Natl Acad Sci U S A 105, 3041–6 (2008). [DOI] [PMC free article] [PubMed] [Google Scholar]
- 35.Assadieskandar A et al. Rigidification Dramatically Improves Inhibitor Selectivity for RAF Kinases. ACS Med Chem Lett 10, 1074–1080 (2019). [DOI] [PMC free article] [PubMed] [Google Scholar]
- 36.Subedi GP, Johnson RW, Moniz HA, Moremen KW & Barb A High Yield Expression of Recombinant Human Proteins with the Transient Transfection of HEK293 Cells in Suspension. J Vis Exp, e53568 (2015). [DOI] [PMC free article] [PubMed] [Google Scholar]
- 37.Kabsch W Xds. Acta Crystallogr D Biol Crystallogr 66, 125–32 (2010). [DOI] [PMC free article] [PubMed] [Google Scholar]
- 38.Assadieskandar A et al. Effects of rigidity on the selectivity of protein kinase inhibitors. Eur J Med Chem 146, 519–528 (2018). [DOI] [PMC free article] [PubMed] [Google Scholar]
- 39.McCoy AJ et al. Phaser crystallographic software. J Appl Crystallogr 40, 658–674 (2007). [DOI] [PMC free article] [PubMed] [Google Scholar]
- 40.Moriarty NW, Grosse-Kunstleve RW & Adams PD electronic Ligand Builder and Optimization Workbench (eLBOW): a tool for ligand coordinate and restraint generation. Acta Crystallogr D Biol Crystallogr 65, 1074–80 (2009). [DOI] [PMC free article] [PubMed] [Google Scholar]
- 41.Emsley P & Cowtan K Coot: model-building tools for molecular graphics. Acta Crystallogr D Biol Crystallogr 60, 2126–32 (2004). [DOI] [PubMed] [Google Scholar]
- 42.Adams PD et al. PHENIX: a comprehensive Python-based system for macromolecular structure solution. Acta Crystallogr D Biol Crystallogr 66, 213–21 (2010). [DOI] [PMC free article] [PubMed] [Google Scholar]
- 43.Cox J & Mann M MaxQuant enables high peptide identification rates, individualized p.p.b.-range mass accuracies and proteome-wide protein quantification. Nat Biotechnol 26, 1367–72 (2008). [DOI] [PubMed] [Google Scholar]
- 44.Cox J et al. Andromeda: a peptide search engine integrated into the MaxQuant environment. J Proteome Res 10, 1794–805 (2011). [DOI] [PubMed] [Google Scholar]
- 45.Cox J et al. Accurate proteome-wide label-free quantification by delayed normalization and maximal peptide ratio extraction, termed MaxLFQ. Mol Cell Proteomics 13, 2513–26 (2014). [DOI] [PMC free article] [PubMed] [Google Scholar]
- 46.Ritz C, Baty F, Streibig JC & Gerhard D Dose-Response Analysis Using R. PLoS One 10, e0146021 (2015). [DOI] [PMC free article] [PubMed] [Google Scholar]
- 47.Wingett SW & Andrews S FastQ Screen: A tool for multi-genome mapping and quality control. F1000Res 7, 1338 (2018). [DOI] [PMC free article] [PubMed] [Google Scholar]
- 48.Ewels P, Magnusson M, Lundin S & Kaller M MultiQC: summarize analysis results for multiple tools and samples in a single report. Bioinformatics 32, 3047–8 (2016). [DOI] [PMC free article] [PubMed] [Google Scholar]
- 49.Trapnell C, Pachter L & Salzberg SL TopHat: discovering splice junctions with RNA-Seq. Bioinformatics 25, 1105–11 (2009). [DOI] [PMC free article] [PubMed] [Google Scholar]
- 50.Langmead B, Trapnell C, Pop M & Salzberg SL Ultrafast and memory-efficient alignment of short DNA sequences to the human genome. Genome Biol 10, R25 (2009). [DOI] [PMC free article] [PubMed] [Google Scholar]
- 51.Li H et al. The Sequence Alignment/Map format and SAMtools. Bioinformatics 25, 2078–9 (2009). [DOI] [PMC free article] [PubMed] [Google Scholar]
- 52.Liu Y et al. Next-generation RNA sequencing of archival formalin-fixed paraffin-embedded urothelial bladder cancer. Eur Urol 66, 982–6 (2014). [DOI] [PubMed] [Google Scholar]
- 53.Galili T, O’Callaghan A, Sidi J & Sievert C heatmaply: an R package for creating interactive cluster heatmaps for online publishing. Bioinformatics 34, 1600–1602 (2018). [DOI] [PMC free article] [PubMed] [Google Scholar]
- 54.Love MI, Huber W & Anders S Moderated estimation of fold change and dispersion for RNA-seq data with DESeq2. Genome Biol 15, 550 (2014). [DOI] [PMC free article] [PubMed] [Google Scholar]
Associated Data
This section collects any data citations, data availability statements, or supplementary materials included in this article.
Supplementary Materials
Data Availability Statement
Coordinates and structure factors (6UUO) are available at the Protein Data Bank, www.rcsb.org.
“The kinase inhibitor competition data used for the protein kinase-biased analysis was also submitted as an incomplete submission to the MassIVE respository (https://massive.ucsd.edu/ProteoSAFe/static/massive.jsp) and assigned the accession number MSV000085271. The dataset is available at ftp://massive.ucsd.edu/MSV000085271/ ”
“Data for the proteome-wide protein level analysis has been deposited as an incomplete submission to the MassIVE repository (https://massive.ucsd.edu/ProteoSAFe/static/massive.jsp) and assigned the accession number MSV000084551. The dataset is available at ftp://massive.ucsd.edu/MSV000084551/”
The RNAseq data reported in this paper are available at the Gene Expression Omnibus database (GEO) with Accession number GSE148500.
All data supporting the findings are available in the paper and Supplementary Information files.