Abstract
Purpose
Anxiety disorder is one of the psychiatric disorders that involves extreme fear or worry, which can change the balance of chemicals in the brain. To the best of our knowledge, the evaluation of anxiety state is still based on some subjective questionnaires and there is no objective standard assessment yet. Unlike other methods, our approach focuses on study the neural changes to identify and classify the anxiety state using electroencephalography (EEG) signals.
Methods
We designed a closed neurofeedback experiment that contains three experimental stages to adjust subjects’ mental state. The EEG resting state signal was recorded from thirty-four subjects in the first and third stages while EEG-based mindfulness recording was recorded in the second stage. At the end of each stage, the subjects were asked to fill a Visual Analogue Scale (VAS). According to their VAS score, the subjects were classified into three groups: non-anxiety, moderate or severe anxiety groups.
Results
After processing the EEG data of each group, support vector machine (SVM) classifiers were able to classify and identify two mental states (non-anxiety and anxiety) using the Power Spectral Density (PSD) as patterns. The highest classification accuracies using Gaussian kernel function and polynomial kernel function are 92.48 ± 1.20% and 88.60 ± 1.32%, respectively. The highest average of the classification accuracies for healthy subjects is 95.31 ± 1.97% and for anxiety subjects is 87.18 ± 3.51%.
Conclusions
The results suggest that our proposed EEG neurofeedback-based classification approach is efficient for developing affective BCI system for detection and evaluation of anxiety disorder states.
Keywords: Anxiety state, Multi-class EEG classification, Affective BCI, Neurofeedback
Introduction
An affective BCI is an integrated hardware/software system that uses neurophysiological signals (e.g., electroencephalography (EEG) signal) to extract brain features that are related to affective states (e.g., emotions and moods). This affective BCI is now being incorporated into the treatment, offering the promise of a greatly enhanced quality of life by developing cognitive prosthetics for many psychiatric diseases such as anxiety. Anxiety state is one of emotional states, which Charles D. Spielberger (a clinical community psychologist) defined as the subjective feelings of tension and fear. These anxiety emotions are related to the stimulation of the nervous system [1]. Anxiety disorders can be mainly divided into generalized anxiety disorder (GAD), panic disorder (PD) and social anxiety disorder (SAD). The lifetime prevalence of generalized anxiety disorder worldwide is estimated around 3–5% [2]. Generalized anxiety disorder also associated with serious social and occupational injuries, comorbidity with other diseases, and an increased risk of suicide [3]. Clinical manifestations of generalized anxiety disorder are mostly accompanied by a series of physical symptoms such as tremor, muscle pain, sweating, abdominal discomfort, dizziness, and mental disorder like restlessness, insomnia, inattention, memory difficulties, irritability, extreme sensitivity to things, palpitation [4]. Due to so many clinical manifestations, most of the anxiety patients have not been diagnosed, nor have they received good treatment [5].
Whether a patient suffer from anxiety disorders can be judged by professional psychiatrists according to clinical experience and some questionnaire scales like GAD-17. The design of some questionnaire scales is complicated, and the subjects become restless during the process of filling in and wish to finish the questionnaire quickly. How can such a questionnaire accurately assess the state of the subjects? How serious of anxiety states were evaluated by GAD-17 questionnaire scores [6]. Traditional medicine and psychotherapy are used for treatment of confirmed anxiety patients, but previous researches showed that the therapeutic effect of drug was not so good [7–11]. It is advocated to choose the staged treatment according to the severity of anxiety symptoms [12]. Therefore, one of most important problems is the evaluation of the effect of various treatment methods. The treatment effect for the patients here refers to the change of anxiety level. For instance, some severe patients become better after a period of anti-anxiety treatment. The traditional discrimination methods are still based on some questionnaires, scales and clinical experience of doctor. Although the questions in the questionnaire scale are designed as sensitive and specific [13], the results of these scales are often subjective and lack of an objective index to judge. Which kind of biomarker is sensitive with treatment effect, and can quickly reflects to mental states of the patient? In addition, diagnosis bias also exists due to the different abilities of doctors. In a large-scale study of patients and their primary diagnosis from the health care doctors, the diagnosis errors of anxiety disorders were corrected, accounting for 34% [14]. In another study, 65% of patients with pure depression were diagnosed as anxiety disorder, while only 23% of patients with pure anxiety disorder can be diagnosed as anxiety disorder [15]. How to find an effective biomarker for accurately diagnose the state of anxiety and evaluation of treatment effect is still an opening question.
In this paper, we designed a neural feedback system based on Alpha-band oscillations (frequency power) of electroencephalography signals. The subjects with anxiety disorder were recruited, and divided into anxiety moderate and severe states according to their scores of the visual simulation scale. Healthy subjects also joined this experiment, and their mental state was defined as non- anxiety states. The electroencephalography signals were recorded and analyzed. The experiment results showed that the level of anxiety states can be classified from brain activity during the neural feedback experiment. With the help of our designed neurofeedback system, we can predict and classify anxiety states by collecting electroencephalography data of subjects. In this paper, we aim to relieve anxiety through EEG-based neurofeedback experiments and not to introduce a novel neurofeedback system.
Method
Subjects
In this study, thirty-four subjects, 17 anxiety disorder subjects (37 ± 7.61 years) and 17 healthy subjects (24.41 ± 1.49 years), participated this experiment. They have normal hearing ability, and have not received mindfulness recording treatment or training before. These anxiety subjects were judged by professional psychiatrists in Beijing Anding Hospital, Capital Medical University. Healthy subjects were the under graduated students. Before the experiment, the subjects were instructed to read and sign the informed consent form with the detailed personal information. The subjects were classified into healthy or anxious subjects. These anxious subjects are pure anxiety patients. All subjects participated to our experiments at psychiatric hospital with their consent. The inclusion criteria were selected by professional psychiatrists to judge and evaluate whether they are qualified to participate in our experiment. If the subjects of depression participate in this experiment, follow-up study is needed.
Experiment Paradigm and Data Recording
The participants were required to sit in a chair facing a desktop computer. As shown in Fig. 1, the paradigm includes three stages. In the first stage, the subjects were required to keep themselves in emotional stability for 5 min. The mindfulness recording was played in the second stage; the subjects followed the mindfulness recording to adjust their mental state according to the sound prompts for 8 min. Finally, the subjects continued to return to the resting state for 5 min. In our experiment, the all subjects were required to have eyes open and not to close their eyes. During the three small experimental stages, the subjects needed to complete the self-evaluation of anxiety degree. Each subject was asked to fill in the visual analog scale, which was composed of a graduated axis marked with the number 0–10. 0–4 was defined as non-anxiety, 5–7 as moderate anxiety and 8–10 as severe anxiety.
Fig. 1.

Experimental paradigm of the proposed affective brain–computer interface
The 32-channel electroencephalography signals (Brain Products, Germany) were recorded from the scalp of the participants during the experiment. The FP1, F3, F7 electrodes of the left frontal lobe and FP2, F4, F8 electrodes of the right frontal lobe were selected as the data source electrodes according to the international 10–20 system for the identification of anxiety state. The electrodes Fz and Cz were used as reference electrode. The scalp potential distribution of the electrode cap is shown in Fig. 2, in which the blue-marked electrode are the electrodes of the frontal lobe, and the reference electrodes are green-marked parts. During data recording, the impedance of each electrode was kept below 5 KΩ. The electroencephalography data was collected at the sampling rate of 500 Hz.
Fig. 2.
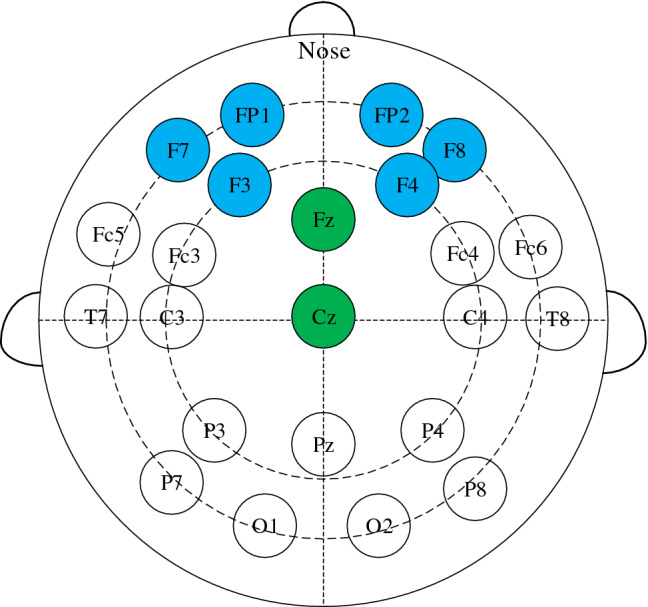
EEG electrode placement based on 10–20 international system. Scalp potential and reference point distribution of left and right frontal lobe
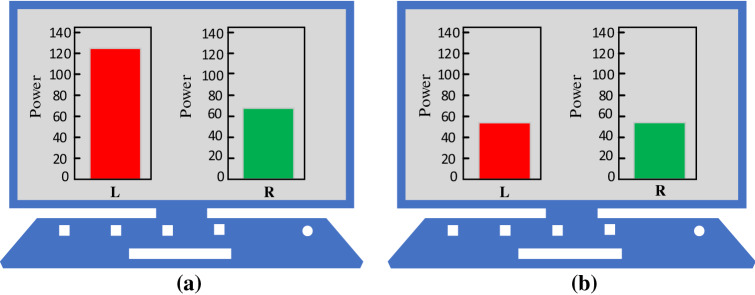
During the whole experiment, the alpha band power of electrode located in the left and right frontal lobe [16] were calculated in real time and displayed as feedback to build a neural feedback system. The energy of the signal was visualized as red and blue bar to show the energy asymmetry in the frontal lobe. The red bar chart represents the energy value of α wave on the left side of the frontal lobe. The green bar chart represents the energy value of α wave on the right side of the frontal lobe. The subjects could see the change of the visual bar, and try to adjust their mental state during mindfulness training. As shown in Fig. 3a, there were some differences between power of left and right side before mindfulness training. After training, the difference of power reduced in some subjects and was showed in Fig. 3b.
Fig. 3.
Subject neuro feedback presentation using energy change diagram of left and right frontal lobe
EEG Data Processing
Because there are many noise artifacts such as electrocardiogram (ECG), electromyogram (EMG) and power frequency interference in electroencephalography signals, it is necessary to preprocess the raw EEG signal to get relatively pure brain activity. In this paper, independent component analysis method (ICA) [17] is used to remove artifacts of eye movement. Butterworth bandpass filter is used to remove power frequency interference, and then 1–45 Hz electroencephalography data is obtained. The power spectral density [18, 19] is selected as the feature eigenvector.
| 1 |
| 2 |
where, is Fourier transform of the sequence x (n). Because the period of is N, the power spectrum estimation obtained takes N as the period.
As shown in Fig. 4, the average power spectral density of the six leads in the second stage of the experiment is lower than that in the first stage of the experiment.
Fig. 4.
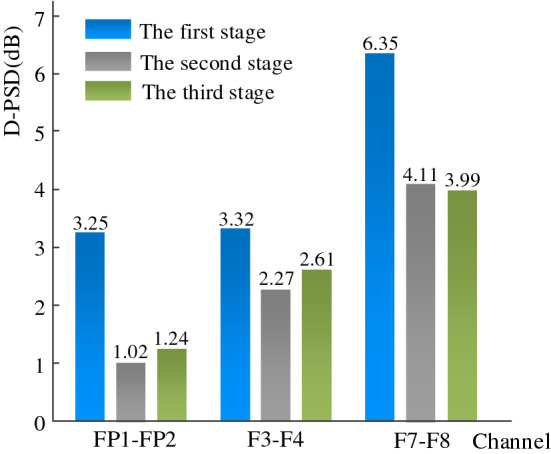
The D-PSD of FP1, FP2, F3, F4, F7 and F8 in the three stages of the experiment
The third stage is also lower than the first stage, it can be seen that using mindfulness can balance the left- and right-side energy asymmetry.
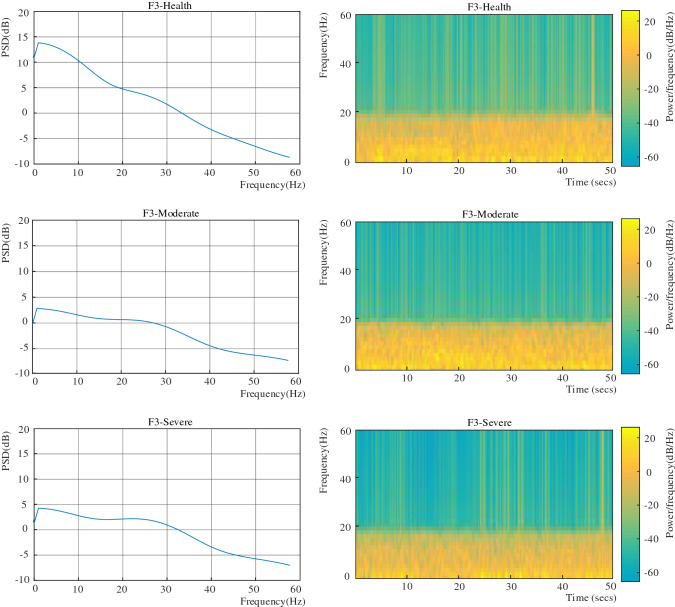
The power spectral density of six channels and the corresponding time–frequency diagrams are selected to calculate anxiety. Through the Fig. 5, we can see a visible peak around 10 Hz. Electroencephalography rhythm is usually divided into δ (1 –4 Hz), θ (4–8 Hz), α (8–13 Hz), β1 (13–20 Hz) and β2 (20–30 Hz). In order to avoid missing relevant information, the power spectral density data of 0–60 Hz were selected as the characteristics in this study.
Fig. 5.
The power spectral density of anxiety and corresponding time–frequency diagrams of non-anxiety (healthy) state, moderate anxiety state and severe anxiety state
In the three stages of our experiment, the visual analog scale scores of healthy subjects were very low, and they were all in non-anxiety state. However, the scores of visual analog scale of anxiety subjects in the first stage of the experiment were in severe anxiety, and the scores of visual analog scale in the second and third stages of the experiment were in moderate anxiety. Therefore, the data source of F3-Health in Fig. 5 is the third stage of healthy subjects. The data source of F3-Moderate is the experimental data of the second stage of anxious subjects and the F3-Severe is the data of the first stage of anxious subjects.
Our results can be obtained by analyzing the EEG data of lead F3. Combining the time–frequency graph and power spectral density graph of the power spectral density, it can be seen that when the frequency is lower than 20 Hz, the healthy subjects (non-anxious state) show the amplitude of the power spectral density is generally higher than that of the anxious subjects (moderate and severe states). There is no difference between the three states when the EEG frequency exceed 20 Hz.
Anxiety State Classification Method
After preprocessing and feature extraction of the original electroencephalography signals, the feature matrix is used as the input of the classifier to realize the recognition of anxiety state. Support vector machine (SVM) [20–25] is employed as classification method. The main idea of support vector machine is to map the input to high dimensional space with the help of kernel function, and find a hyperplane for classification.
| 3 |
where is normal vector and is bias of the separation hyperplane. The decision hyper-plane can be found by solving the following optimizing problem.
In this paper, we address the three-classification problem of anxiety state, which is necessary to choose an appropriate multi-classification algorithm to realize the problem of multi-classification. At present, the commonly used multi-classification methods are one-vs-one [26, 27] (OVO) and one-vs-rest (OVR) [28]. The algorithm idea of one-vs-one is that for N categories to be classified, the pairwise combination of these N categories becomes a two-classification problem. After the combination, we can get classifiers. During the test, these classifiers can produce binary classification results. Finally, the most predicted categories in these two classification results are taken as the prediction categories of the final N classification. The implementation of one-vs-rest’s algorithm is that in the problem of N classification, one class is regarded as a positive class each time, and the other categories are regarded as a negative class. There are a total of N classifiers. In the test, the class marks corresponding to the classifiers predicted to be positive classes are taken as the final classification results.
Empirical Results
In this study, a total of 34 subjects were collected. Studies have shown that the frontal lobe is closely related to people's emotional and mental state [16, 29]. Therefore, the electroencephalography data of leads FP1, F3, F7, FP2, F4 and F8 located in the frontal lobe are selected as the data that each subject needs to process. In two seconds, the feature is calculated respectively after preprocessing, the total data length is 4 min, and 6120 data samples are finally formed. Therefore, there are 2040 samples in non-anxiety state, 2040 samples in moderate state of anxiety and 2040 samples in severe state of anxiety. The feature matrix calculated by these samples is input to the support vector machine classifier as input, and the classification results will be further displayed and discussed. In this study, Gaussian and polynomial kernels are selected as the kernel functions of support vector machine; moreover, one-vs-rest and one-vs-one multi-classification algorithms are selected.
Immediately after this article, we made predictions on the accuracy of each subject. For the sake of distinction, the healthy subjects (the first stage of experiment) are marked as S1–S17, and the anxious subjects are marked as S18–S34 (the first stage of experiment) and S35–S51 (the third stage of experiment). Among them, each subject has 120 samples and the samples of each subject is divided into a training set and a test set according to 4:1. There are 96 samples of each subject as the test set, and the remaining 24 samples are classified into the training set.
The result of prediction accuracy for each subject is also our concern and it is great significance for practical application. Tables 1, 2 and 3 are the prediction accuracy results for each of the subjects. It can be seen from the table that the average highest prediction accuracy for healthy subjects is 97.70 ± 3.32%, and the highest accuracy for anxious subjects is 92.29 ± 4.44%. It is inevitable that some unpredictable factors may cause great fluctuation of the prediction results. Participants' degree of cooperation and attitude towards the experiment will also cause differences in classification results.
Table 1.
Prediction accuracy of healthy subjects (%) (Before mindfulness adjustment)
| Subject | RBF + OVO | RBF + OVR | Polynomial + OVO | Polynomial + OVR |
|---|---|---|---|---|
| S1 | 98.12 ± 1.54 | 97.29 ± 3.21 | 97.50 ± 5.12 | 97.70 ± 3.32 |
| S2 | 95.41 ± 3.71 | 97.08 ± 2.59 | 91.8 ± 3.72 | 92.70 ± 4.75 |
| S3 | 92.08 ± 6.64 | 92.50 ± 6.48 | 84.16 ± 5.58 | 88.33 ± 3.07 |
| S4 | 88.75 ± 3.92 | 91.45 ± 2.28 | 75.20 ± 3.12 | 79.16 ± 2.25 |
| S5 | 86.87 ± 8.91 | 88.95 ± 8.77 | 86.87 ± 5.48 | 90.41 ± 4.50 |
| S6 | 86.87 ± 2.59 | 88.95 ± 3.85 | 83.33 ± 11.68 | 84.79 ± 13.52 |
| S7 | 85.00 ± 5.28 | 85.41 ± 6.14 | 73.12 ± 6.54 | 71.45 ± 3.15 |
| S8 | 85.00 ± 14.77 | 85.62 ± 14.06 | 75.62 ± 12.85 | 78.54 ± 10.21 |
| S9 | 84.16 ± 4.45 | 85.62 ± 2.71 | 88.33 ± 2.71 | 88.95 ± 13.97 |
| S10 | 80.20 ± 10.31 | 80.00 ± 10.62 | 78.95 ± 4.80 | 81.25 ± 8.30 |
| S11 | 80.20 ± 19.72 | 80.83 ± 21.84 | 73.54 ± 13.55 | 76.04 ± 14.67 |
| S12 | 78.95 ± 9.12 | 81.25 ± 6.54 | 77.29 ± 7.21 | 74.79 ± 6.68 |
| S13 | 78.54 ± 9.56 | 80.41 ± 11.16 | 80.83 ± 6.62 | 81.04 ± 8.75 |
| S14 | 78.54 ± 7.04 | 78.54 ± 5.63 | 66.25 ± 4.12 | 69.16 ± 4.10 |
| S15 | 76.25 ± 7.27 | 77.70 ± 7.15 | 66.45 ± 4.25 | 67.08 ± 5.12 |
| S16 | 72.29 ± 3.40 | 72.08 ± 5.87 | 61.04 ± 5.13 | 60.41 ± 5.89 |
| S17 | 72.08 ± 11.72 | 74.58 ± 7.45 | 73.95 ± 9.12 | 76.45 ± 8.38 |
| Average | 83.49 ± 7.21 | 84.60 ± 7.16 | 78.49 ± 9.27 | 79.90 ± 9.57 |
Table 2.
Prediction accuracy of anxious subjects (%) (Before mindfulness adjustment)
| Subject | RBF + OVO | RBF + OVR | Polynomial + OVO | Polynomial + OVR |
|---|---|---|---|---|
| S18 | 92.29 ± 4.44 | 92.08 ± 3.48 | 86.87 ± 8.38 | 87.70 ± 6.48 |
| S19 | 91.25 ± 5.68 | 92.29 ± 3.57 | 84.79 ± 6.77 | 88.33 ± 7.23 |
| S20 | 87.70 ± 12.77 | 88.75 ± 13.87 | 76.87 ± 4.80 | 75.83 ± 6.00 |
| S21 | 87.29 ± 7.31 | 89.79 ± 6.81 | 76.04 ± 13.59 | 76.66 ± 12.00 |
| S22 | 85.62 ± 3.93 | 85.20 ± 2.94 | 75.00 ± 3.86 | 76.66 ± 4.39 |
| S23 | 84.37 ± 7.66 | 83.33 ± 9.36 | 78.75 ± 6.02 | 77.91 ± 6.85 |
| S24 | 83.33 ± 8.73 | 83.54 ± 10.37 | 80.41 ± 8.11 | 77.29 ± 11.25 |
| S25 | 81.87 ± 6.39 | 80.00 ± 6.93 | 81.04 ± 3.34 | 78.12 ± 4.07 |
| S26 | 79.37 ± 5.34 | 79.16 ± 7.27 | 73.95 ± 3.15 | 72.50 ± 4.25 |
| S27 | 78.95 ± 7.20 | 77.70 ± 6.60 | 71.45 ± 4.25 | 70.83 ± 2.48 |
| S28 | 78.95 ± 6.27 | 79.58 ± 7.01 | 70.00 ± 5.15 | 70.20 ± 5.29 |
| S29 | 78.95 ± 6.53 | 78.33 ± 6.42 | 69.58 ± 6.93 | 66.45 ± 5.95 |
| S30 | 74.16 ± 9.33 | 73.75 ± 9.59 | 68.33 ± 6.00 | 64.58 ± 5.58 |
| S31 | 73.54 ± 9.44 | 73.54 ± 9.00 | 68.33 ± 7.12 | 68.54 ± 7.95 |
| S32 | 72.08 ± 3.45 | 71.25 ± 3.92 | 65.62 ± 3.12 | 63.95 ± 2.65 |
| S33 | 71.87 ± 6.48 | 71.04 ± 6.44 | 67.70 ± 7.82 | 62.91 ± 3.07 |
| S34 | 71.04 ± 9.58 | 71.87 ± 8.33 | 68.12 ± 3.50 | 66.45 ± 3.71 |
| Average | 80.74 ± 6.57 | 80.66 ± 6.96 | 74.28 ± 6.22 | 73.23 ± 7.38 |
Table 3.
Prediction accuracy of anxious subjects (%) (After mindfulness adjustment)
| Subject | RBF + OVO | RBF + OVR | Polynomial + OVO | Polynomial + OVR |
|---|---|---|---|---|
| S35 | 87.29 ± 7.08 | 88.12 ± 6.40 | 76.87 ± 10.30 | 78.33 ± 10.14 |
| S36 | 85.41 ± 7.81 | 85.20 ± 8.68 | 80.00 ± 9.63 | 78.95 ± 6.57 |
| S37 | 84.79 ± 5.02 | 85.20 ± 5.96 | 78.95 ± 3.78 | 77.91 ± 6.98 |
| S38 | 84.58 ± 8.69 | 84.16 ± 8.96 | 69.58 ± 10.05 | 66.45 ± 9.81 |
| S39 | 83.33 ± 12.91 | 84.79 ± 10.1 | 80.00 ± 11.02 | 82.91 ± 10.22 |
| S40 | 81.87 ± 10.75 | 81.87 ± 7.96 | 75.20 ± 11.09 | 75.00 ± 15.87 |
| S41 | 81.04 ± 5.33 | 80.83 ± 4.90 | 80.20 ± 8.08 | 82.29 ± 4.97 |
| S42 | 80.41 ± 17.71 | 81.25 ± 15.75 | 80.62 ± 3.89 | 75.83 ± 6.44 |
| S43 | 79.79 ± 6.40 | 81.25 ± 6.05 | 70.20 ± 4.75 | 67.29 ± 5.34 |
| S44 | 79.37 ± 9.81 | 79.58 ± 10.73 | 69.58 ± 9.27 | 66.25 ± 8.88 |
| S45 | 78.12 ± 4.06 | 75.83 ± 4.06 | 72.29 ± 2.13 | 66.87 ± 4.39 |
| S46 | 77.91 ± 11.46 | 76.66 ± 11.71 | 71.04 ± 8.15 | 68.95 ± 8.11 |
| S47 | 76.45 ± 2.55 | 75.41 ± 3.34 | 77.08 ± 4.16 | 75.83 ± 5.59 |
| S48 | 75.00 ± 3.07 | 71.87 ± 2.37 | 69.79 ± 6.18 | 66.45 ± 4.88 |
| S49 | 74.37 ± 6.64 | 74.16 ± 5.92 | 72.91 ± 4.54 | 69.37 ± 5.89 |
| S50 | 73.54 ± 6.93 | 73.12 ± 7.96 | 68.33 ± 12.20 | 68.54 ± 7.89 |
| S51 | 72.91 ± 6.09 | 71.87 ± 7.19 | 71.66 ± 4.88 | 70.20 ± 4.10 |
| Average | 79.77 ± 4.27 | 79.48 ± 5.00 | 74.37 ± 4.32 | 72.79 ± 5.69 |
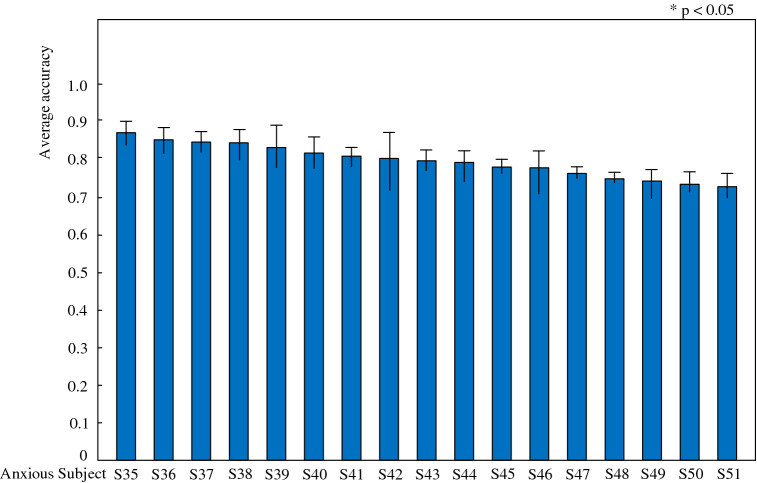
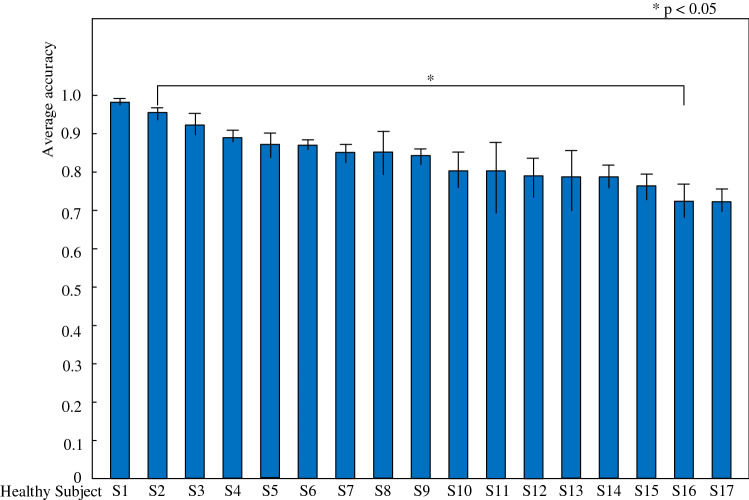
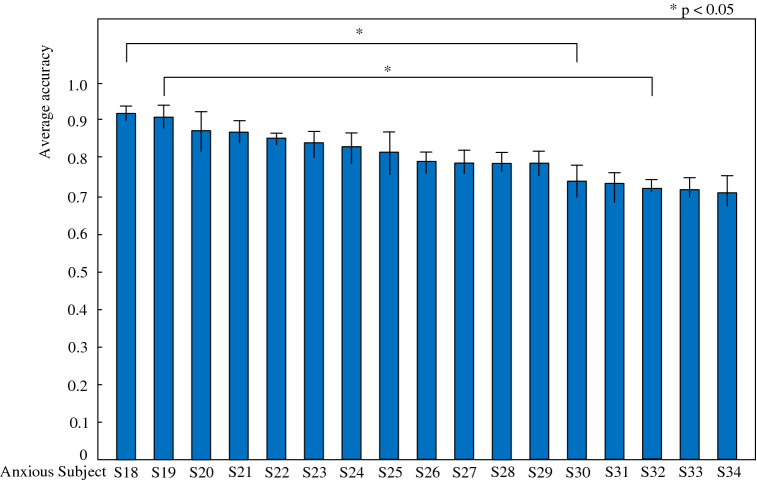
The average classification accuracy rate obtained by using the model RBF + OVO is very effective, so the classification accuracy rate obtained by the model is used for significance analysis. A one-way ANOVA is also applied to analyze classification accuracy for the healthy subjects, and the significant differences of healthy subjects is observed (F16, 68 = 2.942, p = 0.001). A one-way ANOVA is then applied to analyze classification accuracy for the anxious subjects, and significant differences are observed (F16, 64 = 3.776, p < 0.0001) and (F16, 68 = 1.282, p = 0.2341). Healthy subjects are numbered “S1–S17”, anxious subjects are numbered “S18–S34” for the first experimental stage, and anxious subjects are numbered “S35–S51” for the third experimental stage. There are significant differences between healthy subjects “S16, S17” and “S1, S2” by multiple comparisons. There are significant differences between “S18” and “S30–S34” in the first experimental stage of anxiety subjects, and there are also significant differences between “S19" and “S32, S33, and S34”. No significant difference was found in the third experimental stage of anxiety subjects. And the results were shown in Fig. 8. Figures 6 and 7 have marked these differences. The accuracy of topics S1–S17, S18–S34 and S35–S51 decreased in turn. Because of the large number of subjects, the order of subjects is specially sorted according to the size of classification results. The purpose of descending order is to mark the significant difference of classification accuracy between subjects in the graph.
Fig. 8.
Anxious subjects classification result statistical analysis (After mindfulness adjustment)
Fig. 6.
Healthy subjects classification result statistical analysis (Before mindfulness adjustment)
Fig. 7.
Anxious subjects classification result statistical analysis (Before mindfulness adjustment)
In our experimental results, the accuracy of the health group and the anxiety group were statistically analyzed. The purpose and significance of our doing this is: because everyone's situation is complex, the prediction of each person can accurately judge the classification results of the model for each person, and the results can first evaluate the performance of the model. For the subjects, this practice can be used to evaluate the performance of the model. In practical application, it can accurately judge the change of anxiety state of patients with anxiety. Moreover, there is a contrast between the health group and the anxiety group. It can be seen from the results that the classification results of the health group are slightly higher than that of the anxiety group. For researchers, it is necessary to further improve the prediction results of the anxiety group.
Discussion
In previous studies, researchers have been working on 2-class classification to identify depression (be hopeless and feel worthless) from healthy status using EEG signal. They achieved a classification accuracy around 90–95% [30, 31]. In Kimmatkar et al. [32], the classification accuracy using EEG signal to classify human emotions had reached 98.67%. Few studies focused on multi-classification of emotions such as Putra et al. who achieved an average accuracy around 60–70% [33].
In this paper, a neural feedback experiment with three experimental stages was designed to study anxiety issue. The anxiety state (non-anxiety, moderate anxiety, and severe anxiety) was divided according to the scores of the visual simulation scale of the subjects’ self-evaluation in the three experimental stages. The EEG data of the frontal lobe was taken as the research object, and it was preprocessed to get pure data. The feature vectors composed of frequency domain features “PSD” were used as an input for SVM classifiers. Through ten times tenfold cross-validation, classification results demonstrated that the average classification accuracy of Gaussian + one-vs-one is 92.30 ± 1.31%, the average accuracy of Gaussian + one-vs-rest is 92.48 ± 1.20%, the average accuracy of Polynomial + one-vs-one is 87.97 ± 1.52%, and the average accuracy of Polynomial + one-vs-rest is 88.60 ± 1.32%. From the perspective of classification accuracy, the classification accuracy obtained by using the Gaussian kernel seems to be superior, and the Gaussian kernel is also the first to consider the volatility of the classification results. The results show that the Gaussian kernel is better than the classification accuracy of the polynomial kernel function in this study. These results prove that the proposed method is effective for three-class electroencephalography anxiety state classification problems. It is also important for the prediction accuracy of each subject. By taking a part of each subject's samples and combining them into a training set, and then taking the remaining samples of each subject as a test set in turn, we get the objective accuracy results. Tables 2 and 3 are the results of prediction accuracy for each subject.
This experiment has made some progress on the classification of anxiety state, which is only a small step forward, and there is still a lot of room for improving the accuracy of classification. Because the research time is limited, there may be many methods that can be applied to the classification of anxiety state, and there are broad prospects for future research. In the near future, we are going to analyze the EEG changes of the subjects in the three stages of the experiment from the perspective of physiological signals, and assess whether they are relieved of anxiety like the scores of the visual analog scale. These kinds of affective BCI may lead in the future to help not only stressful adolescents and elderly with psychiatric diseases [34] but also people who experience extreme fear/worry or panic attacks during pandemic periods such as COVID-19 pandemic.
Acknowledgements
This work was partly financially supported in part by National Natural Science Foundation of China (61806146, 61971118, 81901860), Research plan for innovation in clinical technology by Beijing Hospitals Authority (XMLX201805), Beijing Municipal Administration of Hospitals Incubating Program (PX2018063), National Key Research &Development Program of China (2018YFC1314500), Anti Coronavirus project of Tianjin City (20ZXGBSY00060), Scientific Special Commissioner Foundation of Tianjin City (19JCTPJC56000), Graduate Research and Innovation Project of Tianjin City(2019YJSS052), Natural Science Foundation of Tianjin City (18JCYBJC95400), JSPS KAKENHI grants (19K11428) and FY2018 MEXT Private University Research Branding Project, Young and Middle-Aged Innovation Talents Cultivation Plan of Higher Institutions in Tianjin.
Contributor Information
Chao Chen, Email: cccovb@hotmail.com, chao_chen@email.tjut.edu.cn.
Changming Wang, Email: superwcm@xwh.ccmu.edu.cn.
References
- 1.Cao Y, Liu Z, et al. Factor structure and factorial invariance of the state-trait anxiety inventory for Chinese children and adolescents. PsyCh Journal. 2014;4(2):74–87. doi: 10.1002/pchj.78. [DOI] [PubMed] [Google Scholar]
- 2.Baxter AJ, Scott KM, Vos T, Whiteford HA. Global prevalence of anxiety disorders: A systematic review and meta-regression. Psychological Medicine. 2013;43(5):897–910. doi: 10.1017/S003329171200147X. [DOI] [PubMed] [Google Scholar]
- 3.Nepon J, Belik SL, Bolton J, Sareen J. The relationship between anxiety disorders and suicide attempts: Findings from the national epidemiologic survey on alcohol and related conditions. Depress Anxiety. 2010;27:791–798. doi: 10.1002/da.20674. [DOI] [PMC free article] [PubMed] [Google Scholar]
- 4.Shanok NA, Reive C, Mize KD, et al. Mindfulness meditation intervention alters neurophysiological symptoms of anxiety and depression in preadolescents [j] Journal of Psychophysiology. 2019;34(3):159–170. doi: 10.1027/0269-8803/a000244. [DOI] [Google Scholar]
- 5.Shelton CI. Diagnosis and management of anxiety disorders [J] Journal of the American Osteopathic Association. 2004;104(3 Suppl 1):2–5. [PubMed] [Google Scholar]
- 6.Spitzer RL, Kroenke K, Williams JBW, et al. A brief measure for assessing generalized anxiety disorder: The GAD-7. Archives of Internal Medicine. 2006;166(10):1092–1097. doi: 10.1001/archinte.166.10.1092. [DOI] [PubMed] [Google Scholar]
- 7.Hughes JR, John ER. Conventional and quantitative electroencephalography in psychiatry. The Journal of Neuropsychiatry Clinical Neuroscience. 1999;11(2):190–208. doi: 10.1176/jnp.11.2.190. [DOI] [PubMed] [Google Scholar]
- 8.Jenike MA, Baer L, Ballantine T, Martuza RL, Tynes S, Giriunas I, et al. Cingulotomy for refractory obsessive-compulsive disorder: A long-term follow-up of 33 patients. Archives of General Psychiatry. 1991;48:548–555. doi: 10.1001/archpsyc.1991.01810300060009. [DOI] [PubMed] [Google Scholar]
- 9.Goodman WK, Pricee LH, Rasmussen SA, Mazure C, Delgado P, Heninger GR, et al. The Yale-Brown obsessive compulsive scale II. Validity. Archives of General Psychiatry. 1989;46:1012–1016. doi: 10.1001/archpsyc.1989.01810110054008. [DOI] [PubMed] [Google Scholar]
- 10.Goodman WK, McDougle CJ, Price LH. Pharmacotherapy of obsessive compulsive disorder. Journal of Clinical Psychiatry. 1992;53(Suppl):29–37. [PubMed] [Google Scholar]
- 11.Goodman WK. The Yale-Brown obsessive compulsive scale. Archives of General Psychiatry. 1989;46(11):1012–1012. doi: 10.1001/archpsyc.1989.01810110054008. [DOI] [PubMed] [Google Scholar]
- 12.Stein MB, Craske MG. Treating anxiety in 2017: Optimizing care to improve outcomes. JAMA. 2017;318(3):235–236. doi: 10.1001/jama.2017.6996. [DOI] [PubMed] [Google Scholar]
- 13.Ballenger JC, Davidson JR, Lecrubier Y, Nutt DJ, BorkovecRickelsK TD, et al. Consensus statement on generalized anxiety disorder from the international consensus group on depression and anxiety. Journal of Clinical Psychiatry. 2001;62(suppl 11):53–58. [PubMed] [Google Scholar]
- 14.Wittchen HU, Kessler RC, Beesdo K, Krause P, Hofler M, Hoyer J. Generalized anxiety and depression in primary care: Prevalence, recognition, and management. Journal of Clinical Psychiatry. 2002;63(suppl 8):24–34. [PubMed] [Google Scholar]
- 15.Ormel J, Koeter MW, van den Brink W, van de Willige G. Recognition, management, and course of anxiety and depression in general practice. Archives of General Psychiatry. 1991;48:700–706. doi: 10.1001/archpsyc.1991.01810320024004. [DOI] [PubMed] [Google Scholar]
- 16.Harmon-Jones E, Allen JJB. Behavioral activation sensitivity and resting frontal EEG asymmetry: COVRriation of putative indicators related to risk for mood disorders. Journal of Abnormal Psychology. 1997;106:159–163. doi: 10.1037/0021-843X.106.1.159. [DOI] [PubMed] [Google Scholar]
- 17.Arnaud D, Scott M. EEGLAB: An open source toolbox for analysis of single-trial EEG dynamics including independent component analysis. Journal of Neuroscience Methods. 2004;134(1):9–21. doi: 10.1016/j.jneumeth.2003.10.009. [DOI] [PubMed] [Google Scholar]
- 18.Cai H, Han J, Chen Y, et al. A pervasive approach to EEG-based depression detection. Complexity. 2018;2018:1–13. [Google Scholar]
- 19.Ahani A, Wahbeh H, Nezamfar H. Quantitative change of EEG and respiration signals during mindfulness meditation. Journal of Neuro Engineering and Rehabilitation. 2014;11(1):87. doi: 10.1186/1743-0003-11-87. [DOI] [PMC free article] [PubMed] [Google Scholar]
- 20.Mahato S, Paul S, et al. Classification of depression patients and normal subjects based on electroencephalogram (EEG) signal using alpha power and theta asymmetry. Journal of medical systems. 2019;44(1):28–28. doi: 10.1007/s10916-019-1486-z. [DOI] [PubMed] [Google Scholar]
- 21.Cortes C, Vapnik V. Support-vector networks. Machine Learning. 1995;20(3):273–297. [Google Scholar]
- 22.Gang LI, Wei W, Sheng Z. Application of SVM in EEG signal classification. Journal of Computer Applications. 2006;26(6):1431–1427. [Google Scholar]
- 23.Chen C, Li X, Belkacem AN, Qiao Z, Dong E, Tan W, Shin D. The mixed kernel function SVM-based point cloud classification. International Journal of Precision Engineering and Manufacturing. 2019;20(5):737–747. doi: 10.1007/s12541-019-00102-3. [DOI] [Google Scholar]
- 24.Dong E, Li C, Li L, Du S, Belkacem AN, Chen C. Classification of multi-class motor imagery with a novel hierarchical SVM algorithm for brain–computer interfaces. Medical and Biological Engineering and Computing. 2017;55(10):1809–1818. doi: 10.1007/s11517-017-1611-4. [DOI] [PubMed] [Google Scholar]
- 25.Wang X, Zhao J. Study of EEG based on SVM and SVM with EMD. Journal of Convergence Information Technology. 2012;7(22):227–235. doi: 10.4156/jcit.vol7.issue22.27. [DOI] [Google Scholar]
- 26.Abedi M, Norouzi GH, Bahroudi A. Support vector machine for multi-classification of mineral prospectivity areas. Computers and Geoences. 2012;46:272–283. [Google Scholar]
- 27.Zheng Q, Zhu F, Qin J, et al. Multiclass support matrix machine for single trial EEG classification. Neurocomputing. 2017;275(31):869–880. [Google Scholar]
- 28.Kumar D, Tripathy RK, Acharya A. Least square support vector machine based multiclass classification of EEG signals. WSEAS Transactions on Signal Processing. 2014;10(1):86–94. [Google Scholar]
- 29.Calso C, Besnard J, Allain P. Normal aging of frontal lobe functions. Geriatrie Psychologie Neuropsychiatrie Vieillisement. 2016;14(1):77–85. doi: 10.1684/pnv.2016.0586. [DOI] [PubMed] [Google Scholar]
- 30.Mebarkia K, Reffad A. Multi optimized SVM classifiers for motor imagery left and right hand movement identification. Australasian Physical and Engineering Sciences in Medicine. 2019;42(4):949–958. doi: 10.1007/s13246-019-00793-y. [DOI] [PubMed] [Google Scholar]
- 31.Chandaka S, Chatterjee A, Munshi S 2009 Cross-correlation aided support vector machine classifier for classification of EEG signals. Expert Systems with Applications 36(2):1329–1336.
- 32.Kimmatkar N. V., Babu V. B. 2018 Human emotion classification from brain EEG signal using multimodal approach of classifier. Proceedings of the 2018 International Conference on Intelligent Information Technology. 9–13.
- 33.Putra A. E., Atmaji C., Ghaleb F. 2018 EEG-based emotion classification using wavelet decomposition and K-nearest neighbor. International Conference on Science and Technology. 1–4.
- 34.Belkacem AN, Jamil N, Palmer JA, Ouhbi S, Chen C. Brain computer interfaces for improving the quality of life of older adults and elderly patients. Frontiers in Neuroscience. 2020;14:692. doi: 10.3389/fnins.2020.00692. [DOI] [PMC free article] [PubMed] [Google Scholar]


