

Abstract
Among radiological imaging data, Chest X-rays (CXRs) are of great use in observing COVID-19 manifestations. For mass screening, using CXRs, a computationally efficient AI-driven tool is the must to detect COVID-19-positive cases from non-COVID ones. For this purpose, we proposed a light-weight Convolutional Neural Network (CNN)-tailored shallow architecture that can automatically detect COVID-19-positive cases using CXRs, with no false negatives. The shallow CNN-tailored architecture was designed with fewer parameters as compared to other deep learning models. The shallow CNN-tailored architecture was validated using 321 COVID-19-positive CXRs. In addition to COVID-19-positive cases, another set of non-COVID-19 5856 cases (publicly available, source: Kaggle) was taken into account, consisting of normal, viral, and bacterial pneumonia cases. In our experimental tests, to avoid possible bias, 5-fold cross-validation was followed, and both balanced and imbalanced datasets were used. The proposed model achieved the highest possible accuracy of 99.69%, sensitivity of 1.0, where AUC was 0.9995. Furthermore, the reported false positive rate was only 0.0015 for 5856 COVID-19-negative cases. Our results stated that the proposed CNN could possibly be used for mass screening. Using the exact same set of CXR collection, the current results were better than other deep learning models and major state-of-the-art works.
Keywords: COVID-19, Chest X-rays, Deep learning, Convolutional neural network, Mass screening
Introduction
In December 2019, the novel coronavirus disease (COVID-19) was found in Wuhan Province of China https://www.who.int/docs/default-source/coronaviruse/who-china-joint-mission-on-covid-19-final-report.pdfhttps://www.who.int/docs/default-source/coronaviruse/who-china-joint-mission-on-covid-19-final-report.pdf [1]. Unlike the common cold and flu, COVID-19 is much more contagious, and for human’s immune system, it is an absolute unknown. To be more specific, severe acute respiratory syndrome (SARS) and Middle East respiratory syndrome (MERS) are two well-known coronavirus diseases, which have huge mortality rates of 10% and 37%, respectively [2, 3]. As of now, COVID-19 affected more than 6,057,853 people with more than 371,166 death cases across the world (dated, June 01, 2020) [8]. The COVID-19 outbreak spread rate is exponential and is faster than other respiratory-related diseases. Researchers are now limited to small amount of data to predict possible consequences using AI-driven tools.
In January 2020, Huang C et al. reported some clinical and paraclinical aspects of COVID-19 using 41 patients. Their study stated that abnormalities, such as Ground-Glass Opacity (GGO) can be observed using chest CT scans [4]. CT scans are widely used to identify unusual patterns in confirmed cases of COVID-19 [5–7]. To be precise, Li Y and Xia L [7] experimented on 51 CT images and in 96.1% cases, COVID-19 was successfully detected. Zhou S et al. [9] experimented on 62 COVID-19 and pneumonia, and their results showed diverse patterns that are visually like lung parenchyma and the interstitial diseases. Also, Zheng Ye et al. [10] stated that typical and atypical CT manifestations help and familiarize radiologists in decision-making.
In a similar fashion, chest X-rays (CXRs) have been widely used to detect COVID-19-positive cases [11, 13, 22, 24]. Soon et al. [11] observed the relationship between CXRs and CT images, where 9 COVID-19-positive cases were used. Besides, others were focused on the use of Neural Network-tailored deep learning (DL) models, such as COVID-Net [24] and ResNet50 [13]. COVID-Net was tested only on 31 COVID-19-positive cases, while ResNet50 was tested on 25 COVID-19-positive cases. Similarly, Zhang et al. [22] used classical DL model to detect COVID-19-positive cases, where 100 COVID-19 samples were used. As of now, the highest accuracy of 96% was reported to detect COVID-19-positive cases [22].
Das et al. [15] presented a system for identification of COVID-19 cases with an inception network-based approach. They experimented with 6 different datasets and reported an accuracy of 99.96% in distinguishing positive and healthy cases. Furthermore, they reported an accuracy of 99.92% in distinguishing positive case from a combined set of healthy and pneumonia cases. Asnaoui and Chawki [16] presented a deep learning–based approach for detection of COVID-19 cases. They experimented with disparate CNN architectures on CXRs and CTs totalling to 6087 images. An accuracy of 92.18% was reported using Inception-ResNetV2 architecture while an accuracy of 88.09% was obtained using Densenet201.
Pereira et al. [17] used multi-class and hierarchical classification for COVID-19 identification from CXRs. They experimented on a self collected dataset named RYDLS-20. They reported F1-scores of 0.65 and 0.89 for multi-class and hierarchical classification approach. Mangal et al. [18] presented a deep learning–based technique named CovidAID for detection of COVID-19 cases from CXRs. They experimented with over 6K CXRs having 155 COVID-19 cases and reported an accuracy of 90.5%. Asif et al. [19] used an InceptionNetV3-based approach equipped with transfer learning for COVID-19 pneumonia detection from CXRs. They collected data from multifarious sources totalling to over 2K images and reported a validation accuracy of 93%.
Motivated by the fact that X-ray imaging systems are more prevalent and cheaper than CT scan systems, in this paper, a shallow Convolutional Neural Network (CNN) is proposed to detect COIVID-19-positive cases from non-COVID-19 ones using CXRs.
Materials and Methods
Data Collection
AI-driven tools require enough data so that all possible infestations are trained [25]. However, as of now, we do not have large amount of data for COVID-19-positive cases, unlike other respiratory-related diseases. Radiological imaging data are of great use in observing COVID-19 manifestations, where chest X-ray (CXR) imaging systems are more prevalent and cheaper than CT scan systems. As an example, Chest X-ray is the first imaging method to diagnose COVID-19 infection in Spain (dated, March 20, 2020). A chest X-ray is performed in suspected or confirmed patients through specific circuits.
In this paper, publicly available collection of COVID-19-positive CXRs https://github.com/ieee8023/covid-chestxray-datasetwas used. It includes 321 COVID-19-positive cases. To create non-COVID-19 category, another collection (publicly available via Kaggle) of CXRs was used https://www.kaggle.com/paultimothymooney/chest-xray-pneumonia, where there are 5856 (1583, normal and 4273, pneumonia) number of CXRs. Overall, the non-COVID-19 category was composed of viral and bacterial pneumonia cases. The reason behind this mixed bag in one category is to check whether the proposed model can classify COVID-19-positive case from its counterparts. Furthermore, it was observed that CXRs with pneumonia were identical to the COVID-19. Few CXR samples are show in Fig. 1.
Fig. 1.

CXR samples: a–c COVID-19-positive cases and d–f non-COVID-19 cases (pneumonia)
Shallow Convolutional Neural Network
Convolutional neural networks (CNNs) [23, 26] are a class of neural networks which work on the principle of deep learning. A basic CNN architecture consists of alternate layers of convolutional and pooling followed by one or more fully connected layers at the final stage.
The convolutional layer is the prime ingredient of this architecture that detects the existence of a set of features from the input. This layer comprises a set of convolutional kernels. The functioning of this layer can be computed as follows: , where, jd(r,s) is an instance of the input vector Jd, which is multiplied by index of the k th kernel of the c th layer. The output mapping of the k th kernel can me measured as: .
The pooling layer is arranged between two convolutional layers that reduces the size of the vectors while keeping their relevancy intact. It aggregates the related information in the region of the receptive domain and outputs the feedback within that region using , where determine the pooled feature map of the c th layer for k th kernel and 0p determines the kind of pooling operation.
The dense layer accepts the input from the previous stages and globally evaluates the output of all the former layers. Hence, makes a non-linear combination of specified features that are used for the classification purpose.
In this paper, a shallow CNN architecture is proposed, which consists of only four layers as compared to deep architectures. The primary motivation behind this was to design light architecture with minimal number of parameters (weights) so that it does not suffer from heavy computational time. As a result, the proposed shallow (or light-weight) CNN architecture is not just computationally efficient but also is able to avoid possible overfitting. More often, deep architectures are prone to overfitting due to their heavy usage of parameters, and of course, longer training period. The proposed shallow CNN architecture is therefore a better fit for mass population screening especially in resource constrained areas.
The network consists of a single convolution layer, followed by a max-pooling layer and a 256-dimensional dense layer. This was finally followed by a 2-dimensional dense (output) layer. Initially, the images were scaled down to 50×50 pixels and fed to the network. The convolution layer and the first dense layer had Rectified Linear Unit activation function: , where x is an input to a neuron. The final dense layer had a softmax activation function: where zi is an element of input vector z of size K. The network is diagrammatically presented in Fig. 2. The number of generated parameters is presented in Table 1.
Fig. 2.

Architecture of the proposed CNN
Table 1.
Number of generated parameters by the proposed network for a 25×25 image
| Layer | Parameters |
|---|---|
| Convolution | 280 |
| Dense 1 | 310016 |
| Dense 2 | 514 |
| Total | 310810 |
Using the proposed shallow CNN architecture, the generated feature maps for COVID-19-positive and pneumonia CXRs are shown in Fig. 3.
Fig. 3.

Feature map visualization: a COVID-19-positive case and its corresponding b–d feature maps; and e pneumonia-positive case and its corresponding f, g feature maps
Experiments
To validate the proposed architecture, a 5-fold cross-validation was considered for all tests. This provides a thorough statistical analysis of the model. In each fold, we computed the following evaluation metrics: Accuracy, Precision, Sensitivity (Recall), Specificity, F1 score, and Area under ROC curve (AUC). They were computed as:
| 1 |
where TP, TN, FP, and FN refer to true positive, true negative, false positive, and false negative, respectively.
Results on Balanced Dataset
Since machine learning tools traditionally require balanced dataset, we first created equal number of COVID-19-positive and COVID-19-negative cases from two different data collections https://github.com/ieee8023/covid-chestxray-dataset and https://www.kaggle.com/paultimothymooney/chest-xray-pneumonia(cf. Section “Data Collection”). For a quick note, in this section, for our experimental tests, we have 321 COVID-19-positive cases and 321 non-COVID-19 cases.
As the proposed shallow CNN architecture requires several parameters, the first set of experiment tests were based on how well the model can be trained. For this, a few essential parameters, such as image size, number of filters used in convolutional layer and its filter size, pooling window size, and batch size were considered. In what follows, these parameters are discussed.
Image size: CXR image size were of different sizes in the dataset. They were, therefore, resized into a fixed dimension. For experimental purpose, the resized dimensions were varied from 20 × 20 to 150 × 150 pixels. With the proposed model, better result (accuracy = 99.53%) was obtained from CXRs of size 25 × 25 as compared to 50 × 50 (accuracy = 99.07%) and 150 × 150 (accuracy = 99.38%). The result for 20×20 was similar to that of the 150×150 images.
Number of filters in convolution layer: In convolution layer, different number of filters were employed, such as 5, 10, 20, and 30. Of all, it is observed best results were obtained from the experimental test, where 10 filters were used.
Filter size: The convolution filter size was also experimented with, from 2 to 5 with an increment of 1: . Of all, the best results were obtained from the filter of size 2 × 2 (accuracy = 99.38%).
Pooling window size: Like filter size, the pooling windows were varied from 2 to 4, with an increment of 1: 2×2, 3×3, and 4×4. The experimental test results dropped on increasing the pooling window size. Therefore, the pooling window size was fixed at 2 (accuracy = 99.38%).
Batch size: During training period, different batch sizes were applied, starting from 25 to 125 instances with the difference of 25. Of all, best results were obtained from 25 instances (accuracy = 99.69%). As the best results were obtained for 25 instances, we tested 20 instance batch size as well to check accuracies were similar. In both 20 and 25 instance batch sizes, all 321 COVID-19- positive cases were correctly identified. However, in the case of 20 instances, 318 non-COVID-19 cases were correctly identified while in the case of 25 instances, 319 non-COVID-19 cases were properly identified. The detailed experimental test results for different batch sizes are provided in Table 2. The results were further analyzed with respect to several performance metrics, such as sensitivity, specificity, precision, F1 score, and AUC, which are detailed in Table 3. For better understanding, corresponding ROC curves are provided in Fig. 4.
Table 2.
Confusion matrices for different batch sizes
| Batch size: 20 | Batch size: 25 (best result) | ||||
| COVID-19 | Non- COVID-19 | COVID-19 | Non- COVID-19 | ||
| COVID-19 | 321 | 0 | COVID-19 | 321 | 0 |
| Non-COVID-19 | 3 | 318 | Non-COVID-19 | 2 | 319 |
| Batch size: 50 | Batch size: 75 | ||||
| COVID-19 | Non- COVID-19 | COVID-19 | Non- COVID-19 | ||
| COVID-19 | 319 | 2 | COVID-19 | 320 | 1 |
| Non-COVID-19 | 3 | 318 | Non-COVID-19 | 4 | 317 |
| Batch size:100 | Batch size:125 | ||||
| COVID-19 | Non-COVID-19 | COVID-19 | Non-COVID-19 | ||
| COVID-19 | 320 | 1 | COVID-19 | 320 | 1 |
| Non-COVID-19 | 3 | 318 | Non-COVID-19 | 3 | 318 |
Table 3.
Performance metrics for different batch sizes
| Metrics | Batch size | |||||
|---|---|---|---|---|---|---|
| 20 | 25 | 50 | 75 | 100 | 125 | |
| Sensitivity | 1 | 1 | 0.9938 | 0.9969 | 0.9969 | 0.9969 |
| Specificity | 0.9907 | 0.9938 | 0.9907 | 0.9875 | 0.9907 | 0.9907 |
| Precision | 0.9907 | 0.9938 | 0.9907 | 0.9877 | 0.9907 | 0.9907 |
| False positive rate | 0.0093 | 0.0062 | 0.0093 | 0.0125 | 0.0093 | 0.0093 |
| False negative rate | 0 | 0 | 0.0062 | 0.0031 | 0.0031 | 0.0031 |
| Accuracy (%) | 99.53 | 99.69 | 99.22 | 99.22 | 99.38 | 99.38 |
| F1 Score | 0.9953 | 0.9969 | 0.9922 | 0.9922 | 0.9938 | 0.9938 |
| AUC | 0.9997 | 0.9995 | 0.9993 | 0.9991 | 0.9993 | 0.9996 |
Fig. 4.

ROC curves for different batch sizes: a 20 batch size; b 25 batch size; c 50 batch size; d 75 batch size; e 100 batch size; and f 125 batch size. The batch size of 50 was found to be the best of all
On the whole, for the proposed shallow CNN-based architecture, parameters were tuned for upcoming test purposes.
As of now, we observed that the best performance scores were achieved when the architecture used 10 filters of size 2 × 2 in the convolution layer, batch size of 25 for CXR image size of 25 × 25 pixels, and the window size of 2 × 2 in the pooling layer. With these parameters, thorough experimental results are provided in Table 3. For better understanding, corresponding ROC curves are provided in Fig. 4. The proposed model provided the highest possible accuracy of 99.69% with an AUC of 0.9995. It is important to note that the proposed model received a false negative rate of 0.
The results can now be taken for a comparison with other existing deep learning models. For a comparison, the exact same set of experimental datasets were applied to other popular deep learning (DL) architectures, such as MobileNet [27], InceptionV3 [21], and ResNet50 [29]. Their performance scores along with the number of generated parameters are presented in Table 4. Furthermore, the corresponding ROC curves are provided in Fig. 5. Among the three, MobileNet performed the best followed by InceptionV3 and ResNet50. MobileNet achieved an overall accuracy of 99.69% while ResNet50 achieved an overall accuracy of 95.02%. In the case of ResNet50 and InceptionV3, not limited to accuracy, the proposed model outperformed them with remarkable difference in terms of other metrics, such as sensitivity, false negative rate, precision, and AUC. Even though, the difference between the proposed shallow CNN and MobileNet was marginal, it is important to take a look at number of parameters used. Considering computational complexity issue, the proposed model required 310,810 number of parameters, which was 98.83% lesser than InceptionV3, 95.81% lesser than MobileNet and 99.37% lesser than ResNet50.
Table 4.
Performance comparison with other deep learning models for balanced dataset
| Metrics | InceptionV3 | MobileNet | ResNet50 | Proposed CNN |
|---|---|---|---|---|
| Sensitivity | 1.0000 | 1.0000 | 0.9252 | 1.0000 |
| Specificity | 0.9751 | 0.9938 | 0.9751 | 0.9938 |
| Precision | 0.9757 | 0.9938 | 0.9738 | 0.9938 |
| False positive rate | 0.0249 | 0.0062 | 0.0249 | 0.0062 |
| False negative rate | 0.0000 | 0.0000 | 0.0748 | 0.0000 |
| Accuracy (%) | 98.75 | 99.69 | 95.02 | 99.69 |
| F1 Score | 0.9877 | 0.9969 | 0.9489 | 0.9969 |
| AUC | 0.9877 | 0.9969 | 0.9355 | 0.9995 |
| Parameters | 26,522,146 | 7,423,938 | 49,278,594 | 310,810 |
Bold entries denote best result
Fig. 5.

ROC curves for a InceptionV3, b MobileNet, and c ResNet50
Results on Imbalanced Dataset
Since dataset sizes vary over time (since January 2020) https://github.com/ieee8023/covid-chestxray-dataset, the reported works in the state-of-the-art literature used different datasets in an imbalanced scenario. Following the exact same trend, in this section, we performed another set of experimental tests using the complete Kaggle data collection https://www.kaggle.com/paultimothymooney/chest-xray-pneumonia (cf. Section “Data Collection”) was used, which was altogether 5856 CXRs (1583, normal and 4273, pneumonia). As a result, the size of non-COVID-19 category was 1724.30% bigger than the size of COVID-19 positive category.
Imbalanced dataset typically portrays a real-world scenario. As before, confusion matrix is provided in Table 5. The results were further analyzed (for other established architectures as well) with respect to several performance metrics, such as sensitivity, specificity, precision, F1 score, and AUC, which are detailed in Table 6. For better understanding, corresponding ROC curves are provided in Fig. 6.
Table 5.
Confusion matrices for imbalanced dataset
| COVID-19 | Non-COVID-19 | |
|---|---|---|
| COVID-19 | 311 | 10 |
| Non-COVID-19 | 9 | 5847 |
Table 6.
Performance metrics for imbalanced data

Bold entries denote best result
Fig. 6.

ROC curves for a InceptionV3, b MobileNet, c ResNet50, and d Proposed network
On such an imbalanced dataset, we achieved an accuracy of 99.69%. In this scenario, a false negative rate of only 0.0015 was obtained which points towards steady identification of COVID-19-positive cases amidst pneumonia and healthy CXRs. Furthermore, a false negative rate of 0.0312 was obtained, which demonstrates ability of the network to handle imbalanced negative class. This is often the scenario in real world during mass screening which is essential in the present situation. Among other architectures, InceptionV3 produced the best result of 99.01%. However, the sensitivity value was 0.8816, which was less. In case of other networks, data imbalance was a major problem, which is evident in Table 6.
Results on Extended Dataset
Experiments were performed on an extended dataset from https://github.com/ieee8023/covid-chestxray-dataset, where 439 COVID-19 CXRs were obtained from this set. A similar number of non-COVID-19 pneumonia CXRs were used from https://www.kaggle.com/paultimothymooney/chest-xray-pneumonia for putting together the negative class. The interclass confusions for this dataset are presented in Table 7. The afore mentioned performance metrics were also computed for this setup which are listed in Table 8. The ROC curve for the same is presented in Fig. 7. It is noted that the results do not deviate much on increasing the dataset. Besides, the new additions to the data were different in terms of quality. This points to the system’s suitability for real-world scenarios, where the size of the data changes over time.
Table 7.
Confusion matrices for extended dataset
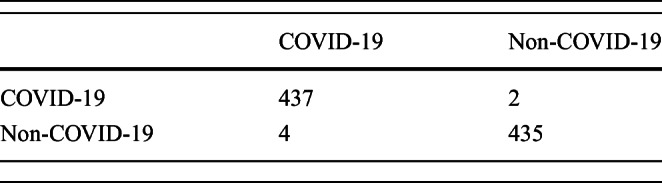
Table 8.
Performance metrics for extended data
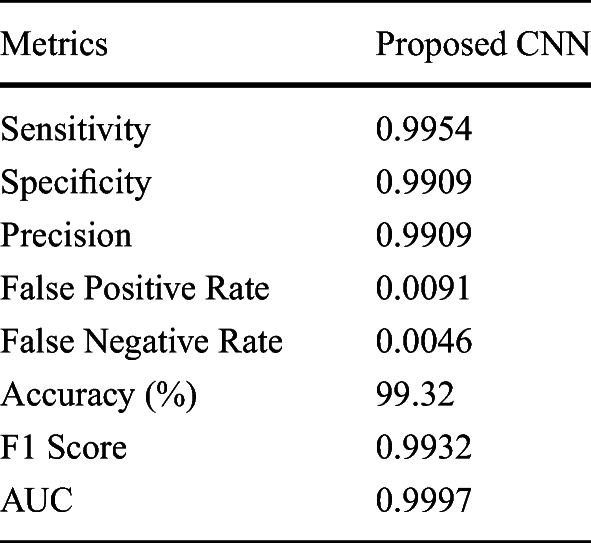
Fig. 7.
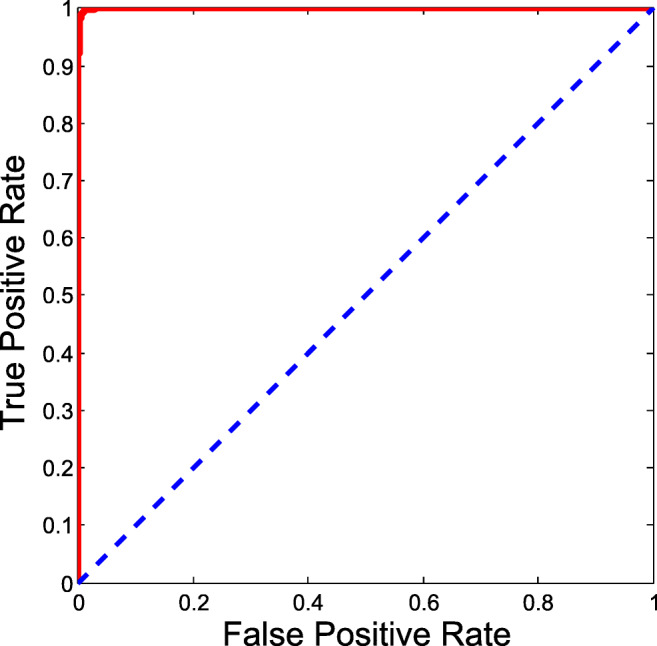
ROC curve for extended dataset
State-of-the-art Comparison
As mentioned earlier, let us compare our results with previously reported works that used similar set of datasets (but different sizes). A comparative study was provided in Table 9.
Table 9.
Comparative study. Index: Li et al. (2020) [14], Abbas et al. (2020)[12], Luz et al. (2020)[20], Wang et al. (2020) [24], Sethy and Behera (2020) [13], Zhang et al. (2020) [22], and Apostolopoulos and Mpesiana (2020) [28]. Since authors did not report results for several different metrics, there exists symbol “–” in the table
| Metrics | Li et al. [14] | Abbas et al. [12] | Luz et al. [20] | Wang et al. [24] | Sethy & Behera [13] | Zhang et al. [22] | Aposto-lopoulos & Mpesiana [28] | Shallow CNN (proposed) |
|---|---|---|---|---|---|---|---|---|
| Dataset (No. of tested COVID-19-positive cases) | 36 | 32 | 31 | 31 | 5 | 100 | 224 | 321 |
| Sensitivity | – | 0.9791 | 0.968 | 0.871 | 0.9729 | 0.9600 | 0.9866 | 1.0000 |
| Specificity | – | 0.9187 | – | – | 97.4705 | 0.7065 | 0.9646 | 0.9938 |
| Precision | – | 0.9336 | – | – | – | – | – | 0.9938 |
| False positive rate | – | – | – | – | – | – | – | 0.0062 |
| False negative rate | – | – | – | – | – | – | – | 0.0000 |
| Accuracy (%) | 93.5 | 95.12 | 93.9 | 92.6 | 95.38 | 83.34 | 96.78 | 99.69 |
| F1 score | – | – | – | – | 0.9552 | – | – | 0.9969 |
| AUC | 0.992 | – | – | – | – | – | – | 0.9995 |
Wang et al. [24] tested their tool on 31 COVID-19-positive cases and reported accuracy was 92.6% with a sensitivity score of 0.80. This means that all COVID-19-positive cases were not correctly classified. Sethy and Behera [13] tested 25 COVID-19-positive cases and reported an accuracy of 95.38%, where sensitivity was 97.44. Zhang et al. [22] reported an accuracy of 96.00%, where 100 COVID-19-positive cases were tested. Abbas et al. [12] used 105 COVID-19-positive cases, which were further decomposed. Thirty percent of this data was used for testing, where accuracy, sensitivity, specificity, and precision of 95.12%, 97.91%, 91.87%, and 93.36% were reported. Luz et al. [20] trained/tested their system with 31 COVID-19-positive cases and reported an accuracy of 93.9% and a sensitivity of 0.968. Li et al. [14] tested their mobile-based system with 36 COVID-19-positive cases and reported an accuracy of 93.5% with AUC of 0.992. Apostolopoulos and Mpesiana [28] experimented with 224 COVID-19-positive cases and obtained accuracy, sensitivity, and specificity values of 96.78%, 98.66%, and 96.46%. For the newly updated dataset collection, which was composed of 321 COVID-19 CXRs, the proposed model achieved higher performance scores in terms of accuracy, precision, sensitivity, F1 score, and AUC (see Table 9). To be precise, test results were higher than state-of-the-art works.
Discussions
For COVID-19 screening, since sensitivity measures the likelihood that the model would not miss to detect COVID-19-positive patients, it plays a crucial role in validating model in early stages of a pandemic. As a consequence, it helps prevent further COIVD-19 spreading. The similar argument lies in computing false negative rate. Furthermore, precision indicates the probability in detecting COVID-19-positive cases. It is useful as it measures the likelihood that a model would not make a mistake to classify the COVID-19-positive patients as normal (taking false alarms into account) and it is important in the later stages of a pandemic, when medical resources are limited to COVID-19 patients. Accuracy was computed to measure the overall performance of the model. AUC, on the other hand, conveys how stable the system was: degree of measure of separability (between two categories: COVID-19 and non-COVID-19).
In the case of the balanced dataset, the proposed model achieved an average sensitivity score of 1.0, using 5-fold cross-validation protocol. This means that false negative rate was 0. The proposed model reported an average precision of 0.9938. As the work was particularly focused on detecting COVID-19-positive cases, the discussion can be limited to sensitivity, false positive rate, and precision. Similarly, other metrics (as provided in Table 3) are of importance to test further the robustness of the model.
For the imbalanced dataset, a sensitivity score of 0.9688 was obtained. The false negative rate was quite low considering the imbalanced and inter-class similarity in the dataset. In this case, an accuracy of 99.69% was obtained with a AUC value of 0.9996. Other important metrics for the imbalanced dataset are presented in Table 6 along with the ROC curve in Fig. 6.
Conclusion and Future Works
On the whole, in this paper, a light-weight CNN-tailored shallow architecture was proposed to detect COVID-19-positive cases using CXRs against non-COVID-19 ones. The experiments were performed on dataset collection of COVID19-positive, pneumonia-positive, and healthy CXRs. To validate its robustness, 5-fold cross-validation protocol was used on both balanced and imbalanced dataset scenarios, where 321 COVID-19-positive cases were used. We have compared the proposed shallow CNN-tailored architecture by taking (a) popular DL tools, such as MobileNet, InceptionV3, and ResNet50; and (b) state-of-the-art works for COVID-19 detection using CXRs, into account. The proposed model outperformed all and is computationally efficient as it requires less number of parameters. As the proposed shallow CNN-tailored architecture has no false negatives, it could be used to screen COVID-19-positive cases in chest X-rays.
In future, the network architecture will be explored, aiming to minimize false positive cases. We also plan to augment data that helps avoid an issue we currently face, i.e., lack of sufficient data.
Abbreviations
- AI
artificial intelligence
- COVID-19
coronavirus disease 2019
- SERS
severe acute respiratory syndrome
- MERS
Middle East respiratory syndrome
- CXR
chest X-ray
- CT
computed tomography
- CNN
Convolutional Neural Network
- GGO
Ground-Glass Opacity
- DNN
Deep Neural Network
- RT-PCR
reverse transcription polymerase chain reaction
- AUC
area under the ROC curve
Biographies
Himadri Mukherjee
has completed B.Sc. in Computer Science from Acharya Prafulla Chandra College, M.Sc. (Gold Medalist) in Computer Science from West Bengal State University in the year 2013 and 2015 respectively. He is currently a Research Scholar in the Department of Computer Science of the same University. He has published more than 50 Research papers in reputed conferences and journals. His research interest includes Audio Signal Processing, Music Processing, Image Processing, Natural Language Processing, Pattern Recognition, and Machine Intelligence.
Subhankar Ghosh
has received B.Sc. degree in Computer Science from University of Calcutta, Kolkata, in 2013 and M.Sc. degree in the discipline from West Bengal State University in 2016. He is currently working as a project assistant in Indian Statistical Institute, Kolkata. His research interests include image processing, computer vision and deep learning.
Ankita Dhar
has completed B.Sc. in Computer Science from East Calcutta Girls’ College, M.Sc. (Gold Medalist) in Computer Science from West Bengal State University in the year 2011 and 2013 respectively. She is currently a DST Inspire Fellow and working as a Research scholar in the department of Computer Science of the same University. She has presented/published around 11 research papers in reputed conferences and journals. Her research interest includes Natural Language Processing, Information Retrieval, Audio Signal Processing, and Machine Intelligence.
Sk Md Obaidullah
has completed Ph.D(Engg.) from Jadavpur University, M.Tech in Computer Science & Application from University of Calcutta and B.E in Computer Science & Engineering from Vidyasagar University in the year 2017, 2009, and 2004 respectively. He was Erasmus Post-Doctoral fellow at University of Evora, Portugal from Nov. 2017 to Sept. 2018. He has more than 11 years of professional experience including 2 years in industry and 9 years in academia out of which 5 years of research. Presently he is working as an Assistant Professor in the Department of Computer Science & Engineering, Aliah University, Kolkata. He has published more than 50 research papers in reputed peer reviewed journal and national/international conferences. His research interests are Document Image Processing, Pattern Recognition, Computer Vision, and Audio Signal Processing.
K. C. Santosh
Dr. KC Santosh (IEEE Senior Member) is the Chair & Associate Professor of the Department of Computer Science at the University of South Dakota (USD). Before joining USD, Dr. Santosh worked as a Research Fellow at the US National Library of Medicine (NLM), National Institutes of Health (NIH). He worked as a Postdoctoral Research Scientist at the LORIA Research Centre, Universite de Lorraine, in direct collaboration with ITESOFT, France. He also served as a Research Scientist at the INRIA Nancy Grand Est Research Centre, France, where he has received his Ph.D. diploma in Computer Science. Dr. Santosh has published 70 peer-reviewed research articles, 100 conference proceedings, and 11 book chapters. He has authored 4 books, and edited 5 books, 14 journal issues, and 6 conference proceedings. He is currently Editor-In-Chief of IJSIP and an Associate Editor for several journals, such as International Journal of Machine Learning & Cybernetics and IEEE Access. He has also chaired more than 10 international conference events. His research projects have been funded by multiple agencies, including the SDCRGP, Department of Education (DOE), and the National Science Foundation (NSF). Dr. Santosh is the proud recipient of the Presidents Research Excellence Award (USD, 2019) and an award from the Department of Health & Human Services (2014).
Kaushik Roy
has completed B.E in Computer Science & Engineering from NIT Silchar, M.E and PhD(Engg.) in Computer Science & Engg. from Jadavpur University in the year 1998, 2002, and 2008 respectively. He is currently working as a Professor and Head of the Department of Computer Science, West Bengal State University, Barasat, India. In 2004, he has received Young IT Professional award from Computer Society of India. He has published more than 150 research papers/book chapters in reputed conferences and journals. His research interest includes pattern recognition, document image processing, medical image analysis, online handwriting recognition, speech recognition, and audio signal processing. He is Life Member of IUPRAI (an unit of IAPR) and Computer Society of India.
Author Contributions
(a) Conceptualization: H Mukherjee, and KC Santosh; (b) Methodology: H Mukherjee, KC Santosh, and K Roy; (c) Validation: A Dhar, S Ghosh, and KC Santosh; (d) Writing—original draft preparation: H Mukherjee, S Obaidullah, and KC Santosh; (e) Writing—finalizing: KC Santosh; and (d) Supervision: KC Santosh and K Roy. All authors have read and agreed to the published version of the manuscript.
Compliance with Ethical Standards
Conflict of Interest
The authors declare that they have no conflict of interest.
Footnotes
This article belongs to the Topical Collection: Data-Driven Artificial Intelligence approaches to Combat COVID-19
Guest Editors: Mufti Mahmud, M. Shamim Kaiser, Nilanjan Dey, Newton Howard, Aziz Sheikh
Ethical Approval
This article does not contain any studies with human participants performed by any of the authors.
Publisher’s Note
Springer Nature remains neutral with regard to jurisdictional claims in published maps and institutional affiliations.
Contributor Information
Himadri Mukherjee, Email: himadrim027@gmail.com.
Subhankar Ghosh, Email: sgcs2005@gmail.com.
Ankita Dhar, Email: ankita.ankie@gmail.com.
Sk Md Obaidullah, Email: sk.obaidullah@gmail.com.
K. C. Santosh, Email: santosh.kc@usd.edu
Kaushik Roy, Email: kaushik.mrg@gmail.com.
References
- 1.Novel coronavirus – China. 2020. http://www.who.int/csr/don/12-january-2020-novel-coronavirus-china/en/. Accessed 25 March 2020.
- 2.Summary of probable SARS cases with onset of illness from 1 November 2002 to 31 July 2003. 2003. https://www.who.int/csr/sars/country/table2004_04_21/en/. Accessed 25 March 2020.
- 3.Middle East respiratory syndrome coronavirus (MERS-CoV). 2019. http://www.who.int/emergencies/mers-cov/en/. Accessed 25 March 2020.
- 4.Huang C, et al. Clinical features of patients infected with 2019 novel coronavirus in Wuhan, China. Lancet. 2020;395(10223):497–506. doi: 10.1016/S0140-6736(20)30183-5. [DOI] [PMC free article] [PubMed] [Google Scholar]
- 5.Fang Y, Zhang H, Xie J, Lin M, Ying L, Pang P, Ji W. 2020. Sensitivity of chest CT for COVID-19: comparison to RT-PCR in radiology. 10.1148/radiol.2020200432. [DOI] [PMC free article] [PubMed]
- 6.NG M, et al. 2020. Imaging profile of the COVID-19 infection: radiologic findings and literature review in radiology. Cardiothoracic Imaging 2(1). 10.1148/ryct.2020200034. [DOI] [PMC free article] [PubMed]
- 7.Li Y, Xia L. 2020. Coronavirus disease 2019 (COVID-19): role of chest CT in diagnosis and management. Am J Roentgenol: 1–7. 10.2214/AJR.20.22954. [DOI] [PubMed]
- 8.WHO Coronavirus disease (COVID-2019) situation reports. 2020. https://www.who.int/emergencies/diseases/novel-coronavirus-2019/situation-reports, report #133.
- 9.Zhou S, Wang Y, Zhu T, Xia L. CT features of coronavirus disease 2019 (COVID-19) pneumonia in 62 patients in Wuhan, China. Am J Roentgenol: 1–8. 10.2214/AJR.20.22975. [DOI] [PubMed]
- 10.Ye Z, Zhang Y, Wang Y, Huang Z, Song B. 2020. Chest CT manifestations of new coronavirus disease 2019 (COVID-19): a pictorial review. European Radiology. [DOI] [PMC free article] [PubMed]
- 11.Yoon S, et al. Chest radiographic and CT findings of the 2019 novel coronavirus disease (COVID-19): analysis of nine patients treated in korea. Korean Journal of Radiology. 2020;21(4):494–500. doi: 10.3348/kjr.2020.0132. [DOI] [PMC free article] [PubMed] [Google Scholar]
- 12.Abbas A, Abdelsamea MM, Gaber MM. 2020. Classification of COVID-19 in chest X-ray images using DeTraC deep convolutional neural network. arXiv:2003.13815. [DOI] [PMC free article] [PubMed]
- 13.Sethy PK, Behera SK. 2020. Detection of coronavirus disease (COVID-19) based on deep features. Preprints 2020, 2020030300.
- 14.Li X, Li C, Zhu D. 2020. COVID-Mobilexpert: On-device COVID-19 screening using snapshots of chest X-ray. arXiv:2004.03042 43:915–925.
- 15.Das D, Santosh KC, Pal U. 2020. Truncated inception net: COVID-19 outbreak screening using chest X-rays. Physical and Engineering Sciences in Medicine: 1–11. [DOI] [PMC free article] [PubMed]
- 16.El asnaoui K, Chawki Y. 2020. Using X-ray images and deep learning for automated detection of coronavirus disease. Journal of Biomolecular Structure and Dynamics: 1–22. [DOI] [PMC free article] [PubMed]
- 17.Pereira RM, Bertolini D, Teixeira LO, Silla CN Jr, Costa YM. 2020. COVID-19 identification in chest X-ray images on flat and hierarchical classification scenarios. Comput Methods Prog Biomed: 105532. [DOI] [PMC free article] [PubMed]
- 18.Mangal A, Kalia S, Rajgopal H, Rangarajan K, Namboodiri V, Banerjee S, Arora C. 2020. CovidAID: COVID-19 detection using chest X-ray. arXiv:2004.09803.
- 19.Asif S, Wenhui Y, Jin H, Tao Y, Jinhai S. 2020. Classification of COVID-19 from chest X-ray images using deep convolutional neural networks. medRxiv. [DOI] [PMC free article] [PubMed]
- 20.Luz E, Silva PL, Silva R, Moreira G. 2020. Towards an efficient deep learning model for COVID-19 patterns detection in X-ray images. arXiv:2004.05717.
- 21.Szegedy C, Vanhoucke V, Ioffe S, Shlens J, Wojna Z. Rethinking the inception architecture for computer vision. Proceedings of the IEEE conference on computer vision and pattern recognition; 2016. p. 2818–2826.
- 22.Zhang J, Xie Y, Li Y, Shen C, Xia Y. 2020. COVID-19 screening on chest X-ray images using deep learning based anomaly detection. In arXiv.
- 23.Gan F, Luo C, Liu X, Wang H, Peng L. Fast terahertz coded-aperture imaging based on convolutional neural network. Appl Sci. 2020;10:2661. doi: 10.3390/app10082661. [DOI] [Google Scholar]
- 24.Wang L, Lin ZQ, Wong A. 2020. COVID-net: a tailored deep convolutional neural network design for detection of COVID-19 cases from chest radiography images. In arXiv. [DOI] [PMC free article] [PubMed]
- 25.Santosh KC. AI-driven tools for coronavirus outbreak: need of active learning and cross-population train/test models on multitudinal/multimodal data. J Med Syst. 2020;44:93. doi: 10.1007/s10916-020-01562-1. [DOI] [PMC free article] [PubMed] [Google Scholar]
- 26.Krizhevsky A, Sutskever I, Hinton GE. Imagenet classification with deep convolutional neural networks. Advances in neural information processing systems; 2012. p. 1097– 1105.
- 27.Chen H, Su C. An enhanced hybrid MobileNet. 2018 9th international conference on awareness science and technology (iCAST), Fukuoka; 2018. p. 308–312.
- 28.Apostolopoulos ID, Mpesiana TA. 2020. Covid-19: automatic detection from x-ray images utilizing transfer learning with convolutional neural networks. Physical and Engineering Sciences in Medicine: 1. [DOI] [PMC free article] [PubMed]
- 29.Akiba T, Suzuki S, Fukuda K. 2017. Extremely large minibatch sgd: training resnet-50 on imagenet in 15 minutes. arXiv:1711.04325.