

Abstract
Background
GD2 is a ganglioside that is ubiquitously expressed in the plasma membrane of neuroblastoma and is shed into the circulation.
Procedure
GD2 was measured with a high-pressure liquid chromatography/tandem mass spectrometry assay in serum or plasma from 40 children without cancer (controls) and in biobanked samples from 128 (73 high-risk) children with neuroblastic tumors at diagnosis, 56 children with relapsed neuroblastoma, 14 children with high-risk neuroblastoma after treatment, and 8 to 12 children each with 10 other common childhood cancers at diagnosis.
Results
The C18 (18 carbon fatty acid) lipoform was the predominant circulating form of GD2 in controls and in patients with neuroblastoma. The median concentration of GD2 in children with high-risk neuroblastoma at diagnosis was 167 nM (range, 16.1–1060 nM), which was 30-fold higher than the median concentration (5.6 nM) in controls. GD2 was not elevated in serum from children with the differentiated neuroblastic tumors, ganglioneuroma (n=10) and ganglioneuroblastoma-intermixed subtype (n=12), and in children with 10 other childhood cancers. GD2 concentrations were significantly higher in serum from children with MYCN amplified tumors (p=0.0088), high-risk tumors (p<0.00001), INSS stage 4 tumors (p<0.00001), and in children who died (p=0.034).
Conclusions
Circulating GD2 appears to be a specific and sensitive tumor biomarker for high-risk/high-stage neuroblastoma and may prove to be clinically useful as a diagnostic or prognostic circulating tumor biomarker. GD2 will be measured prospectively and longitudinally in children enrolled on a high-risk neuroblastoma treatment trial to assess its ability to measure response to treatment and predict survival.
Keywords: Neuroblastoma, ganglioside, biomarker
INTRODUCTION
Circulating tumor biomarkers (CTBs) are essential tools in clinical practice and clinical research.1 Clinically, CTBs are useful for screening or early detection of cancers, for diagnosis and determining prognosis, and for predicting response to treatment, monitoring response and detecting relapse or tumor progression. Research applications of CTBs parallel their clinical uses (e.g., prognostic CTBs are used to select or stratify subjects on randomized clinical trials), and CTBs that are used as clinical trial endpoints should have demonstrated clinical relevance.
GD2 is a ganglioside (sialic acid-containing glycosphingolipid, Fig. 1) that is found primarily on neuronal cells2 and is also expressed on neuroblastoma tumor cells.3,4 GD2 has a lipid domain (ceramide) that inserts into the plasma membrane and an extracellular glycan domain that contributes to the glycocalyx coating the cell surface. The fatty acid chain of ceramide varies in length resulting in multiple GD2 lipoforms. The glycan domain of GD2 is the target of dinutuximab, which is a therapeutic, chimeric monoclonal antibody approved by the US Food and Drug Administration for treating high-risk neuroblastoma.5
Fig 1.
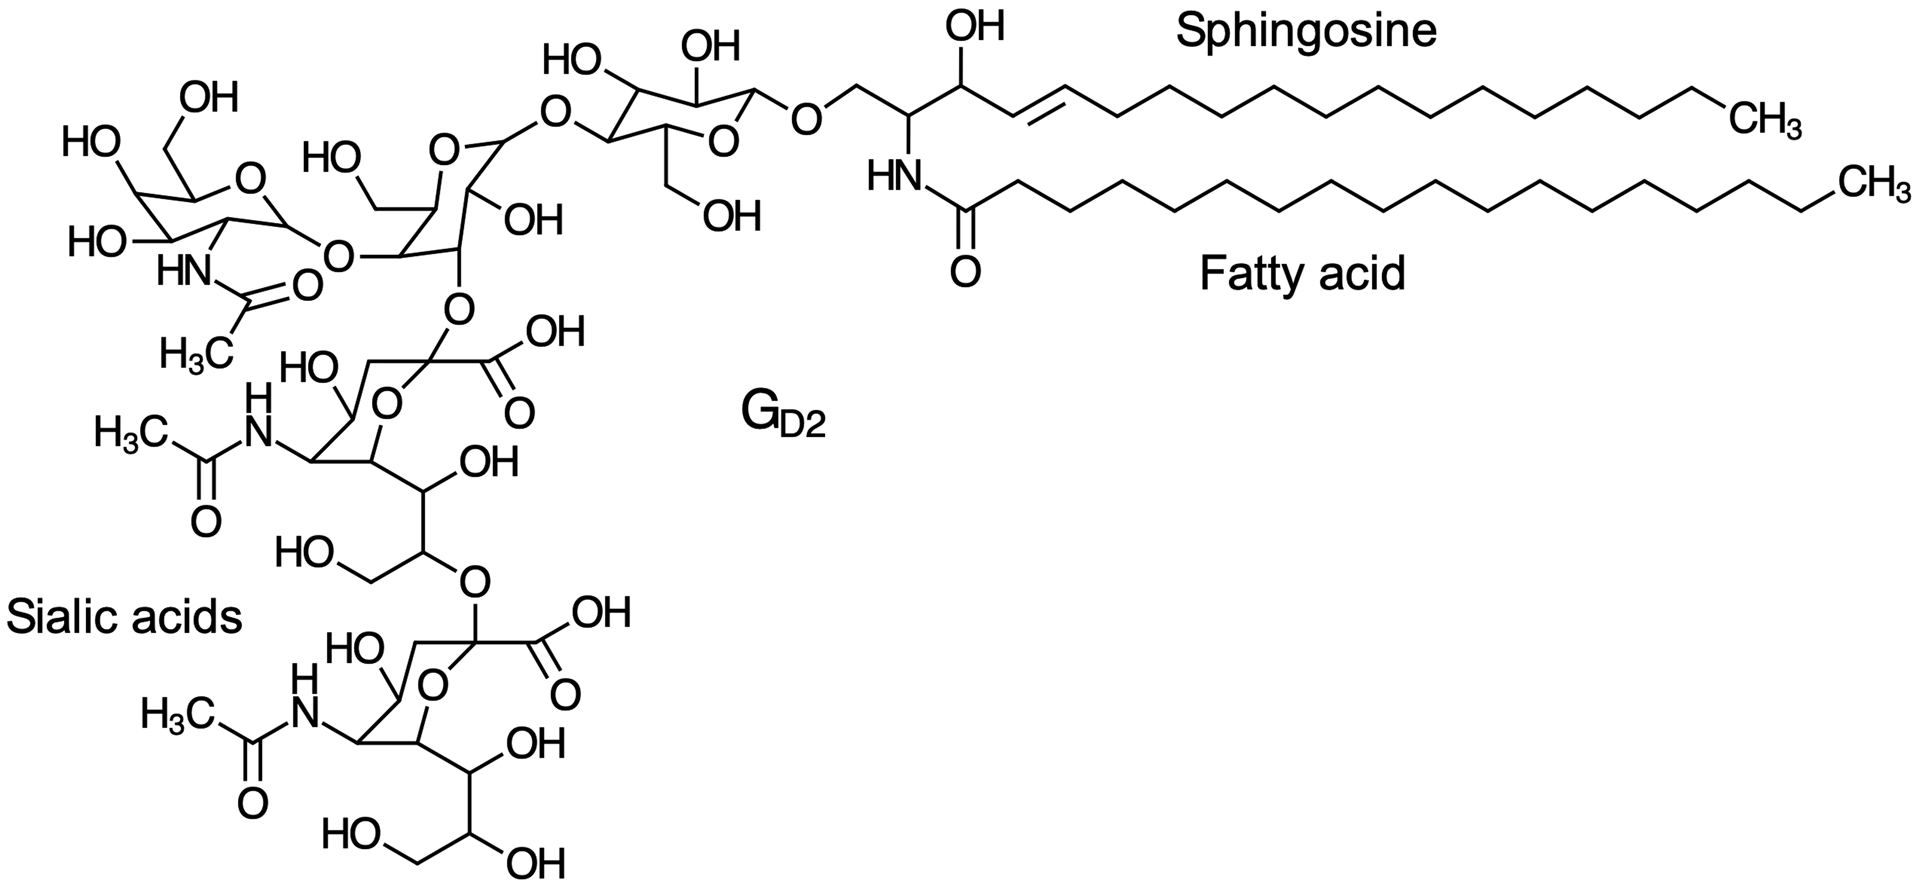
Chemical structure of the C18 lipoform of GD2. The lipid domain, ceramide, is composed of sphingosine and a fatty acid with variable chain lengths. The glycan domain includes 2 sialic acids.
GD2 is detected on >90% of neuroblastoma specimens by immunohistochemistry,3 and is shed from tumor cells into the circulation of patients with neuroblastoma.6,7 Higher circulating GD2 concentrations were associated with higher stage, more rapid tumor progression and poorer survival.7 In these studies, GD2 was measured by thin layer chromatography, which is not amenable to rapidly quantifying GD2 in large sample sets. We developed and validated a high-pressure liquid chromatography/tandem mass spectrometry (HPLC/MS/MS) assay for the predominant lipoforms of GD2 in plasma and serum,8 and measured GD2 in archived serum samples from children with an array of neuroblastic tumors at diagnosis and relapse. This assay method is adaptable for clinical use. In addition, serum samples from children with other common childhood cancers and children without cancer were studied. Our ultimate goal is to determine whether circulating GD2 could serve as a clinical trial endpoint to measure tumor burden and response to treatment or to predict relapse and survival outcomes.
METHODS
Patient Samples
We measured the concentration of GD2 in serum or plasma samples that were previously collected and stored in biospecimen repositories for the childhood cancers listed below. The children who provided the samples that were used in this study were enrolled on a variety of IRB-approved Children’s Oncology Group (COG) biology or treatment protocols unless specified.
Serum samples from 128 children with neuroblastic tumors were provided through the COG’s Biopathology Center. Samples were collected at diagnosis from patients with ganglioneuroma (GN, n=10), ganglioneuroblastoma, intermixed subtype (GNB-i, n=12), ganglioneuroblastoma, nodular subtype (GNB-n, n=16), and neuroblastoma/ neuroblastic tumor (NBL, n=90). Twenty-nine were from patients with low risk tumors (10 GN, 9 GNB-i, 3 GNB-n, and 7 NBL), 13 had intermediate risk tumors (3 GNB-i and 10 NBL), and 86 had high-risk tumors (13 GNB-n and 73 NBL) according to the COG classification system. MYCN was amplified in 40 of the 73 high-risk NBL samples and non-amplified in 33. International Neuroblastoma Staging System (INSS) stage was stage 1 in 18, stage 2A in 5, stage 2B in 15, stage 3 in 8, stage 4 in 80 and stage 4S in 2.
Serum samples from 56 children who had relapsed NBL and who were enrolled on the COG phase 2 trial ANBL1221.
Plasma samples from 14 children with high-risk NBL receiving post-consolidation immunotherapy with dinutuximab after completing induction and consolidation therapy were collected at the Children’s Hospital of Philadelphia (CHOP). Patients were enrolled on an institutional IRB-approved protocol, and samples were collected prior to starting a course of dinutuximab.
Serum samples from children with other common childhood cancers were provided through the COG’s Biopathology Center and included samples from 8 children each with Wilms tumor, non-Hodgkin lymphoma, Hodgkin lymphoma, hepatoblastoma, rhabdomyosarcoma, Ewing sarcoma, and acute myelogenous leukemia.
Serum samples from 8 children each with medulloblastoma and high-grade glioma were provided by the Children’s Brain Tumor Tissue Consortium (CBTTC). Patients were enrolled on the CBTTC’s biospecimen protocol.
Plasma samples from 12 children with osteosarcoma were collected at CHOP. Patients were enrolled on an IRB-approved protocol and samples were collected prior to starting treatment.
The clinical laboratory at CHOP provided de-identified serum samples left over from clinical tests on 40 children without cancer to serve as a control sample set.
GD2 Assay Method
The concentrations of the 18 and 20 fatty acid carbon chain length GD2 lipoforms (C18 and C20) were measured using a previously reported, validated high-pressure liquid chromatography, tandem mass spectrometry method with a lower limit of quantification for the C18 and C20 lipoforms of 3 nM.8 The method was validated in serum and plasma. Human brain-derived GD2, which is made up of approximately 60% C20 and 40% C18 lipoforms, was used to construct the standard curves for the assay. In serum/plasma from control samples and samples from children with NBL, the C18 lipoform was the predominant form of GD2.
Data Analysis and Statistics
Median, range and interquartile range were used to describe the GD2 concentrations in the various subsets of samples listed above. Non-parametric methods were used to compare the GD2 concentrations in subsets of samples from children with NBL based on risk group, stage, MYCN status and survival (Mann-Whitney) and correlate the concentrations of the C18 and C20 lipoforms of GD2 in samples from children with stage 4 NBL (Spearman correlation).
RESULTS
Table 1 lists the GD2 serum concentrations of the C18 lipoform in control samples from 40 children without cancer and in 128 pre-treatment samples from children with neuroblastic tumors. The concentration of the C18 lipoform of GD2 was below the lower limit of quantification (<3 nM) in 16 of the 40 control samples, and ranged up to 15.5 nM in the remaining control samples. The C20 lipoform was measurable in only 3 of 40 control samples at concentrations <5 nM.
TABLE 1.
GD2 concentrations in control samples and samples from children with neuroblastic tumors
| C18 Lipoform of GD2 [nM] | ||||
|---|---|---|---|---|
| Group | N | Median | Range | Interquartile Range* |
| Controls | 40 | 5.6 | <LLQ – 15.5 | <LLQ – 9.0 |
| Ganglioneuroma | 10 | 4.1 | <LLQ – 9.4 | <LLQ – 5.2 |
| Ganglioneuroblastoma – Intermixed | 12 | 6.4 | <LLQ – 15.3 | 4.1 – 9.0 |
| Ganglioneuroblastoma – nodular | 16 | 39.1 | <LLQ – 258 | 8.4 – 136 |
| GNB–n, stage 1–3 | 5 | 6.0 | <LLQ – 167 | |
| GNB–n, stage 4 | 11 | 51.4 | 8.6 – 258 | 22.7 – 175 |
| GNB–n, high risk | 13 | 47.7 | 4.5 – 258 | 13.0 – 140 |
| Neuroblastoma (NBL) | 90 | 147 | 7.8 – 1060 | 45.4 – 300 |
| NBL by stage | ||||
| Stage 1–2 | 14 | 21.3 | 7.8 – 880 | 15.4 – 51.1 |
| Stage 3 | 5 | 35.5 | 16.8 – 330 | |
| Stage 4 | 69 | 188 | 16.1 – 1060 | 82.0 – 333 |
| Stage 4S | 2 | 51.5 – 262 | ||
| NBL by risk group (excluding 4S) | ||||
| Low risk | 6 | 21.3 | 7.8 – 880 | |
| Intermediate risk | 9 | 20.6 | 7.9 – 68.3 | 15.4 – 51.1 |
| High risk | 73 | 167 | 16.1 – 1060 | 79.8 – 330 |
| Relapsed neuroblastoma | 56 | 28.2 | 3.0 – 389 | 16.3 – 47.4 |
| NBL post-consolidation | 11 | 8.2 | 3.0 – 21.1 | 5.8 – 11.2 |
Interquartile range derived for datasets with at least 7 samples
The C18 lipoform was also the predominant form of GD2 in samples from children with neuroblastic tumors. GD2 concentrations were elevated in these serum samples, and concentrations were related to histology and INSS tumor stage (Table 1). In samples from children with GN and GNB-i subtype, the GD2 concentrations were within the range of the control samples, but GD2 was elevated in the pretreatment serum samples from children with GNB-n subtype and with NBL. The highest concentrations were in samples from children with metastatic (INSS stage 4) disease. The median concentration of the C18 lipoform of GD2 in the samples from children with stage 4 NBL was 30-fold higher than the median concentration in control samples.
The C20 lipoform was measurable in 65 of the 69 serum samples from children with stage 4 NBL, but the concentrations of the C20 lipoform were substantially lower (median, 15.9 nM; range, <LLQ to 68.1 nM) than the concentrations of the C18 lipoform. There was a correlation between the concentrations of the C18 and C20 lipoforms (R=0.81, Supplemental Fig. 1), but the ratio of the concentrations of the C18 to C20 lipoforms in children with stage 4 NBL ranged from 2.9 to 35 (median, 12).
As shown in Fig. 2, GD2 concentrations were significantly higher in serum from children with INSS stage 4 disease compared to stage 1–3 NBL (p<0.0001) and with high-risk vs. non-high-risk NBL (p<0.0001). In the subset of samples from children with high-risk NBL, GD2 concentrations were significantly higher in samples from patients whose NBL was MYCN amplified (p=0.0088) and in those who did not survive (p=0.034).
Fig 2.
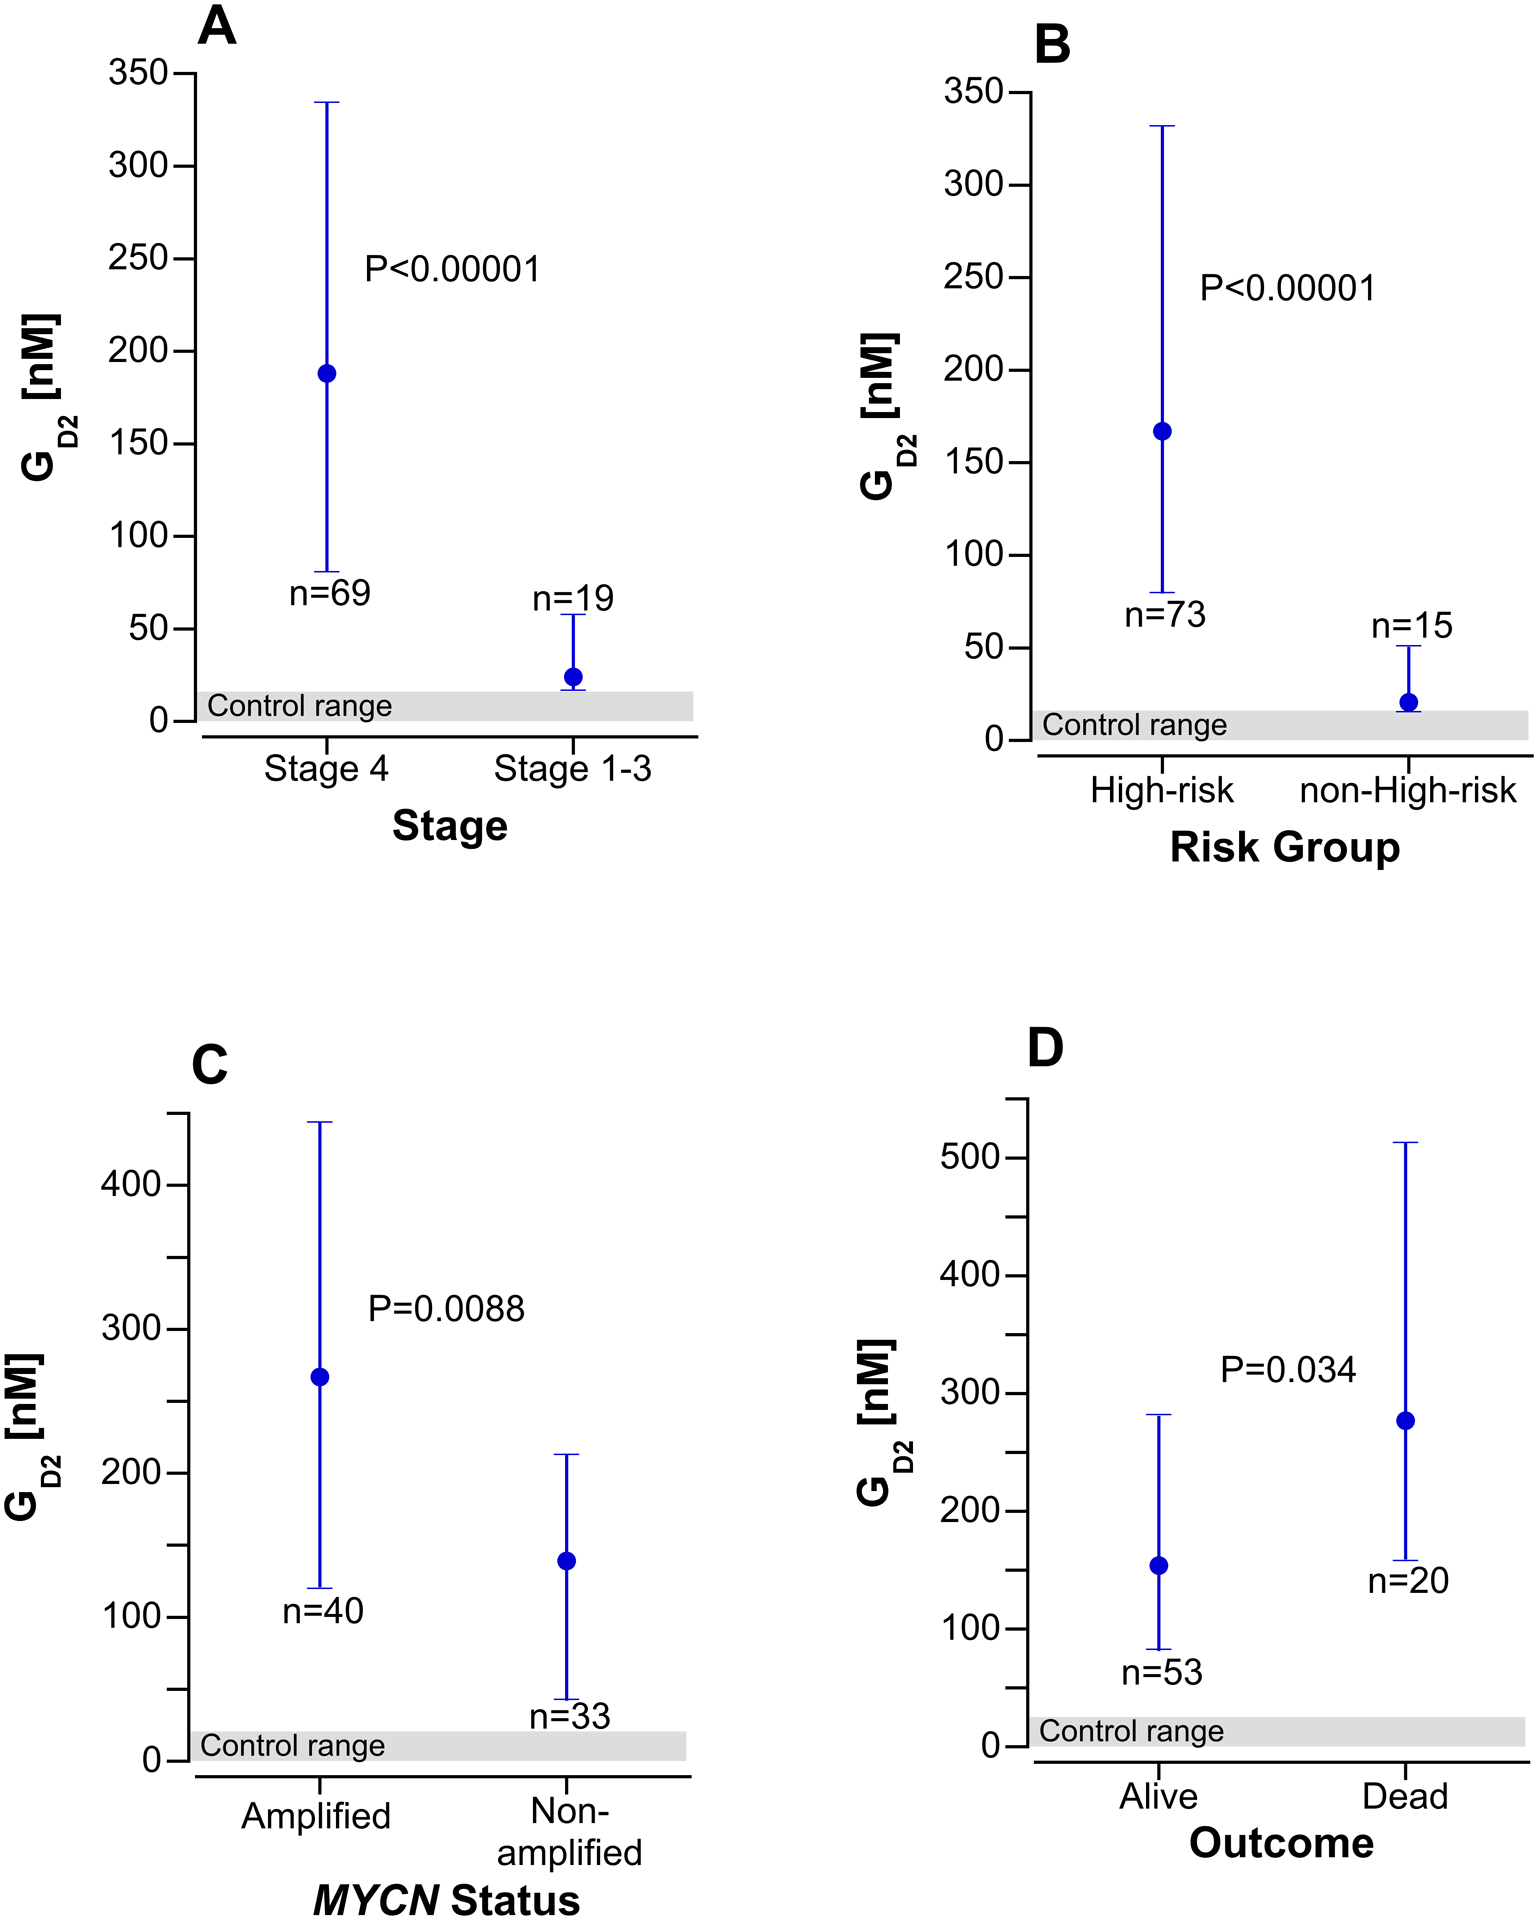
Serum GD2 concentrations at diagnosis in children with neuroblastoma by stage (A), risk group (B), MYCN status (C) and survival outcome (D). The points are the median value and the error bars are the interquartile range. Panels A and B include 88 children with the histological diagnosis of neuroblastoma, peripheral neuroblastic tumor, NOS, or neuroblastic tumor, NOS, excluding the 2 children with stage 4S neuroblastoma. Panel C and D includes only 73 children with high-risk NBL. The shaded area at the bottom of each graph is the serum GD2 concentration range in 40 control subjects.
GD2 concentrations were also elevated in samples from 56 children with relapsed NBL, but at lower levels than in samples from initial diagnosis (Table 1). GD2 concentrations in 10 of the 11 samples taken prior to the first dose of dinutuximab from children who were in remission and scheduled to receive immunotherapy were within the control range and one sample was slightly elevated at 21.1 nM.
The serum GD2 concentrations in samples from children with other common types of childhood cancers are listed in Table 2. All samples from children with non-CNS cancers fell within the range of the control samples for both lipoforms (C18 and C20). However, GD2 concentrations exceeded the upper range of the controls in 3 of 8 samples (maximum concentration, 35 nM) from children with high-grade gliomas and 7 of 8 samples (maximum concentration, 111 nM) from children with medulloblastoma.
TABLE 2.
GD2 concentrations in samples from children with other childhood cancers
| C18 Lipoform of GD2 [nM] | ||||
|---|---|---|---|---|
| Group | N | Median | Range | Interquartile Range |
| Controls | 40 | 5.6 | <LLQ – 15.5 | |
| Medulloblastoma | 8 | 34 | 6 – 111 | 25 – 42 |
| High-grade glioma | 8 | 11 | <LLQ – 35 | |
| Osteosarcoma | 12 | 3.0 | <LLQ – 13 | |
| Ewing sarcoma | 8 | <LLQ | <LLQ - <LLQ | |
| Rhabdomyosarcoma | 8 | 4.5 | <LLQ – 10 | |
| Wilms tumor | 8 | 6.5 | <LLQ – 8.0 | |
| Hepatoblastoma | 8 | 6.5 | <LLQ – 10 | |
| Hodgkin lymphoma | 8 | <LLQ | <LLQ – 6.0 | |
| Non-Hodgkin lymphoma | 8 | <LLQ | <LLQ – 7.0 | |
| Acute myelogenous leukemia | 8 | <LLQ | <LLQ - <LLQ | |
DISCUSSION
An ideal CTB is produced by tumor cells and shed into the circulation or other accessible body fluid, can be accurately measured using small specimens with a cost-effective, sensitive and specific assay, reflects tumor burden and response to treatment, detects tumors at early or preclinical stages and detects minimal residual disease after treatment, and is low or undetectable in blood/body fluids of controls. GD2, which is measurable in the circulation at concentrations higher than controls in all of the serum samples from children with high-risk and high-stage NBL, has many of the attributes of an ideal CTB in this retrospective study using archived serum samples. Serum GD2 concentration appears to clearly discriminate between high-risk/high-stage NBL and low-risk, more differentiated (GN, GNB-i) tumors. This is consistent with previous reports showing that immunohistochemical staining intensity for GD2 using 3A7 monoclonal antibody is dependent on the degree of differentiation.4 Staining is most intense in stroma poor, undifferentiated NBL, and scant GD2 staining is seen on GNs.
Serum GD2 concentrations in the 73 serum samples from children with high-risk NBL were variable (range, 16.1 to 1060 nM for the C18 lipoform). Possible tumor determinants of the circulating GD2 concentration include overall tumor burden, level of GD2 expression on the cell surface, tumor growth rate, and the extent of tumor necrosis. The relationship of circulating GD2 concentration to tumor burden at diagnosis will be studied prospectively.
Our results suggest that GD2 may have utility in the clinical setting as a diagnostic and prognostic CTB. GD2 was not elevated in the serum of children with other common, non-CNS childhood cancers (including osteosarcoma, which expresses GD2 on the tumor cell surface4), indicating that GD2 is specific for NBL. In addition, GD2 serum concentrations were significantly higher in children with high-risk, high-stage and MYCN-amplified NBL. GD2 concentrations were also higher in samples from children who had high-risk NBL and who died. Rigorous prospective studies are required to validate a new prognostic tumor biomarker.9
Serum GD2 was elevated in children with medulloblastoma, albeit to a lesser extent than in children with NBL. GD2 has been previously shown to be expressed on the cell surface of most high-grade gliomas and medulloblastomas.10 Serum GD2 is not likely to be a sensitive CTB for medulloblastoma based on the limited number of samples studied, but we plan to measure GD2 in the cerebrospinal fluid of patients with medulloblastoma to determine whether it can detect and quantify leptomeningeal tumor spread.
The promising results of this retrospective study will be validated by longitudinally monitoring plasma GD2 over the course of treatment in COG clinical trials enrolling children with newly diagnosed NBL. This platform should also allow us evaluate GD2 as a potential clinical trial endpoint to measure tumor burden at diagnosis and response to treatment and to predict relapse or survival. CTBs that are validated clinical trial endpoints of treatment outcomes can improve the accuracy and sensitivity of assessing tumor response and could substantially shorten the time line of phase 3 trials if they are predictive of subsequent relapse or survival.
CTBs have potential advantages over tumor measurements from serial imaging studies in assessing tumor burden, response to treatment and monitoring for recurrence:
CTBs that reflect tumor burden can provide a more objective continuous measure of change in total tumor burden compared to response categories (CR, PR, etc.) derived from time consuming tumor measurements taken from selected lesions that are >1 cm in diameter on imaging studies.
CTBs are more cost effective and more convenient.
CTBs avoid radiation exposure and risks of sedation/anesthesia.
CTBs can be measured more frequently and do not require advanced scheduling.
Sensitive CTBs can quantify response in patients with evaluable (e.g., MIBG positive) or undetectable disease on imaging studies and in matrix-producing tumors, which are difficult to assess by imaging.
GD2 is the ligand for the therapeutic monoclonal antibody, dinutuximab, and circulating GD2 binding to dinutuximab in plasma could block the antibody’s therapeutic effect or potentially increase its toxicity through systemic complement activation. The previously reported association constant (KA) of dinutuximab for GD2 is high (3.5 × 10⁸ M−1 or 0.35 nM−1).11 Using this KA, we estimated that 200 nM GD2 would saturate >95% of dinutuximab binding sites (assuming two binding sites per antibody molecule) at the peak dinutuximab concentration of 10 μg/mL (~70 nM) after a standard course of 17.5 mg/m2 daily × 4 doses.12 This GD2 concentration is equivalent to the median concentration in the samples from patients with stage 4, high-risk NBL, at diagnosis. We measured GD2 concentrations in plasma from 14 patients receiving post-consolidation therapy with dinutuximab, and GD2 concentrations were in the control range in all but 1 patient. The use of dinutuximab in up front induction regimens when circulating GD2 concentrations are likely to be higher could impact dinutuximab’s efficacy, if its binding sites are occupied by circulating GD2.
The use of archived serum samples for this initial study of circulating GD2 allowed us to efficiently establish GD2’s potential as a CTB for NBL, but the retrospective nature of the study has limitations.13 Serum samples used in this study had been stored for varied lengths of time, and this could have contributed to variability in the serum GD2 concentrations. The serum samples were collected on the COG NBL biology protocol (ANBL00B1), and the patients were not treated uniformly, which limits our ability to assess its prognostic value. The available clinical information, such as measures of tumor burden at diagnosis, was also limited. It is also possible that some specimens were collected after surgical resection of the primary mass in some low risk patients, and this could result in underestimation of the serum GD2 concentration. Prospective studies to validate our observations and study the clinical utility and research applications of circulating GD2 must be conducted, but may take up to a decade to complete. This study demonstrates the value of performing the initial evaluation of a CTB in archived samples for rare cancers like NBL.
Circulating GD2 appears to be a specific and sensitive CTB for high-risk/high-stage NBL. Our retrospective results will be validated by prospectively and longitudinally monitoring circulating GD2 over the course of frontline therapy on the current COG high-risk NBL clinical trial (ANBL1531) to further evaluate its potential clinical utility and its role as a clinical trial endpoint in quantifying tumor burden, monitoring response to therapy, detecting recurrence and predicting survival. We are also more precisely defining GD2 reference ranges in infants and young children without cancer and studying the pharmacokinetics of GD2 in an animal model.
Supplementary Material
Supplemental Fig 1. Relationship between the serum concentrations of the 2 circulating lipoforms (C18 and C20) of GD2 in serum samples from 65 children with stage 4 NBL. The C20 lipoform was below the limits of quantification in 4 samples from children with stage 4 NBL. These 4 are not included in this analysis.
Acknowledgements:
Serum samples from children who had relapsed neuroblastoma and who were enrolled on ANBL1221 were provided from Alice Yu’s laboratory from the University of California, San Diego; and serum samples from children with acute myelogenous leukemia were provided from Terzah Horton’s laboratory at Baylor College of Medicine, Houston.
Funding: This research was supported by the National Cancer Institute at the National Institutes of Health 1U10CA180884-01 (Solid Malignancy Integrated Translational Science Center Grant), U10CA180886 (NCTN Network Group Operations Center Grant), U10CA180899 (NCTN Statistics & Data Center Grant), U24CA114766 (Human Specimen Banking in NCI-Sponsored Clinical Trials Grant); Childhood Brain Tumor Tissue Consortium; Alex’s Lemonade Stand Foundation Center of Excellence Grant; Louis and Amelia Canuso Family Endowed Chair for Clinical Research.
Abbreviations
- CBTTC
Children’s Brain Tumor Tissue Consortium
- CHOP
Children’s Hospital of Philadelphia
- COG
Children’s Oncology Group
- CTB
Circulating tumor biomarker
- GN
ganglioneuroma
- GNB-i
Ganglioneuroblastoma, intermixed
- GNB-n
Ganglioneuroblastoma, nodular
- INSS
International Neuroblastoma Staging System
- IRB
Institutional Review Board
- KA
Association constant
- LLQ
Lower limit of quantification
- NBL
neuroblastoma/ neuroblastic tumor
Footnotes
Conflict of Interest Statement: the authors have no conflicts to disclose
REFERENCES
- 1.Mordente A, Meucci E, Martorana GE, Silvestrini A. Cancer Biomarkers Discovery and Validation: State of the Art, Problems and Future Perspectives. Adv Exp Med Biol. 2015;867:9–26. [DOI] [PubMed] [Google Scholar]
- 2.Kolter T Ganglioside biochemistry. ISRN Biochem. 2012;2012:506160. [DOI] [PMC free article] [PubMed] [Google Scholar]
- 3.Wu ZL, Schwartz E, Seeger R, Ladisch S. Expression of GD2 ganglioside by untreated primary human neuroblastomas. Cancer Res. 1986;46(1):440–443. [PubMed] [Google Scholar]
- 4.Sariola H, Terava H, Rapola J, Saarinen UM. Cell-surface ganglioside GD2 in the immunohistochemical detection and differential diagnosis of neuroblastoma. American Journal of Clinical Pathology. 1991;96(2):248–252. [DOI] [PubMed] [Google Scholar]
- 5.Yu AL, Gilman AL, Ozkaynak MF, et al. Anti-GD2 antibody with GM-CSF, interleukin-2, and isotretinoin for neuroblastoma. New England Journal of Medicine. 2010;363(14):1324–1334. [DOI] [PMC free article] [PubMed] [Google Scholar]
- 6.Ladisch S, Wu ZL. Detection of a tumour-associated ganglioside in plasma of patients with neuroblastoma. Lancet. 1985;1(8421):136–138. [DOI] [PMC free article] [PubMed] [Google Scholar]
- 7.Ladisch S, Wu ZL, Feig S, et al. Shedding of GD2 ganglioside by human neuroblastoma. Int J Cancer. 1987;39(1):73–76. [DOI] [PubMed] [Google Scholar]
- 8.Busch CM, Desai AV, Moorthy GS, Fox E, Balis FM. A validated HPLC-MS/MS method for estimating the concentration of the ganglioside, GD2, in human plasma or serum. J Chromatogr B Analyt Technol Biomed Life Sci. 2018;1102–1103:60–65. [DOI] [PubMed] [Google Scholar]
- 9.Sauerbrei W, Taube SE, McShane LM, Cavenagh MM, Altman DG. Reporting Recommendations for Tumor Marker Prognostic Studies (REMARK): An Abridged Explanation and Elaboration. J Natl Cancer Inst. 2018;110(8):803–811. [DOI] [PMC free article] [PubMed] [Google Scholar]
- 10.Longee DC, Wikstrand CJ, Mansson JE, et al. Disialoganglioside GD2 in human neuroectodermal tumor cell lines and gliomas. Acta Neuropathol. 1991;82(1):45–54. [DOI] [PubMed] [Google Scholar]
- 11.Mujoo K, Cheresh DA, Yang HM, Reisfeld RA. Disialoganglioside GD2 on human neuroblastoma cells: target antigen for monoclonal antibody-mediated cytolysis and suppression of tumor growth. Cancer Res. 1987;47(4):1098–1104. [PubMed] [Google Scholar]
- 12.Desai AV, Fox E, Smith LM, Lim AP, Maris JM, Balis FM. Pharmacokinetics of the chimeric anti-GD2 antibody, ch14.18, in children with high-risk neuroblastoma. Cancer Chemother Pharmacol. 2014;74(5):1047–1055. [DOI] [PubMed] [Google Scholar]
- 13.Simon RM, Paik S, Hayes DF. Use of archived specimens in evaluation of prognostic and predictive biomarkers. J Natl Cancer Inst. 2009;101(21):1446–1452. [DOI] [PMC free article] [PubMed] [Google Scholar]
Associated Data
This section collects any data citations, data availability statements, or supplementary materials included in this article.
Supplementary Materials
Supplemental Fig 1. Relationship between the serum concentrations of the 2 circulating lipoforms (C18 and C20) of GD2 in serum samples from 65 children with stage 4 NBL. The C20 lipoform was below the limits of quantification in 4 samples from children with stage 4 NBL. These 4 are not included in this analysis.