Abstract
Muscle wasting in cancer is associated with deficits in protein synthesis, yet the mechanisms underlying this anabolic impairment remain poorly understood. The capacity for protein synthesis is mainly determined by the abundance of muscle ribosomes, which is in turn regulated by transcription of the ribosomal (r)RNA genes (rDNA). In this study, we investigated whether muscle loss in a pre-clinical model of ovarian cancer is associated with a reduction in ribosomal capacity and was a consequence of impaired rDNA transcription. Tumor bearing resulted in a significant loss in gastrocnemius muscle weight and protein synthesis capacity, and was consistent with a significant reduction in rDNA transcription and ribosomal capacity. Despite the induction of the ribophagy receptor NUFIP1 mRNA and the loss of NUFIP1 protein, in vitro studies revealed that while inhibition of autophagy rescued NUFIP1, it did not prevent the loss of rRNA. Electrophoretic analysis of rRNA fragmentation from both in vivo and in vitro models showed no evidence of endonucleolytic cleavage, suggesting that rRNA degradation may not play a major role in modulating muscle ribosome abundance. Our results indicate that in this model of ovarian cancer-induced cachexia, the ability of skeletal muscle to synthesize protein is compromised by a reduction in rDNA transcription and consequently a lower ribosomal capacity. Thus, impaired ribosomal production appears to play a key role in the anabolic deficits associated with muscle wasting in cancer cachexia.
Keywords: Cancer cachexia, muscle wasting, anabolic deficit, ribosome biogenesis, rDNA transcription, RNA Polymerase 1
Introduction
Cachexia is a devastating condition that develops in ~80 % of all cancer patients and is responsible for ~30% of all cancer-related deaths.1–3 Muscle wasting is a typical feature of cachexia4,5 that leads to loss of function, reduced quality of life, chemotherapy intolerance, and lower survival rates.6,7 For example, in ovarian cancer, the most lethal gynecological malignancy and fifth leading cause of cancer-related death in women,4 a significant loss of skeletal muscle mass is often associated with a shorter life expectancy.8–11 Thus, understanding the mechanisms responsible for muscle wasting in cancer cachexia is critical for implementing effective treatments to prevent the loss of muscle mass, improve quality of life, reduce chemotherapy-related toxicity, and increase survival rates.12–14
Muscle mass is regulated by the balance between protein synthesis and degradation.15–17 Insults that either decrease synthesis or increase breakdown can adversely influence protein turnover resulting in net negative nitrogen balance and muscle loss.16,18–22 An understudied aspect of protein metabolism in cancer is the regulation of the capacity for muscle protein synthesis. Deficits in protein synthesis have been consistently reported in both cancer patients and pre-clinical models of various cancers,23–25 and is considered to be an early event in the development of muscle wasting.21,22 A decline in protein synthesis rates occurs earlier than detectable increases in protein degradation,18 with an onset of 4 days after implantation of tumor cells.19 Protein synthesis rates are primarily determined by the ribosomal or translational capacity of the muscle, i.e., ribosome content.26 Therefore, it seems logical to predict that in wasting cachexia, a reduction in ribosomal capacity will lead to deficits in protein synthesis and consequently, muscle loss. Ribosome production is regulated by transcription of the ribosomal (r)RNA genes (rDNA) by RNA Polymerase I (Pol I).27–32 The activity of the Pol I multi-subunit holoenzyme is supported by several accessory factors that collectively modulate rDNA transcription rates.27,28 The Upstream Binding Factor (UBF) and Selectivity Factor 1 (SL1) direct accurate and promoter-specific transcription initiation, and serve as promoter recognition for the Transcription Initiation Factor (TIF)-1A (or Rrn3) Pol I complex.33–35 Pol I then transcribes rDNA to generate a 45S pre-rRNA transcript that is subsequently processed into the 18S, 5.8S, and 28S rRNA subunits. Transcription by Pol I is rate limiting for ribosome production, thus a reduction in rDNA transcription will result in compromised anabolism and will limit the capacity for muscle protein synthesis. In addition to transcription rates per gene copy, ribosomal production can be modulated by the number of active rDNA,36,37 these are present in several hundred copies, and their specific expression can be detected based on their variable length segment (v-rDNA) in the 5’ leader sequence (5’ETS).38 Whether the number of v-rDNA copies contributes differentially to skeletal muscle ribosomal production is currently unknown. Additional mechanisms other than reduced rDNA transcription may also modulate the level of ribosomal capacity of the muscle. Degradation of cellular components via autophagy can selectively target substrates and organelles via specific receptors,39 for example the nuclear fragile X mental retardation-interacting protein 1 (NUFIP1) has recently been identified as a ribosome receptor for ribophagy during periods of cellular stress.40 While both a reduction in rDNA transcription and increased ribosomal degradation may contribute to muscle wasting, their respective involvement in this process is unknown.
The present study examined whether a reduction in rDNA transcription and/or increased ribophagy played a role in muscle wasting. Using a previously established model of ovarian cancer with muscle depletion,41 we found that a significant reduction in rDNA transcription resulted in lower ribosomal capacity and substantial deficits in the ability of the muscle to synthesize proteins. Assessment of degradative pathways in vivo and in vitro revealed that although factors involved in ribophagy were modulated, interfering with this process rescued NUFIP1 degradation but did not prevent ribosomal loss. These findings suggest that the loss of muscle mass in cancer involves a reduction in ribosomal capacity via lower rRNA production, thus targeting the mechanisms regulating ribosomal capacity may lead to new strategies to prevent muscle wasting.
Materials and Methods
Animal model of ovarian cancer and cell culture experiments
For in vivo studies, we employed a mouse model of ovarian cancer with substantial muscle depletion as we previously described.41 Briefly, female Nod SCID gamma (NSG) (NOD-scid/IL2Rgnull) immunodeficient mice (In Vivo Therapeutics Core Facility, IU Simon Cancer Center, Indianapolis, IN, USA) were housed in a pathogen-free facility at IU. Human ES-2 cells (ATCC, CRL-1978, Manassas, VA) were cultured as previously described.41 Mice were randomized into controls (n = 6) and ES-2 hosts (n = 8), identified with a code, and the investigators were blinded during allocation, animal handling, and endpoint measurements. ES-2 cells (1 × 10⁷) were inoculated intraperitoneally in sterile saline, and controls received an equal volume of saline. Mice were weighed daily and sacrificed 14 days post-inoculation. The gastrocnemius muscles were dissected, weighed, frozen in liquid nitrogen, and stored at −80°C for further analyses. Plantaris muscles from 3 day overloaded and control mice were generated via synergist ablation for a previous study.42 Animal studies were approved by the Institutional Animal Care and Use Committee at IU School of Medicine and were in compliance with the NIH Guidelines for Use and care of Laboratory Animals and with the 1964 Declaration of Helsinki and its later amendments. For in vitro studies, we used C2C12 myoblasts (ATCC, CRL-1772) grown and differentiated into myotubes as previously described.43 To stimulate ribophagy and muscle wasting, myotubes were maintained in differentiation medium (DM), incubated with tumor conditioned media (CM) from confluent ES-2 culture plates, or switched to PBS to promote nutrient deprivation-induced autophagy and myotube atrophy.44,45 Autophagy was blocked by incubating myotubes with Chloroquine diphosphate salt (CLQ) (MP Biomedicals, Santa Ana, CA) in DMSO at 25 μM concentration for 24 hrs before replacing the media with CLQ in DM (DM + CLQ) or PBS (PBS + CLQ) for an additional 1 hr and 6 hr. In separate experiments, we inhibited ubiquitin-mediated proteolysis by treating myotubes with the reversible proteasome inhibitor Carbobenzoxy-Leu-Leu-Leucinal (MG-132) at 25 μM alone, or in combination with CLQ for 6 hr without CLQ pretreatment.
Protein synthesis, RNA extraction and quantification, cDNA synthesis, and qRT-PCR
Skeletal muscle protein synthesis was estimated using a non-radioactive adaptation of the peptidyl-puromycin method.46 Puromycin is added to nascent peptides (peptidyl-puromycin) by actively translating ribosomes, therefore puromycin labelled peptides will reflect the ribosomal capacity of the muscle. Briefly, 0.040 μmol puromycin/g body weight in 100 μl sterile PBS was injected i.p. 30 min before sacrifice. Proteins were extracted and resolved via SDS-PAGE, as described below. Total RNA was isolated from gastrocnemius muscles using TRizol (Invitrogen, Carlsbad, CA) and was subsequently purified using Direct-zol™ RNA MiniPrep columns (Zymo Research, Irvine, CA). RNA quantity, purity, and integrity were determined on a CLARIOstar Microplate Reader in the LVis Plate (BMG Labtech, Ortenberg, Germany) followed by agarose gel electrophoresis, respectively. cDNA was synthesized from 1 μg of total RNA using the SuperScript VILO cDNA synthesis kit (Invitrogen, CA) and subjected to a quantitative Real-Time Polymerase chain reaction (qRT-PCR) using GoTaq qPCR Master Mix (Promega, WI) on a Bio-Rad touch CFX-384 system. Relative expression levels were obtained by normalizing target genes of interest to GADPH by the comparative Ct (ΔΔCt) method using the Bio-Rad CFX Manager (version 3.0) software. Primer sequences utilized in the present study are listed in Table 1. Analysis of rRNA fragmentation (1 μl/well) was performed by capillary electrophoresis on an Agilent 2200 TapeStation system (Agilent Technologies, USA). RNA integrity number (RIN) and 28S/18S ratio data were also analyzed by using 2200 TapeStation software (Agilent Technologies, USA).
Table 1:
primers used in this study
| Target | Forward | Reverse |
|---|---|---|
| 45S Pre-rRNA (ETS) | CCAAGTGTTCATGCCACGTG | CGAGCGACTGCCACAAAAA |
| 45S Pre-rRNA (ITS) | CCGGCTTGCCCGATTT | GCCAGCAGGAACGAAACG |
| 45S v-rDNA I+II | CCAGCTGTGGTTGAGGGCCA | CGCTGGCAGAACGAGAAGAA |
| 45S v-rDNA III | CCGAGTACTTCTCCTGTCTG | GCCACCGGCCACATCCACCA |
| 45S v-rDNA IV | CCAGCTGTGGTTGAGGGCCG | AAGCTCCCCACGGGAAAGCC |
| 45S v-rDNA V | GTGACTTTGCGTGTCAGACT | ACACACCACCGGCAGACGGG |
| 45S v-rDNA VI | CTCTTGTTCTGTGTCTGTAT | ACACGTGAGGGCACAACCGG |
| 45S v-rDNA VII | CTCTTGTTCTGTGTCTGTAT | GATCCCTCCCCGAACTCGGG |
| UBF | CGCGCAGCATACAAAGAATACA | GTTTGGGCCTCGGAGCTT |
| TIF-1A | ATTTTGAGCGCATTGTGTTGAGC | GGGAGCATCTGGCGACTGTTC |
| TCOF1 | GCGAGTTGCTGGGGATAAAGC | CACGGCAGGCTCGGCT |
| TTF1 | AAACGGAAGCATGCCTTCAG | CACGGTAGTACACGAGCTTCCA |
| TAF-1A | GAAGTTCCCGTCGAACCCCA | TATGAGCTTCGCCCTCGGTG |
| TAF-1B | GCGCTTGCTGTTTGGGTAAC | CAGCACACTGAGAACAGCGG |
| TAF1C | CACCCTGCGCCCTTCA | GGTCAGGGCCATCAGTCATG |
| TAF-1D | CGTCCTTGTCCTAGTCCGGC | CCATCACTTTTCGCGGCCTT |
| TBP | GTTTCTGCGGTCGCGTCATT | AGGCCAAGCCCTGAGCATAA |
| Polr1a | CTGACTCGGAAGATGCTGGC | GGGTTTCCCAGGTAGTCCACG |
| Polr1b | TGGGAATCTGCGTTCTAAAACA | TTCAGCTTGTCAGCCACAACA |
| Polr1c | GGACCAGAACCGCTTCGAGA | GGAAAGCATTGGCGATGGCA |
| Polr1d | AGAGCTTCCATTTCGCCAGC | TTCCTCTCGCCTTCAGCCAT |
| Znrd1 | TCACACCAGACAGATGCGCT | AAAGCATGGTAGCCGGAGGG |
| PAF53 | TCAGAACAAGACTTTCAGGGACAA | CTGCTTGGTGCTTCCAAAGG |
| PAF49 | CTCGGTTCTCCTGCCCTCC | AGAAAGAGGTACACGCCGCC |
| Twistnb | CTGAGCCTGGGCAGACGTTA | CAGGCTTAGGGATAGAGGCGT |
| Polr2e | TTCAAGGCGCAGTTTGGGGA | CGCCCGTGTGATGTTTTCCT |
| Polr2f | TCGACGGCGACGACTTTGAT | GGCCCGCTCATACTTGGTCA |
| Polr2h | TCTGCAGCTTTCGTGCCCTT | CTCACAGTGCAGCCGGGATA |
| Polr2l | ATCGTCGGCAACAAATGGGA | GCTCCAGCGGTCACTTCTCTA |
| Polr2k | GGAGAGGTAGCACACTCCTGC | CTGCTGCTTTGGTGGTTGAACA |
| NUFIP1 | ACGTCTTACCAATCTCCGGTTACA | AGCCACGATCACAGGTATCACA |
| ZNHIT3 | CCGAAATACCGTTGCCCGAC | AGCTGCACTGCTCTTTGTGC |
| GAPDH | ACTGAGCAAGAGAGGCCCTA | TATGGGGGTCTGGGATGGAA |
Western blotting
Total protein was extracted from muscle tissue and myotubes lysed in ice-cold RIPA lysis buffer (50 mM Tris·HCl pH 8, 150 mM NaCl, 1% nonidet P-40 (NP-40), 0.5% sodium deoxycholate, 0.1% sodium dodecyl sulphate (SDS), 1 mM sodium fluoride, and 1 mM sodium orthovanadate) supplemented with one of each Pierce protease and phosphatase inhibitors (Thermo Scientific, Rockford, IL). Tissue homogenization was performed using a 7-mm generator probe coupled to an OMNI TH Tissue Homogenizer (OMNI International, Kennesaw, GA, USA). Homogenates were centrifuged for 20 min at 4°C, and supernatants were transferred to new tubes. Protein concentration was determined using the DC protein assay (Biorad, Hercules, CA), and the lysate was diluted with lysis buffer before mixing 1:1 with 2× Laemmli buffer containing 5% β-mercaptoethanol. Samples were boiled at 95°C for 10 min and stored at −20°C until further use. Western blotting was performed using standard techniques. Samples containing equal amounts of protein (10 – 20 μg) were separated by SDS-PAGE on 4–12% polyacrylamide Criterion gradient gels and transferred to PVDF membranes activated in 100% methanol. After transfer, membranes were washed in Tris-buffered saline with 0.1% Tween (TBS-T) and blocked in a protein containing buffer (TBS-T + 5% milk). Primary and secondary antibodies were diluted in either 5% nonfat dry milk or 5% BSA according to manufacturer’s recommendations. The following primary antibodies were utilized in this study: Puromycin (MABE343) and LC-3 (L8918, Millipore-Sigma, St. Louis, MO), 4E-BP1 (#9644S, Cell Signaling, Danvers, MA), NUFIP1 (12515–1-AP, Proteintech, Rosemont, IL), and GAPDH (sc-25778, Santa Cruz Biotechnology, Santa Cruz, CA).
Statistical analysis
Values are reported as means ± SD. The significance of differences was determined by either unpaired t-test or two-way ANOVA followed by Tukey’s post-hoc test. The level of significance was set at P < 0.05. All data was analyzed using GraphPad Prism 8 (Graph Pad software Inc., La Jolla, CA, USA).
Results
Muscle protein synthesis, ribosomal capacity, and rDNA transcription are reduced in ovarian cancer-induced muscle wasting
Growth of ovarian cancer xenografts caused a significant loss in muscle mass (28.3%, P < 0.0001) (Fig. 1A), and a significant reduction in rRNA content (~50%, P = 0.0003) (Fig. 1B). There was also a significant depression in rDNA transcription as reflected by the reduction in both External Transcribed Spacer (ETS 35%, P = 0.0086) and Internal Transcribed Spacer (ITS, 20%, P = 0.0407) signals (Fig. 1C&D). The lower capacity for protein synthesis was reflected by a significant reduction in Puromycin incorporation (91.6%, P = 0.0001) into nascent peptides by tumor bearing mice (Fig. 1E). We also detected a significant reduction (66.9%, P = 0.0006) in the ratio of γ4E-BP1 to total 4E-BP1, with predominantly hypophosphorylated 4E-BP1 (α and β forms) in tumor bearing mice (Fig. 1F). Reduced rDNA was selectively driven by the lower expression of v-rDNA III (30%, P = 0.02) and IV (35%, P = 0.01) without changes in v-rDNA I, II, and VI (Fig. 2A). Selective regulation of v-rDNA was confirmed by examining rDNA transcription from 3-day overloaded muscle42 where mechanical loading increased the expression of v-rDNA I-II (>1.5-fold, P = 0.03) and IV (>2-fold, P = 0.0003) while not affecting v-rDNA III and VI (Fig. 2B).
Fig. 1. ES-2 tumor induces muscle loss and impairs ribosome biogenesis resulting in a reduced translational capacity.
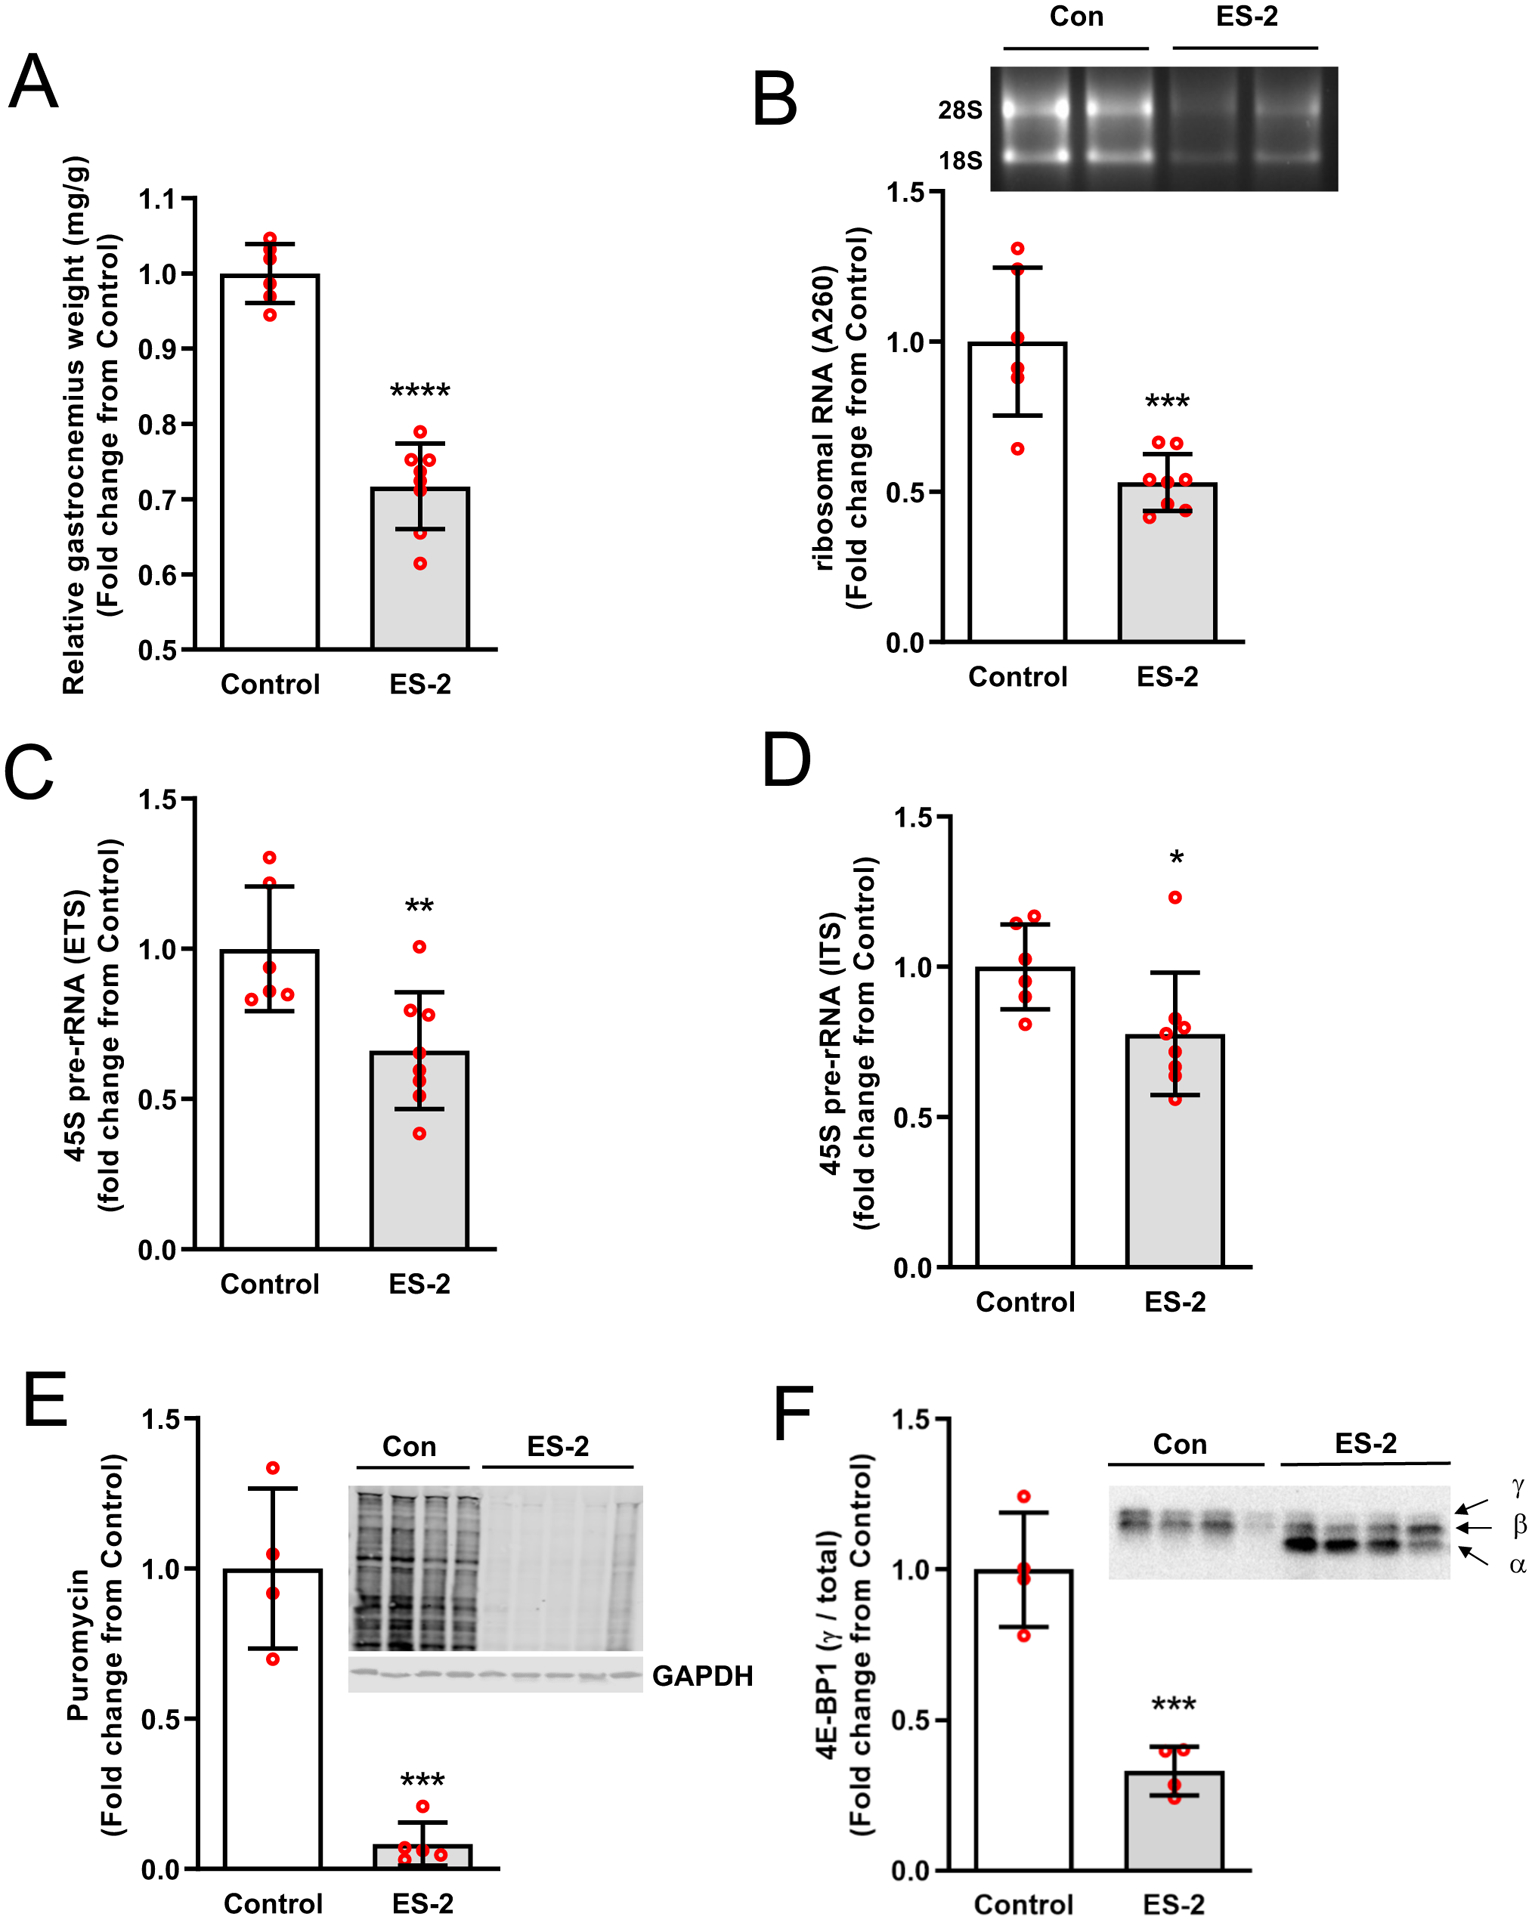
ES-2 tumor induced a significant loss of muscle mass (A) and rRNA (B). rDNA transcription in skeletal muscle of ES-2 tumor mice was significantly lower than control (C-D). The capacity for protein synthesis was compromised in tumor bearing mice, as reflected in lower puromycin incorporation into nascent peptides (E) and was consistent with translational repression as evidenced by a reduction in γ4E-BP1 relative to total 4E-BP1(F). Values are mean ± SD. *P < 0.05, ** P < 0.01, *** P < 0.001, **** P < 0.0001 vs. control.
Fig. 2. ES-2 tumor induces a selective reduction in v-rDNA transcription.
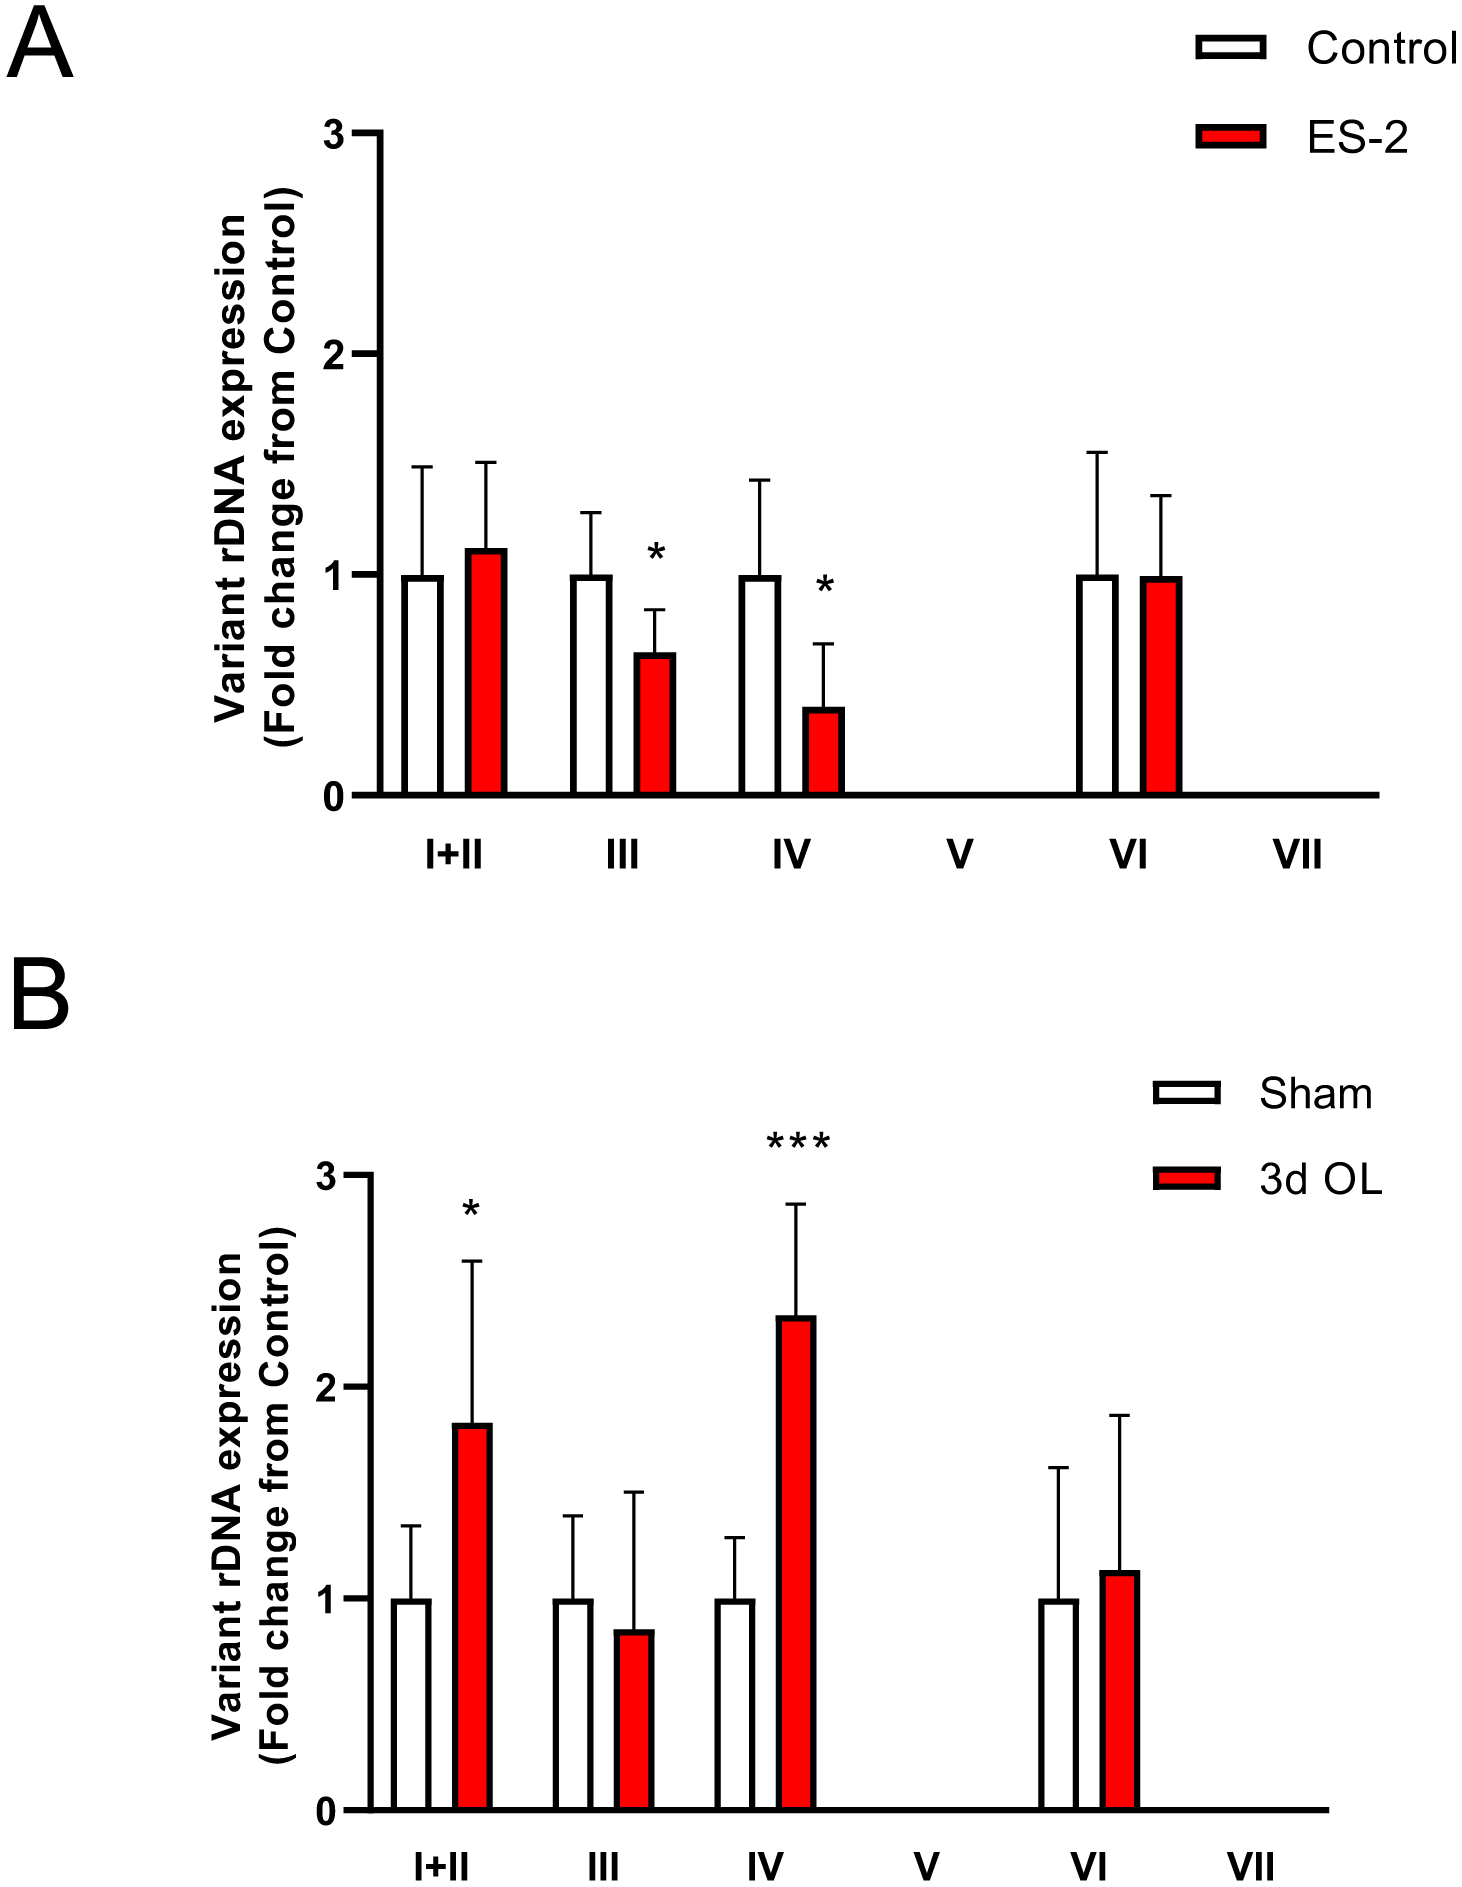
ES-2 tumor implantation repressed transcription of v-rDNA III and IV without affecting the expression of v-rDNA I, II, and VI (A). Selective v-rDNA downregulation was confirmed by comparing v-rDNA expression from 3-day overloaded muscle where mechanical loading increased expression of v-rDNA I, II, and IV with no change in v-rDNA III and VI. v-rDNA V and VII are not expressed in skeletal muscle. Values are mean ± SD. * P < 0.05, ** P < 0.01, *** P < 0.001, **** P < 0.0001 vs. control.
Expression of Pol I factors is elevated in wasting cachexia
In contrast with the reduction in rDNA transcription, the expression of Pol I accessory factors was upregulated in wasting muscle. The mRNA levels of UBF (~0.5-fold, P = 0.0368), TIF-1A (1.5-fold, P = 0.0265), TCOF (1.7-fold, P = 0.0004), and TTF1 (1.4-fold, P = 0.0071) was higher in tumor bearing than control mice. Expression of the SL1 complex except for TBP (0.4-fold, P = 0.0176), was also elevated. TAF-1A (1.3-fold, P = 0.0001), TAF-1B (1.7-fold, P = 0.0004), TAF-1C (1.5-fold, P = 0.0283), TAF-1D (3-fold, P = 0.0006) displayed a similar expression pattern (Fig. 3).
Fig. 3. Expression of Pol I associated factors is upregulated in ES-2 tumor.
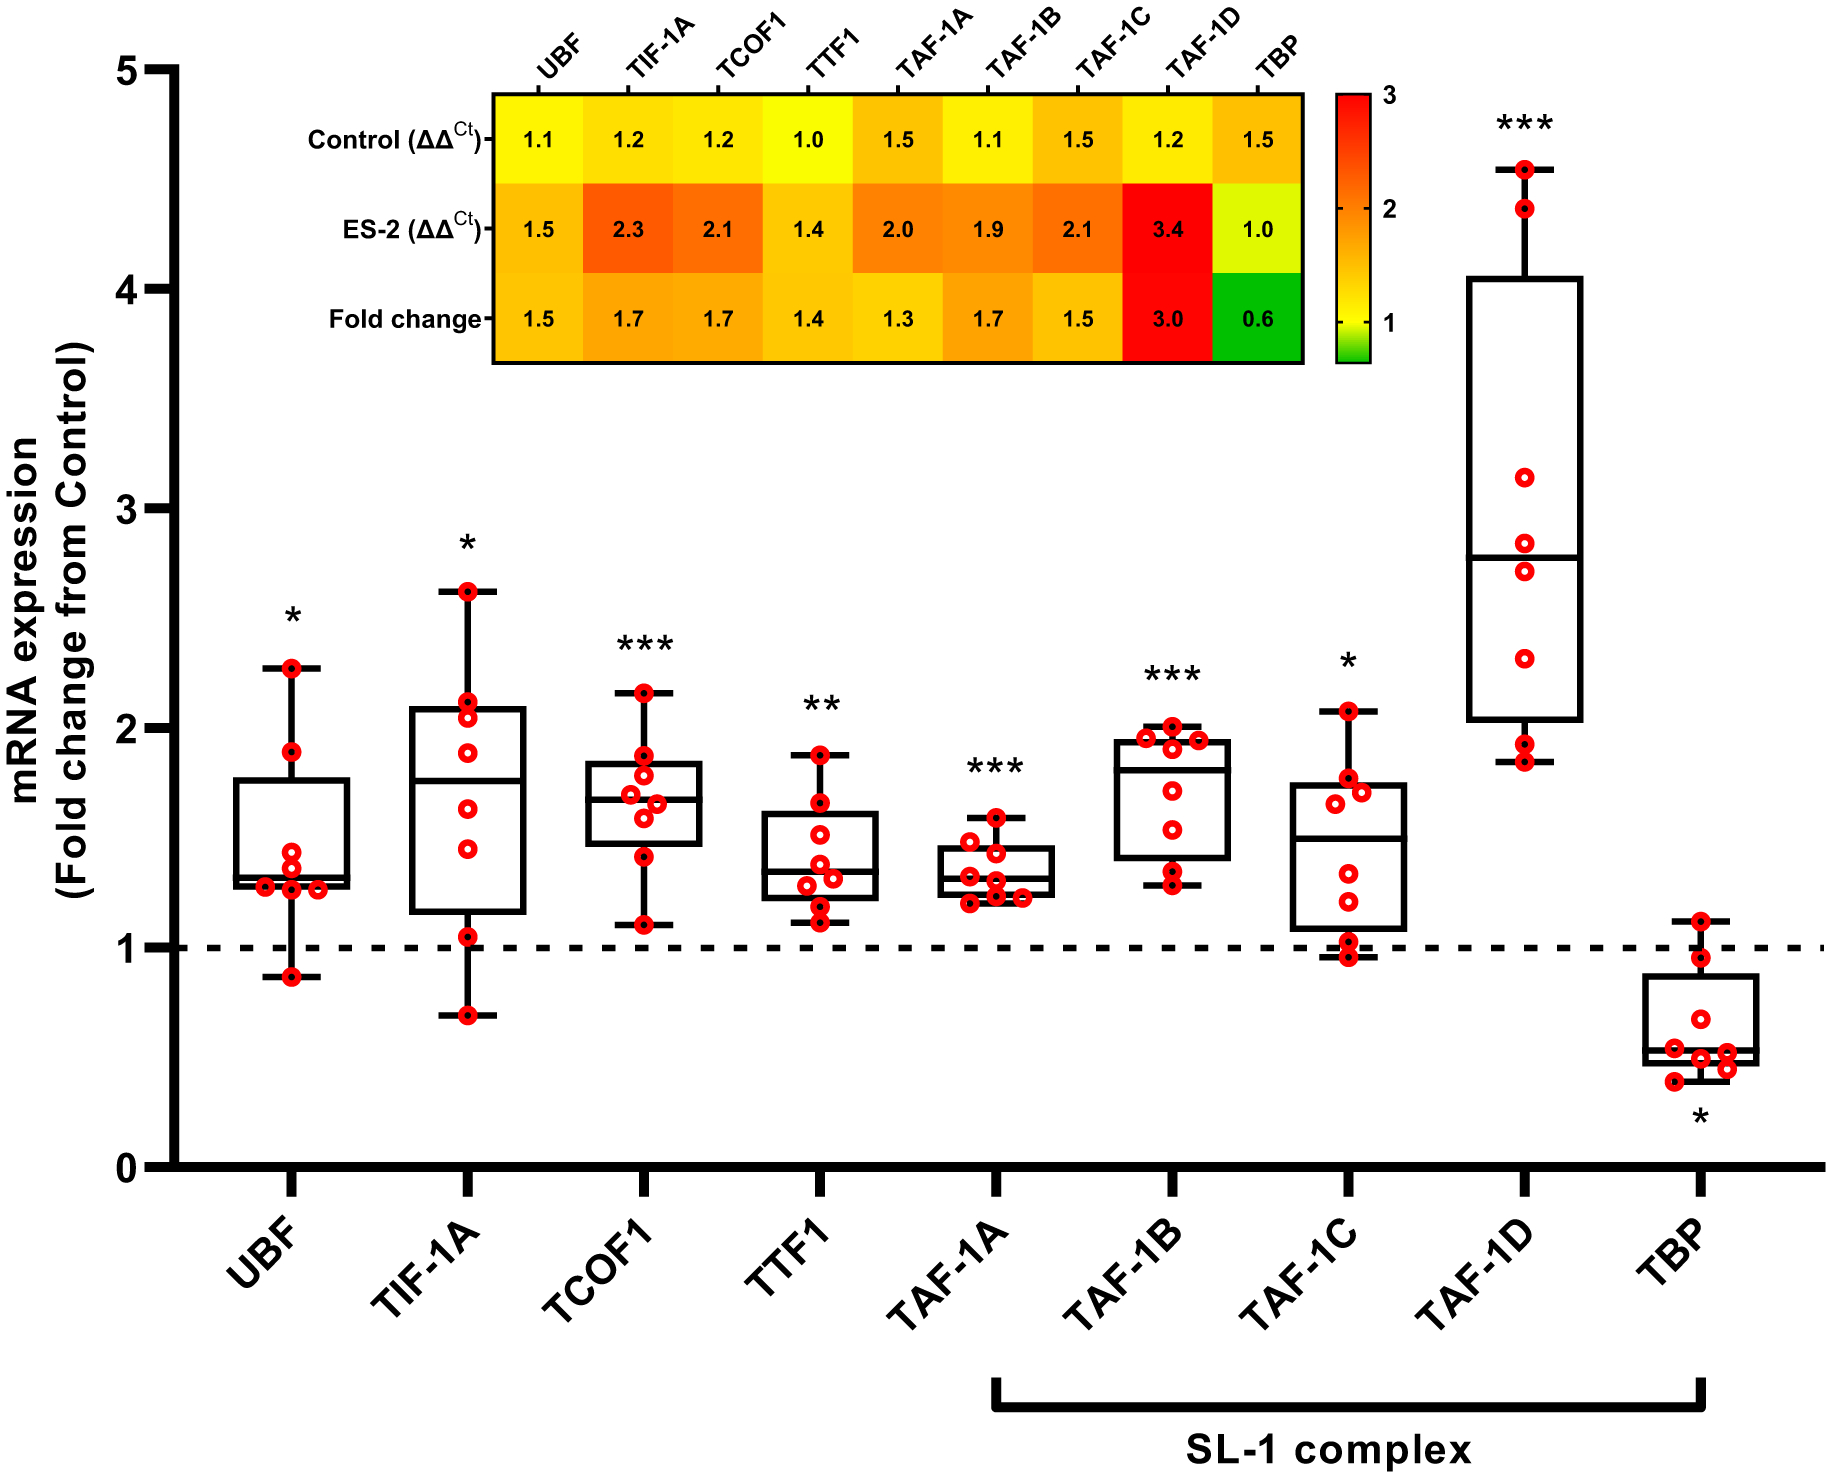
Except for TBP, expression of Pol I associated factors UBF, TIF-1A, TCOF1, TTF1, and SL1 (TAF-1A, TAF-1B, TAF-1C, and TAF-1D) was elevated in tumor bearing mice. Insert: Heatmap illustrating the relative expression of Pol I associated factors. UBF: Upstream binding factor, Transcription Initiation Factor-IA (TIF-1A/Rrn3), TCOF1: Treacle Ribosome Biogenesis Factor 1, TTF1: Transcription Termination Factor 1, TAFs: TATA-Box Binding Protein Associated Factor, TBP: TATA-Box Binding Protein. Values are mean ± SD. * P < 0.05, ** P < 0.01, *** P < 0.001, **** P < 0.0001 vs. control.
Downregulation of rDNA transcription results in discordant expression of Pol I subunits
Pol I subunits were discordantly expressed in wasting muscle (Fig. 4). The mRNA levels of the core subunits, Polr1a (1.8-fold, P = 0.0042), Polr1b (4.2-fold, P < 0.0001), Polr1c (1.7-fold, P = 0.0022), and Polr1d (1.6-fold, P = 0.0002) showed significantly higher expression in tumor bearing mice compared to control mice, except for Znrd1 (0.7-fold, P = 0.0408). PAF53 (2.1-fold, P < 0.0001), PAF49 (3.1-fold, P < 0.0001), and Twistnb (1.7-fold, P < 0.0001), which form heterodimeric subcomplexes in Pol I were also upregulated in tumor bearing mice. Components of the common subunit Polr2e (1.7-fold, P = 0.0006) and Polr2k (1.2-fold, P = 0.0356) were elevated, while Polr2f (0.5-fold, P = 0.0009), Polr2h (0.7-fold, P = 0.0166), and Polr2l (0.7-fold, P = 0.0194) were lower in tumor bearing mice relative to control.
Fig. 4. ES-2 tumor stimulates the discrepant expression of Pol I subunits.
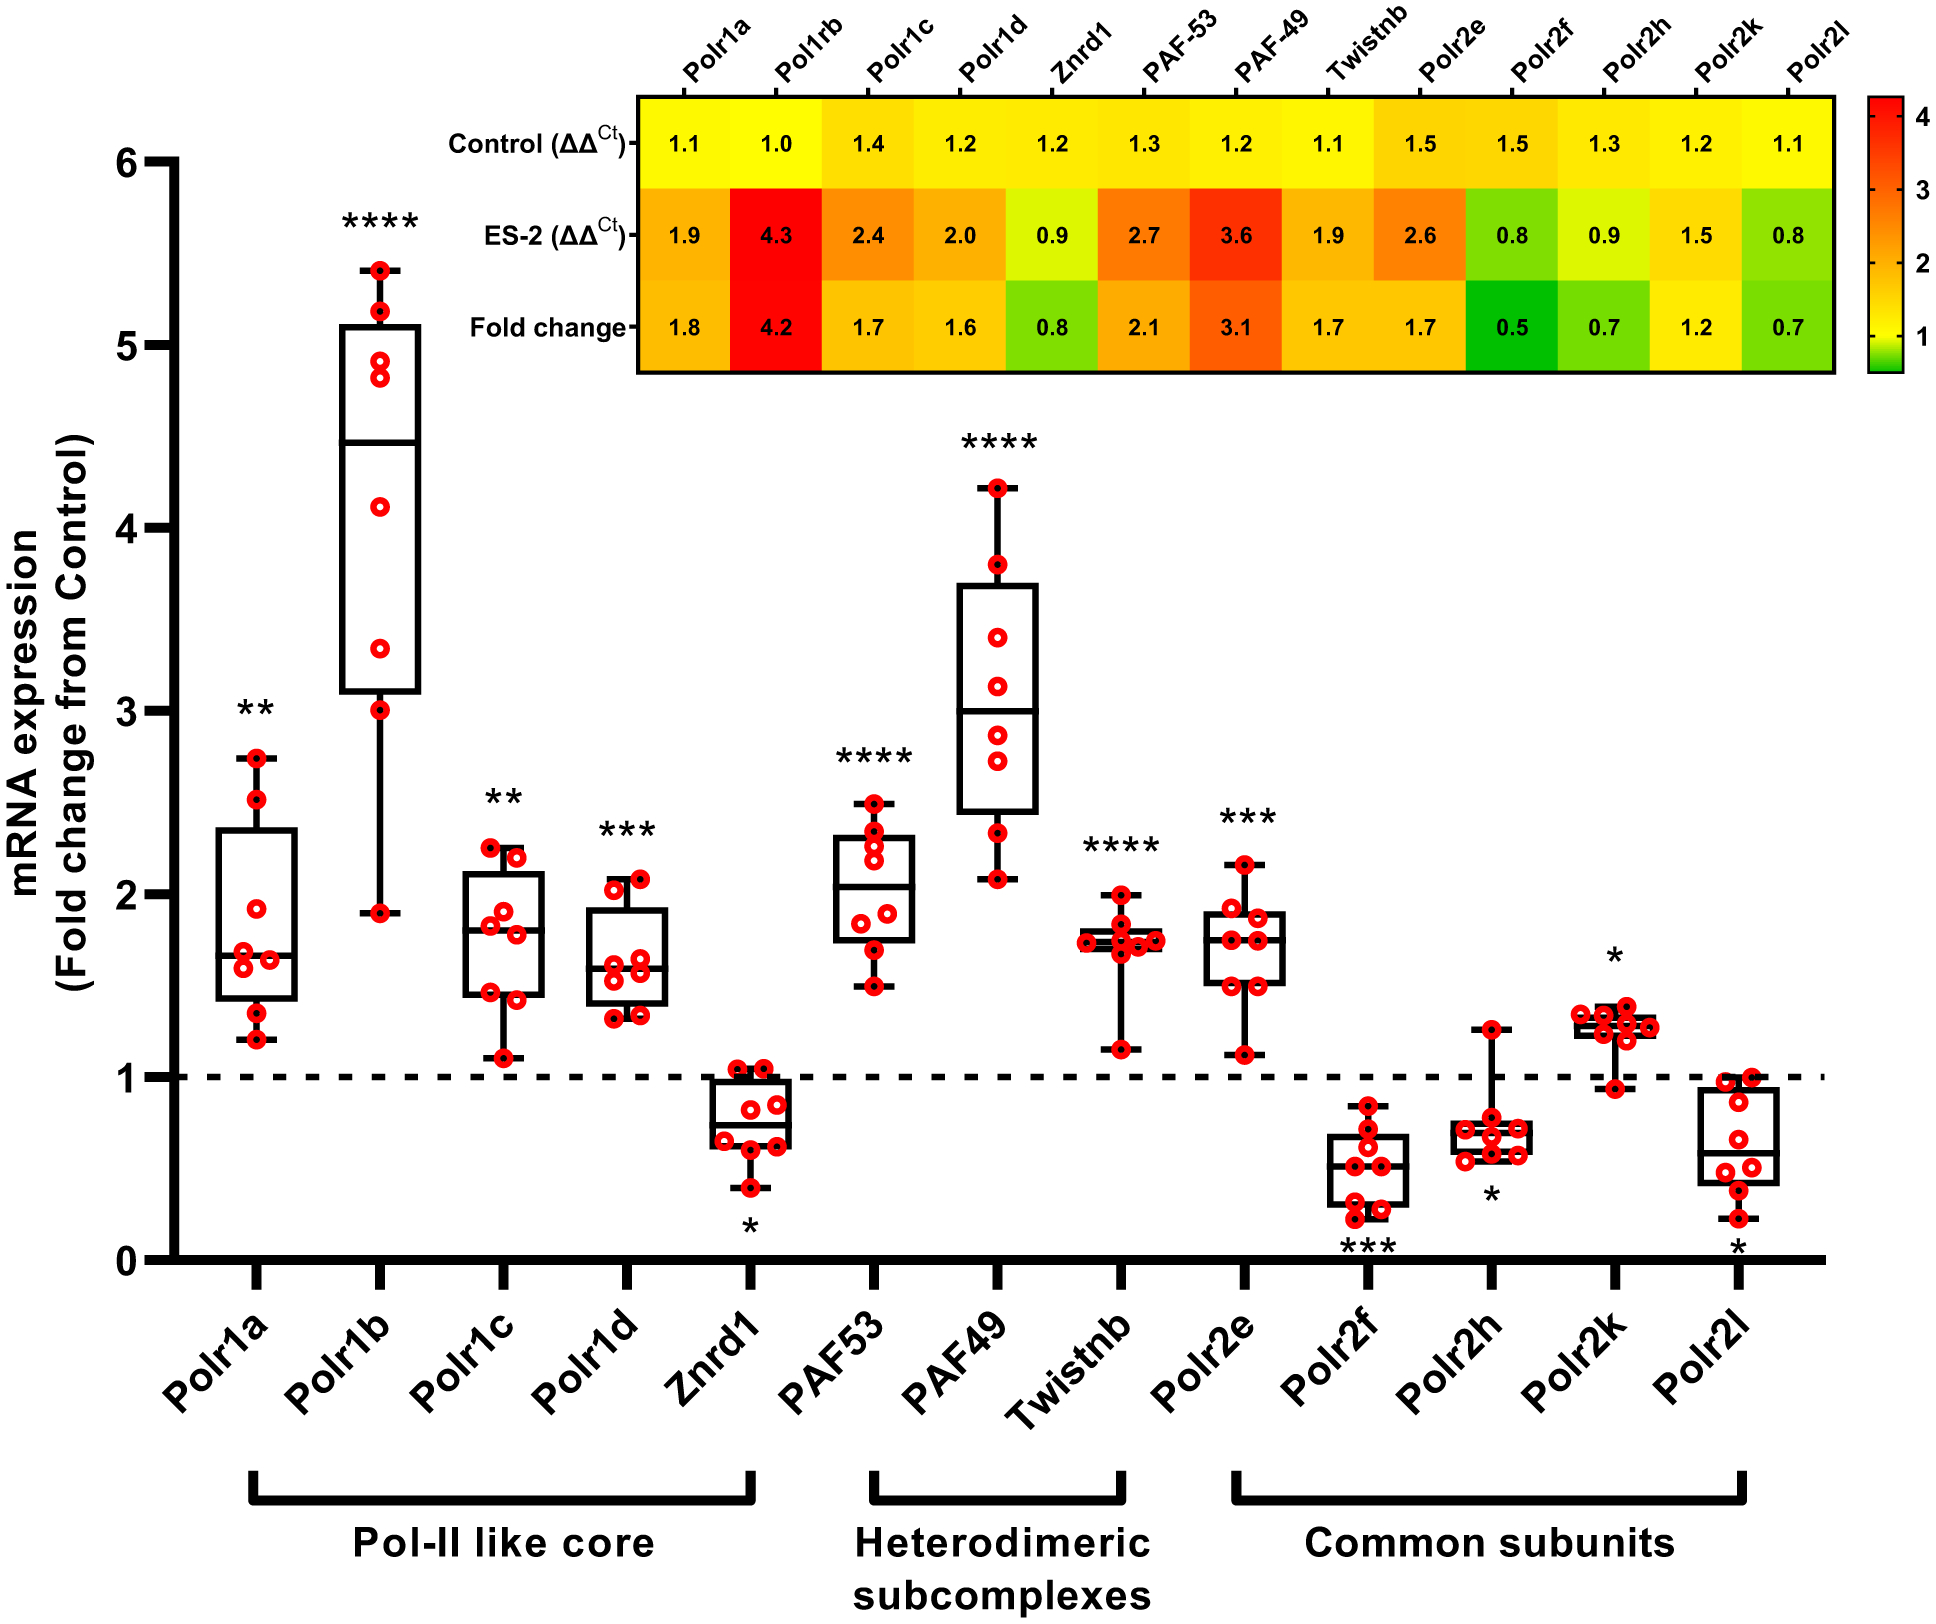
Expression of the Pol I-subunits Polr1a, Polr1b, Polr1c, Polr1d, PAF53, PAF49, Twistnb, Polr2e, and Polr2k was significantly elevated, whereas Znrd1, Polr2f, Polr2h, Polr2l was downregulated with ES-2 tumor. Insert: Heatmap illustrating the relative expression of Pol I subunits. Polr1a: RNA Polymerase I Subunit A, Polr1b: RNA Polymerase I Subunit B, Polr1c: RNA Polymerase I Subunit C, Polr1d: RNA Polymerase I Subunit D, Znrd1: Zinc Ribbon Domain Containing 1, PAF53 (Polr1e): RNA polymerase I associated factor 53, PAF49: RNA polymerase I associated factor 49, Twistnb (Polr1f): TWIST Neighbor, Polr2e-f: RNA polymerase II subunit E-F. Values are mean ± SD. * P < 0.05, ** P < 0.01, *** P < 0.001, **** P < 0.0001 vs. control.
Despite elevations in NUFIP1 in ES-2 tumor-induced muscle cachexia, rRNA loss is not prevented by inhibition of autophagy.
Expression of the ribophagy receptor NUFIP1 and its associated factor Zinc Finger HIT-Type Containing 3 (ZNHIT3) was investigated to determine the potential involvement of ribophagy in the reduction of rRNA. In tumor bearing mice, NUFIP1 mRNA was elevated (>4-fold, P < 0.0001) (Fig. 5A) and NUFIP1 protein was reduced (48.5%, P = 0.0012), whereas ZNHIT3 mRNA levels were similar to control mice (Fig. 5C). The reduction in NUFIP1 protein was consistent with a significant increase (11.5-fold, P < 0.0001) in LC3II/LC3I (Fig. 5D). Treatment of myotubes with ES-2 conditioned media also resulted in a significant reduction in rRNA by 48 hrs (15.8%, P = 0.0492) and 72 hrs (42.8%, P = 0.0002) (Fig. 6A) with lower 45S pre-rRNA levels by 48 hrs. (31.9%, P = 0.0125) and 72 hrs. (30.6%, P = 0.0224) (Fig. 6B). Using an independent in vitro model of ribophagy, we observed a progressive reduction in rRNA by 1 hr. (24.2%, P = 0.06) that remained stable up to 6 hrs. (24.4%, P = 0.0003) (Fig 6C). This was associated with reductions in 45S pre-rRNA levels by 1 hr. (~60%, P = 0.0036) and 6 hrs. (~45%, P = 0.005) (Fig. 6D). NUFIP1 protein showed a significant reduction by 1hr (75%, P = 0.0069) and 6 hrs. (85%, P <0.001) (Fig. 6E) with increased autophagic flux (LC3-II/I) by 1 hr. (1.6-fold, P = 0.0415) (Fig. 6F). In the presence of CLQ, loss of NUFIP1 in myotubes was rescued by 73.3% when compared to PBS alone (P = 0.01) (Fig. 7A) and resulted in a significantly higher LC3-II/I ratio (Fig. 7B). However, despite rescuing NUFIP1, loss of rRNA (PBS, −30.8%, P < 0.0001) was not prevented by either CLQ (−31.4%, P =0.0009) or MG-132 (−31.9%, P < 0.0001), or a combination of both CLQ+MG-132 (−28%, P = 0.0003) (Fig. 7C). Finally, the electrophoretic analysis showed no evidence of rRNA fragmentation during ribosomal loss in either in vivo or in vitro systems, and this was confirmed by comparing RIN values and 28/18S ratios (Fig. 8). RIN values of tumor bearing mice were marginally lower (7.4 ± 0.2 vs. 7.6 ± 0.15, P = 0.0167) than control mice, however, this difference may be negligible since the difference in the mean value between groups was within the coefficient of variation of the measurement.47,48
Fig. 5. ES-2 Tumor stimulates the expression of NUFIP1 mRNA and degradation of NUFIP1 protein.
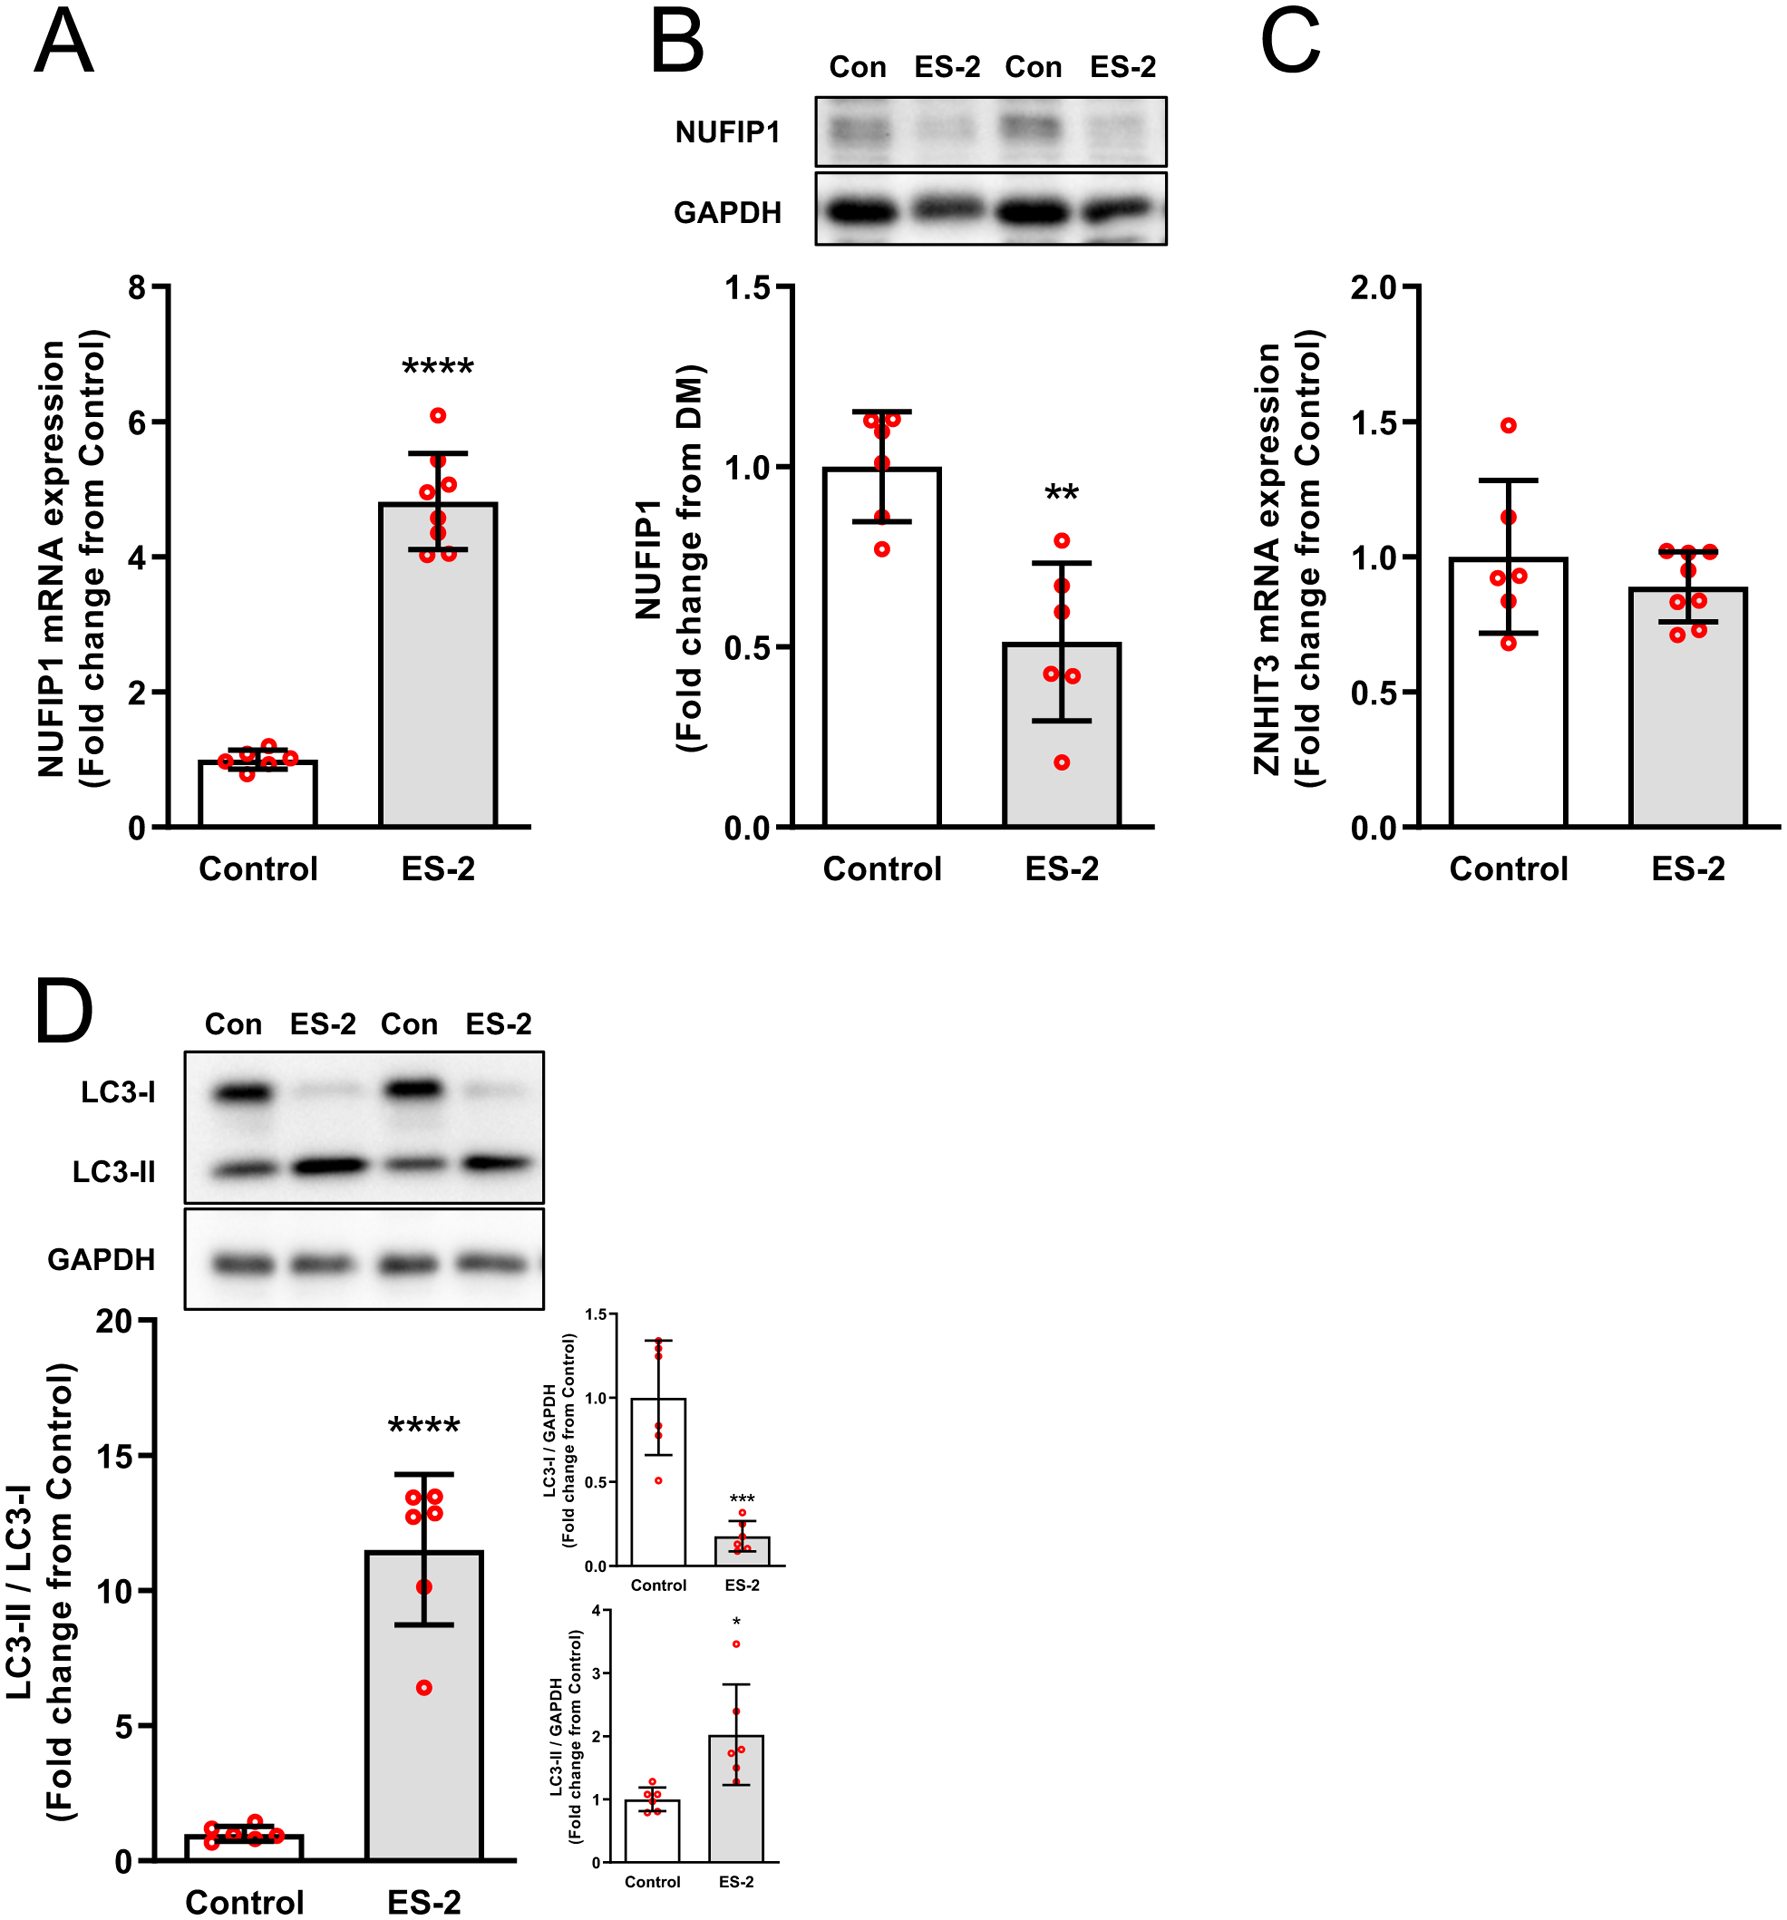
Upregulation of NUFIP1 mRNA expression (A) and degradation of NUFIP1 protein (B) was observed in tumor bearing mice. NUFIP1 associated factor ZNHIT3 mRNA expression (C) showed no change. Autophagic flux, monitored via changes in LC3-II/I ratio, was higher in ES-2 tumor bearing mice and was driven by a significant reduction in LC3-I (D). Values are mean ± SD. * P < 0.05, ** P < 0.01, *** P < 0.001, **** P < 0.0001 vs. control.
Fig. 6. NUFIP1 protein, rRNA, and rDNA transcription are reduced in nutrient deprived myotubes.
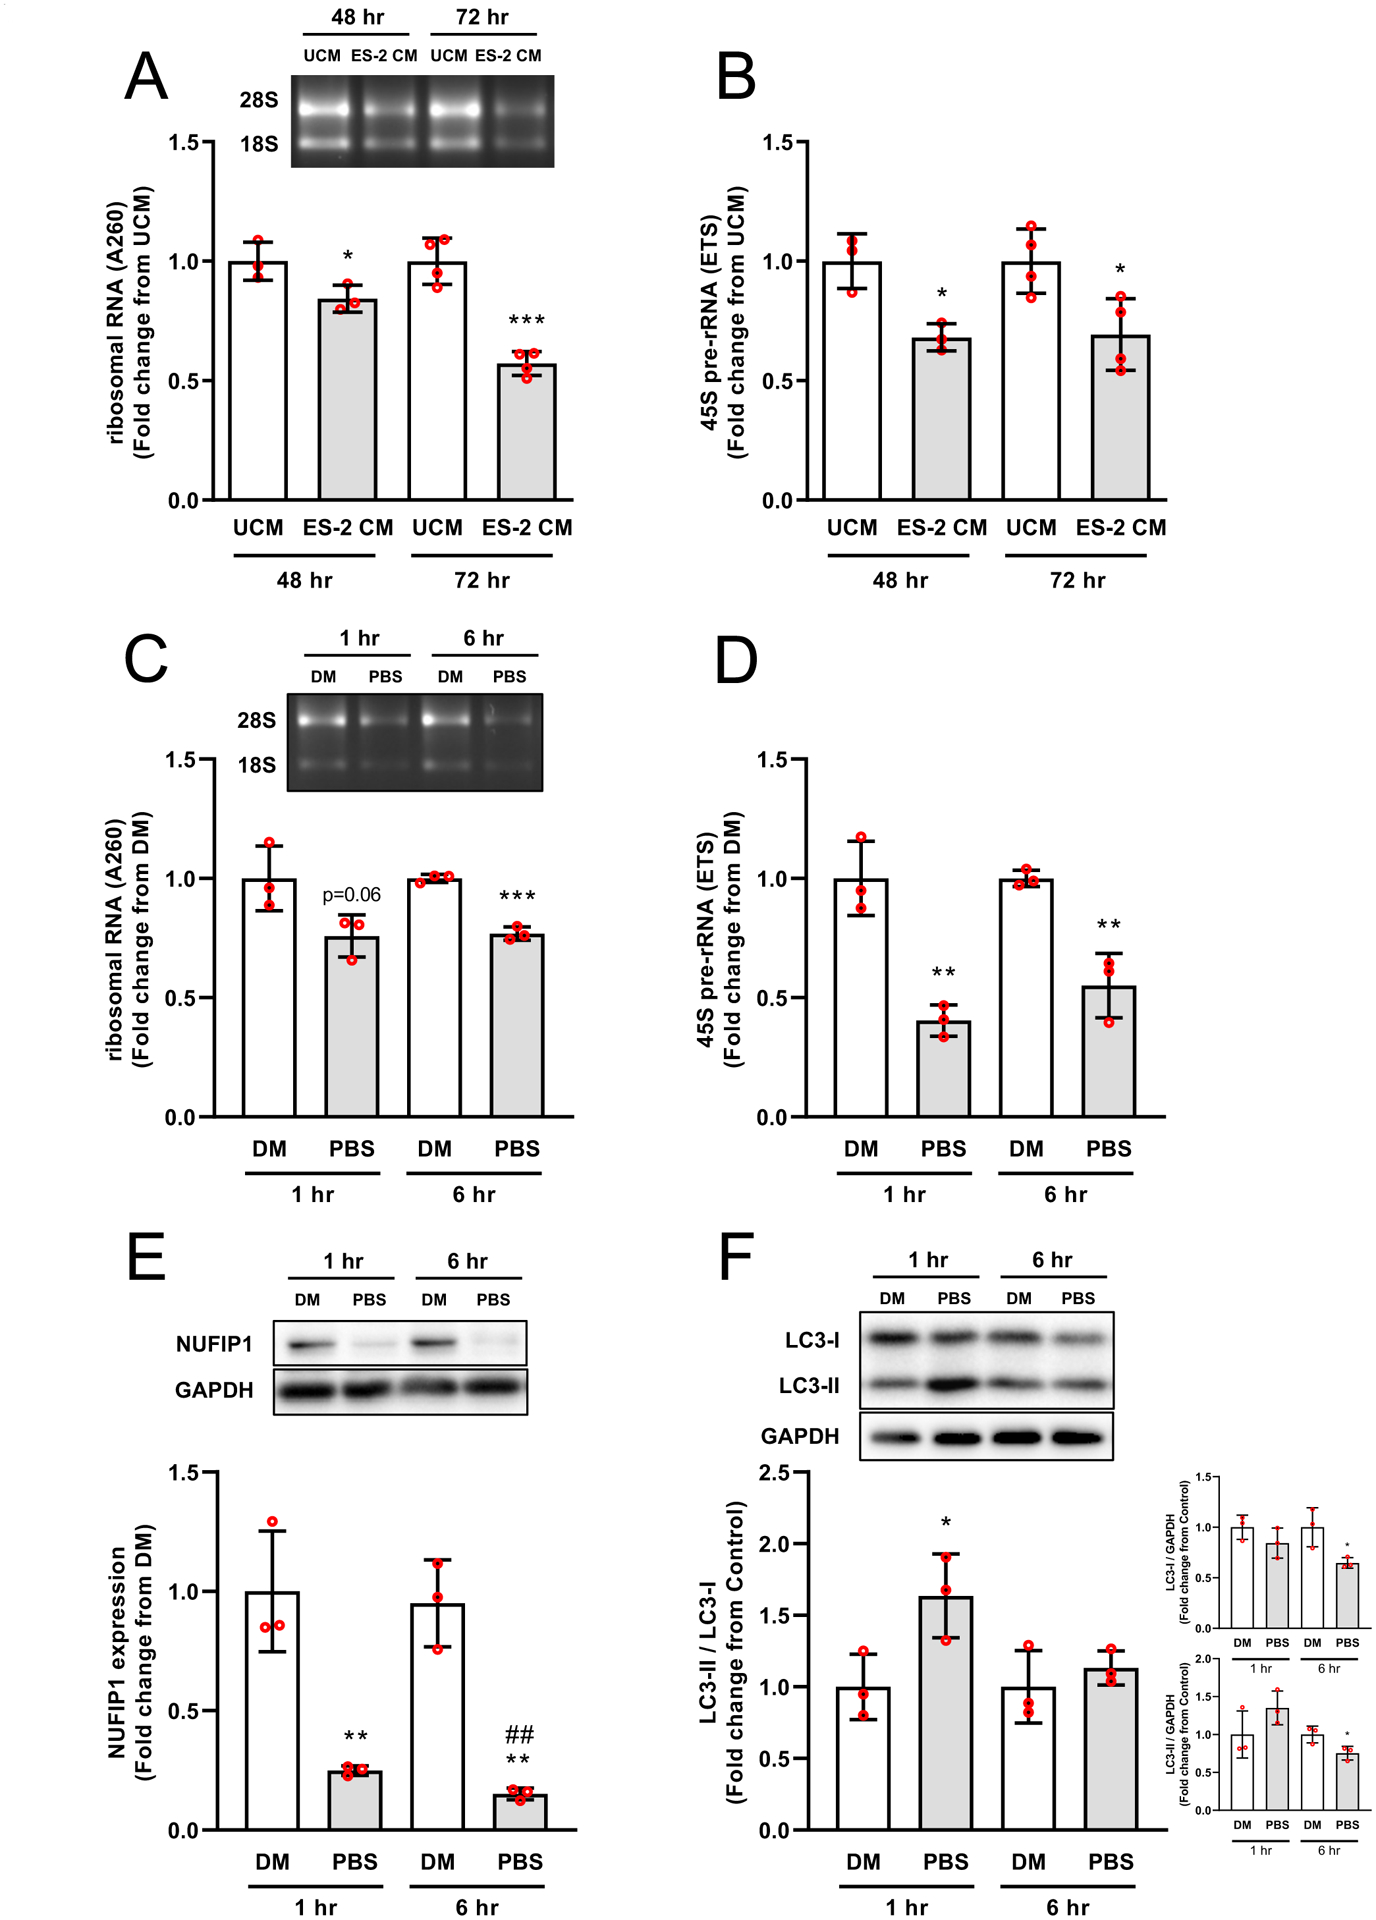
Myotubes exposed for 48 and 72 hrs to 50% ES‐2 unconditioned medium (UCM) or conditioned medium (CM) showed a progressive reduction in rRNA and rDNA transcription (A&B). Nutrient deprivation induced a significant reduction in rRNA within 6 hrs. (C). This reduction in rRNA content was associated with suppressed rDNA transcription, which preceded the reduction in rRNA (~1 hr.) (D). Degradation of NUFIP1 protein was observed within 1 hr. and remained stable by 6 hrs. of nutrient deprivation (E). Autophagic flux was rapidly induced (1 hr.) but equilibrated by 6 hrs. (F). Values are mean ± SD. * P < 0.05, ** P < 0.01, *** P < 0.001, **** P < 0.0001 vs. DM, # P < 0.05, ## P < 0.01 vs. PBS 1 hr.
Fig. 7. Degradation of NUFIP1 but not rRNA is rescued by interrupting autophagic flux.
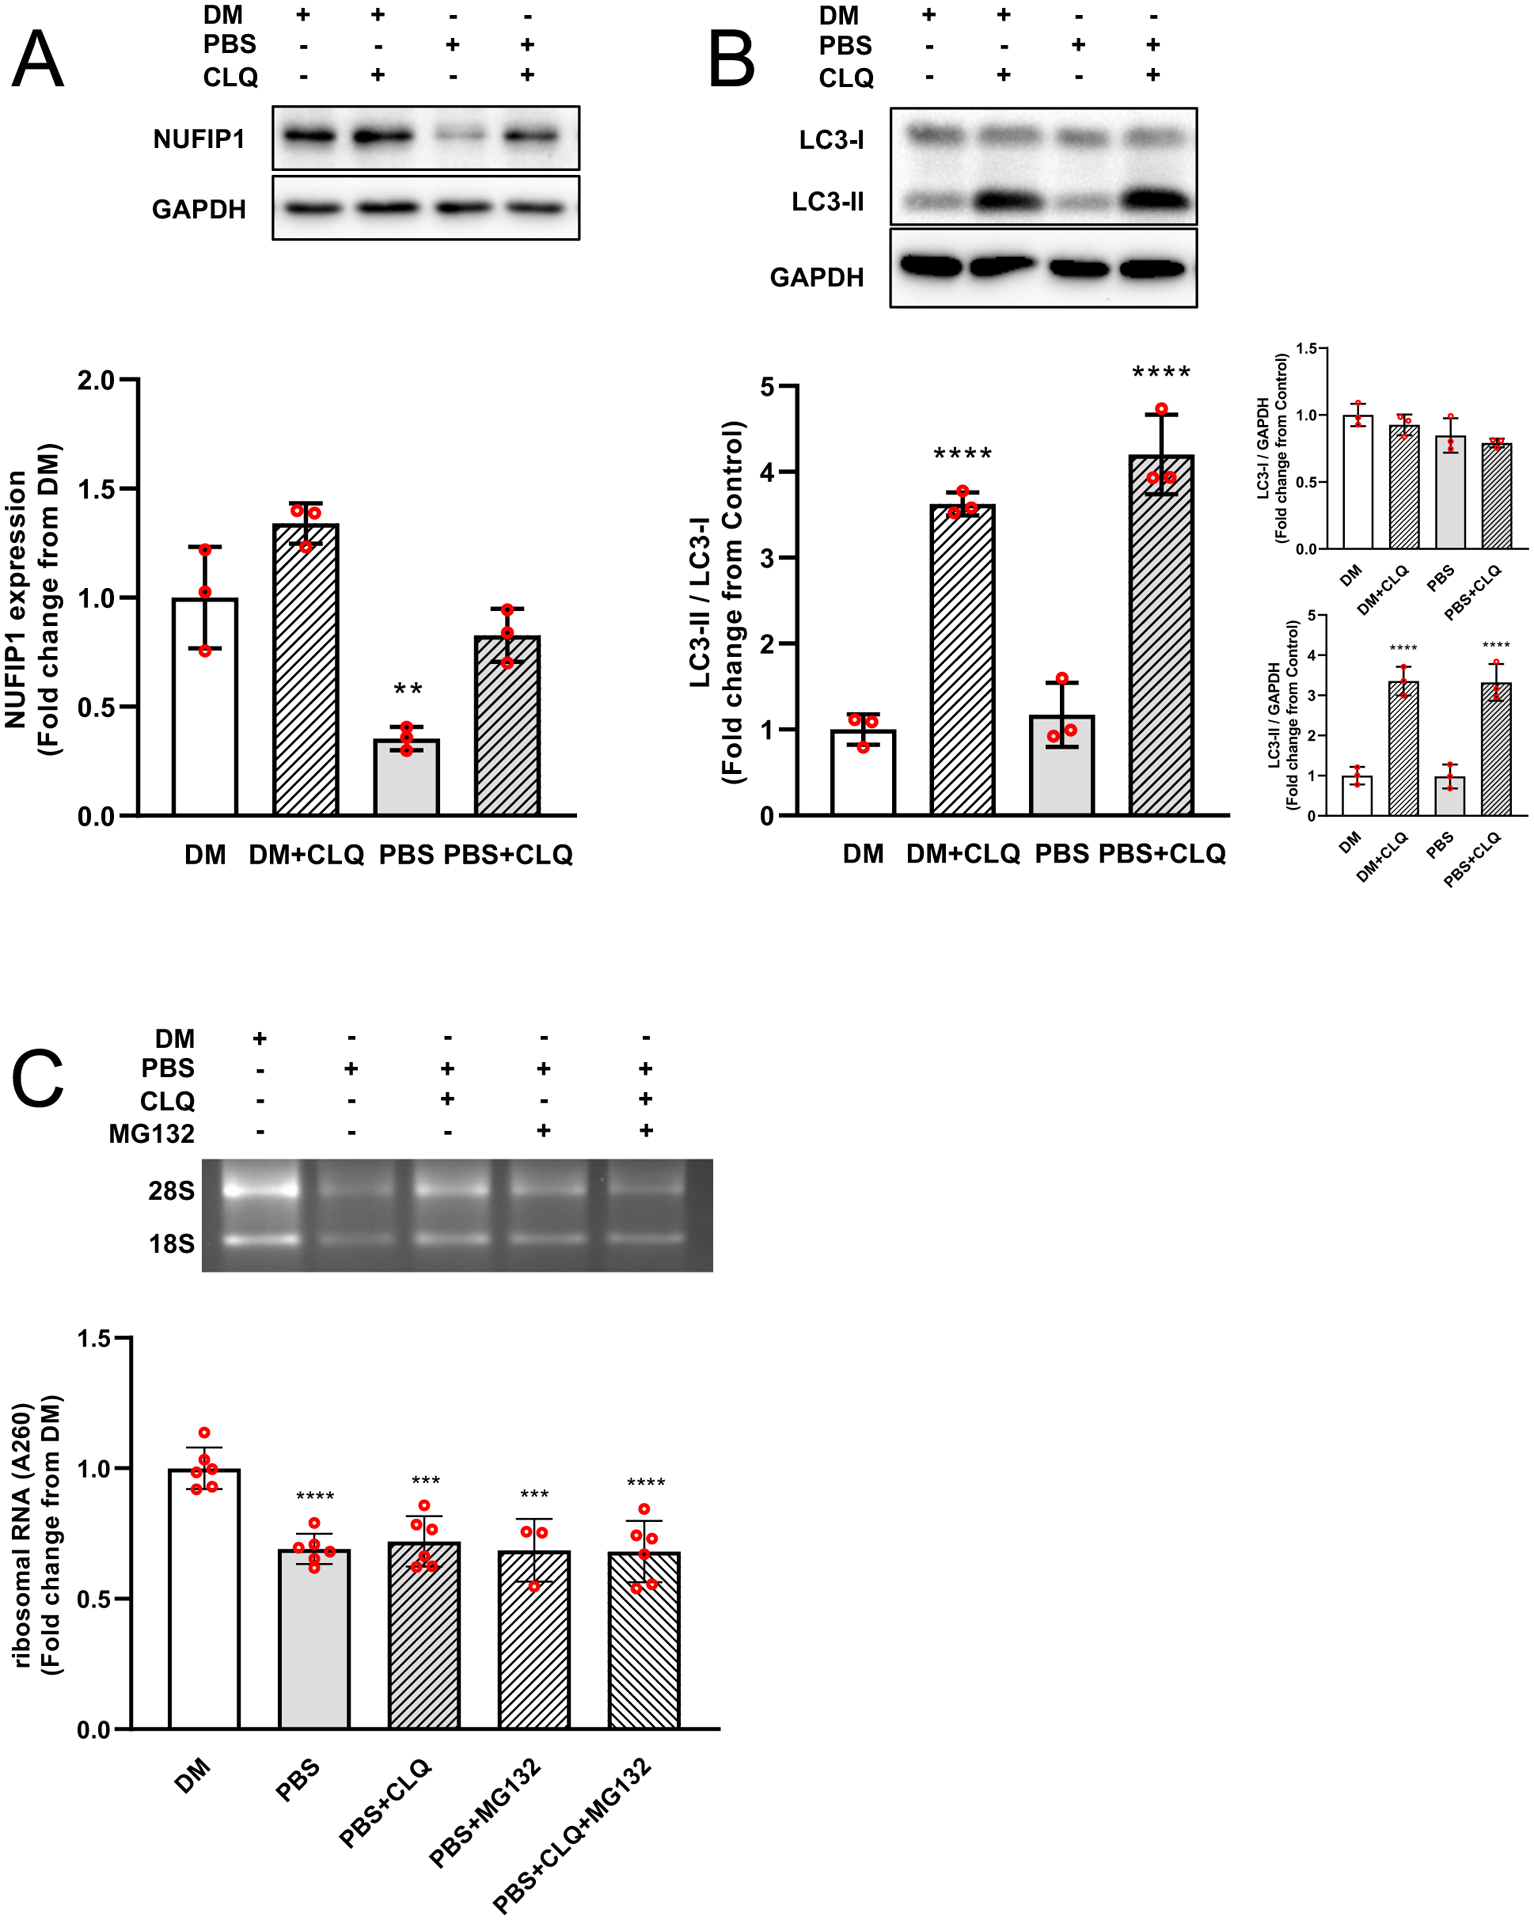
Short-term nutrient deprivation in the presence of CLQ rescued degradation of NUFIP1 protein (A) and inhibited autophagic flux (B). However, loss of rRNA was not prevented despite the inhibition of NUFIP1 degradation and autophagic flux, neither was prevented by blocking proteasome activity with MG-132 (Fig C). Values are mean ± SD. * P < 0.05, ** P < 0.01, *** P < 0.001, **** P < 0.0001 vs. DM.
Fig. 8. Reduction in rRNA content is not associated with rRNA fragmentation.
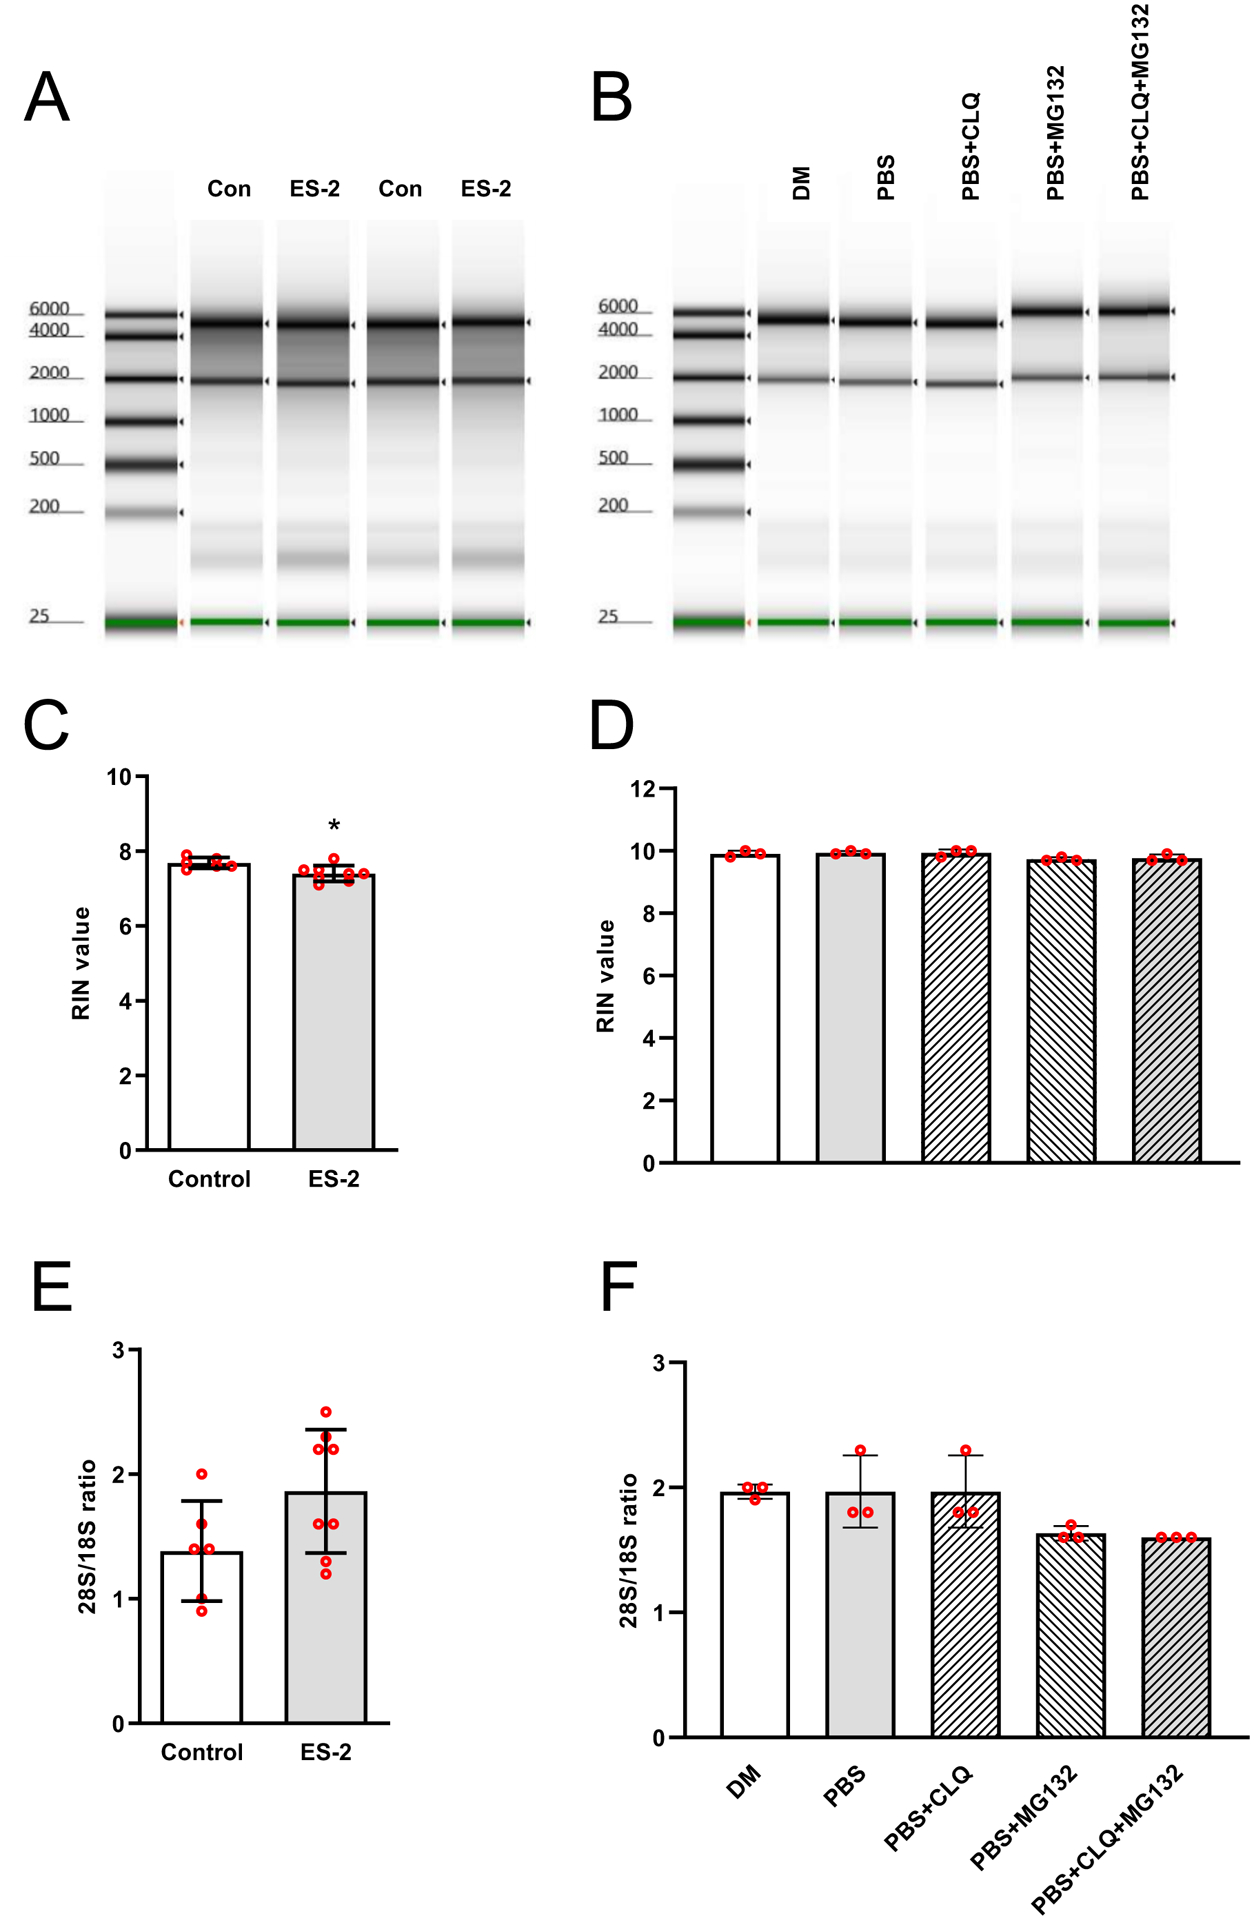
rRNA quality was analyzed by capillary electrophoresis. Electropherogram depicting absence of rRNA fragmentation either in vivo (A) or in vitro (B). RNA integrity number (RIN) values for in vivo (C) or in vitro rRNA (D) and respective 28S/18S ratios (E & F). Values are mean ± SD. * P < 0.05, ** P < 0.01, *** P < 0.001, **** P < 0.0001 vs. control.
Discussion
In the present study, we sought to determine whether impaired rDNA transcription represents an underlying cause for the reduction in ribosomal capacity commonly observed skeletal muscle undergoing wasting. Using ES-2 tumor implantation as a pre-clinical model of ovarian cancer with muscle depletion,41 we found a significant reduction in ribosomal and protein synthesis capacity. This is consistent with previous observations from other pre-clinical models of cancer with muscle wasting. For example, mice bearing the XK1 tumor experienced a 70% reduction in muscle protein synthesis together with a reduction in both rRNA content (i.e., protein-synthesizing capacity) and rRNA activity (i.e., protein synthesized per g of RNA per hr).20 Similarly, rats implanted with Yoshida ascites hepatoma undergo a 20–38% reduction in rRNA content in association with 9–14% loss of muscle mass.49 While our data together with these previous studies implicate the loss of rRNA as the driver of reduced anabolism in muscle wasting, the mechanism(s) leading to the ribosomal deficit have not been defined. In order to identify the potential cause of muscle anabolic deficits in cancer, we focused on the regulation of rDNA transcription by RNA Pol I. Impaired rDNA transcription lead to a substantial reduction in rRNA levels. This is consistent with previous data showing defective Pol I transcriptional activity in muscle extracts of rats bearing the Walker 256 carcinoma.50 While we did not quantify Pol I activity directly, the steady-state level of the 45S pre-rRNA transcript served as an accurate readout of Pol I activity and rDNA transcription rates.51 Thus, the reduction in rDNA transcription appears to be a likely mechanism leading to lower rRNA levels and reduced protein synthesis capacity in cancer cachexia.
To determine whether the reduction in rDNA transcription was due to overall or selective transcriptional repression, we investigated changes in v-rDNA expression and found that while v-rDNA III and IV expression was reduced, v-rDNA I-II, and VI were not affected by the tumor. This is an important observation because it indicates that even though rDNA transcription was significantly suppressed in wasting muscle, it was not a consequence of a general repression of all rDNA loci. These results indicate that a specific mechanism triggered the downregulation of rDNA transcription in cachexia, and that the contribution of rDNA loci to rRNA production is context dependent. When contrasted with the response to a hypertrophic stimulus,38 a distinct v-rDNA expression pattern can be observed. Due to the differences in animal models and muscle studied, we are not able to directly compare these patterns, nevertheless, the assessment of v-rDNA expression within each of these models clearly indicates that active rDNA loci are regulated in a physiological context-dependent manner.52 Interestingly, despite the reduction in rDNA transcription, we found a contrasting expression pattern of Pol I subunits and accessory factors in wasting muscle. The elevated expression of Pol I subunits and accessory factors may reflect an attempt of the Pol I machinery to restore the ribosomal capacity of the muscle and it also supports our interpretation that repression of rDNA transcription is selective. Likely representing a compensatory response to the reduction in rDNA transcription, the increased expression of Pol I factors and subunits observed in this study is similar to that previously reported during denervation-induced muscle atrophy where lower rRNA production was contrasted with the increased expression of UBF, TBP, and TAF1B.53 These findings suggest that a feedback mechanism sensing diminished rDNA transcription stimulates the upregulation of Pol I subunits and accessory factors. Still, the extremely low protein synthetic activity observed in the wasting muscles (i.e. low Puromycin incorporation and 4E-BP1 hyperphosphorylation) likely prevented translation of these factors, and hence the restoration of rDNA transcription.
In addition to a reduction in rDNA transcription, we investigated whether rRNA degradation could also be involved in the ribosomal deficit and muscle wasting in this cancer model. We found an increase in NUFIP1 mRNA levels, a receptor for the selective transport of ribosomes to autophagic vesicles during ribophagy. NUFIP1, is a nucleo-cytoplasmic shuttling protein that binds to ribosomes and targets them to the lysosomes where the NUFIP1-ribosome complexes become degraded.40 The increase in NUFIP1 mRNA and the disappearance of NUFIP1 protein, together with an increase in LC3II/LC3I ratio, provided the basis for the initial interpretation that ribophagy actively degraded ribosomes during muscle wasting.54 To confirm the involvement of NUFIP1 in rRNA degradation via ribophagy, we performed independent validatory experiments using an in vitro model previously shown to undergo atrophy and rRNA loss via ribophagy.44,45 We reasoned that by blocking autophagolysosome formation and hence ribophagy, CLQ would rescue NUFIP1 protein levels and prevent the loss of rRNA. As expected, nutrient deprivation, in addition to reducing rDNA transcription, caused the rapid disappearance of NUFIP1, an increase in autophagic flux, and a reduction in rRNA.55 However, while inhibition of autophagy with CLQ rescued NUFIP1 in an autophagy-dependent manner, CLQ was not able to prevent the loss of rRNA. This was a surprising finding because if NUFIP1 was operating via the lysosomal system, disrupting autophagic flux should have prevented the loss of rRNA. We complemented the CLQ inhibition studies by using the proteasome inhibitor MG-132 as ribosomes can also be degraded by the 26S proteasome.56 Like CLQ, blocking proteasome activity in combination with CLQ did not prevent the reduction in rRNA, indicating that in this model of myotube atrophy, neither degradative pathway appears to be involved in the loss of rRNA. Further exploration of alternative mechanisms of ribosomal loss via endonucleolytic cleavage was monitored by separating rRNA via capillary electrophoresis. Cleavage by endonucleases results in rRNA fragmentation with a reduced density of 28S and 18S bands.57,58 We were unable to detect abnormal rRNA banding patterns during rRNA loss in either ES-2 tumor in vivo or atrophy in vitro. Thus, the non-functional rRNA decay pathway does not appear to be involved in rRNA loss in either setting. A possibility that remains to be explored is that skeletal muscle ribosomes are instead removed via exosomes. The exosomal-shuttle RNA pathway involves trafficking of various RNAs, including rRNA. In this context, rRNA transport could serve as a source of nutrients for the tumor or interorgan communication, and because exosomes do not contain their own rRNA, this cargo could originate in the wasting muscle as the donor tissue.59 However, given the size and abundance of exosomes, the relative contribution to the loss of muscle rRNA via this mechanism is likely to be minor. The inability of CLQ and MG-132 to prevent the loss of rRNA, in addition to the absence of rRNA fragmentation, indicates that in skeletal muscle, the reduction in rRNA appears to be a consequence of reduced rDNA transcription. Our results support this conclusion because in this cancer model, a mean 34 ± 19.4% reduction in rDNA transcription (range 46.7 to 85.5% active transcription) resulted in ~ 46.9 ± 9.4% reduction in rRNA content. Under normal physiological conditions, ribosome half-life is in the order of 5 to 10 days.60–62 Assuming an average half-life of 7 days, the observed reduction in rRNA content can be explained by a reduction in rDNA transcription of ~34 ± 19.4%. At an average rate of 66.1 ± 19.4% transcription, rRNA content after 14 days can be estimated to be ~75% ± 14%. Our results show that rRNA content 14 days after tumor implantation was ~53% (range: 43.7% to 62.5%). While this estimation needs experimental confirmation, evidence from other systems supports our interpretation of the downregulation of rDNA transcription as the likely cause of a lower rRNA content in wasting muscle. For example, results from nuclear run-on assays demonstrated that the decrease in rRNA levels typical of myogenic differentiation are directly attributable to reductions in rDNA transcription rates.52 Altogether, our results indicate that skeletal muscle undergoing wasting, a reduction in rDNA transcription is likely the principal mechanisms leading to a decrease in rRNA content and protein synthesis deficits.
In summary, the present study expanded our understanding of the mechanisms involved in muscle wasting in cancer by demonstrating that reduced expression of rRNA genes results in a decline in the muscle’s capacity for protein synthesis. The reduction in rDNA transcription appears to be the underlying cause of a lower ribosomal capacity and the protein synthesis deficits previously reported in cancer.23,24 While the precise molecular mechanisms responsible for the downregulation of rDNA transcription in cancer require further investigation, a better understanding of the regulation of the ribosomal capacity of the muscle will provide new opportunities to enhance muscle anabolism and design novel treatments to prevent muscle wasting in cancer cachexia. This is especially relevant considering that current approaches to block tumor progression target the ribosomal production machinery,63 and this will likely impair muscle anabolism.43
Acknowledgments
This work was supported by National Institutes of Health Grant AR073385, and funds from the Pennsylvania State University and Huck Institutes of the Life Sciences to G.A.N., and the Department of Surgery and the Department of Otolaryngology - Head & Neck Surgery, at Indiana University, and by grants from the Ralph W. and Grace M. Showalter Research Trust Fund, the V Foundation for Cancer Research (V2017-021) and the American Cancer Society (Research Scholar Grant 132013-RSG-18-010-01-CCG) to A.B.
Nonstandard abbreviations
- 4E-BP1
eukaryotic factor 4E binding protein 1
- CLQ
Chloroquine diphosphate salt
- eIF-4E
eukaryotic initiation factor 4E
- MG-132
Carbobenzoxy-Leu-Leu-Leucinal
- NUFIP1
nuclear fragile X mental retardation-interacting protein 1
- PAF49
RNA polymerase I associated factor 49
- PAF53 (Polr1e)
RNA polymerase I associated factor 53
- Pol I
RNA Polymerase I
- Polr1a
RNA Polymerase I Subunit A
- Polr1b
RNA Polymerase I Subunit B
- Polr1c
RNA Polymerase I Subunit C
- Polr1d
RNA Polymerase I Subunit D
- Polr1e
RNA Polymerase I Subunit E
- Polr1f
RNA Polymerase I Subunit F
- RIN
RNA integrity number
- SL1
Selectivity Factor 1
- TAFs
TATA-Box Binding Protein Associated Factor
- TBP
TATA-Box Binding Protein.
- TCOF1
Treacle Ribosome Biogenesis Factor 1
- TIF-1A
Transcription Initiation Factor-1A
- TTF1
Transcription Termination Factor 1
- Twistnb (Polr1f)
TWIST Neighbor
- UBF
Upstream Binding Factor
- v-rDNA
variant-rDNA
- ZNHIT3
Zinc Finger HIT-Type Containing 3
- Znrd1
Zinc Ribbon Domain Containing 1
Footnotes
Conflict of interest
The authors declare there are no conflicts of interest.
References
- 1.Tan BHL, Fearon KCH. Cachexia: prevalence and impact in medicine. Curr Opin Clin Nutr Metab Care. 2008;11(4):400–407. [DOI] [PubMed] [Google Scholar]
- 2.Tisdale MJ. Mechanisms of cancer cachexia. Physiol Rev. 2009;89(2):381–410. [DOI] [PubMed] [Google Scholar]
- 3.Johns N, Stephens NA, Fearon KCH. Muscle wasting in cancer. Int J Biochem Cell Biol. 2013;45(10):2215–2229. [DOI] [PubMed] [Google Scholar]
- 4.Siegel RL, Miller KD, Jemal A. Cancer statistics, 2019. CA Cancer J Clin. 2019;69(1):7–34. [DOI] [PubMed] [Google Scholar]
- 5.Fearon K, Strasser F, Anker SD, et al. Definition and classification of cancer cachexia: an international consensus. Lancet Oncol. 2011;12(5):489–495. [DOI] [PubMed] [Google Scholar]
- 6.Aversa Z, Costelli P, Muscaritoli M. Cancer-induced muscle wasting: latest findings in prevention and treatment. Ther Adv Med Oncol. 2017;9(5):369–382. [DOI] [PMC free article] [PubMed] [Google Scholar]
- 7.Prado CMM, Lieffers JR, McCargar LJ, et al. Prevalence and clinical implications of sarcopenic obesity in patients with solid tumours of the respiratory and gastrointestinal tracts: a population-based study. Lancet Oncol. 2008;9(7):629–635. [DOI] [PubMed] [Google Scholar]
- 8.Huang C, Yang Y, Chen T, et al. Muscle loss during primary debulking surgery and chemotherapy predicts poor survival in advanced‐stage ovarian cancer. J Cachexia Sarcopenia Muscle. 2020;11(2):534–546. [DOI] [PMC free article] [PubMed] [Google Scholar]
- 9.Bronger H, Hederich P, Hapfelmeier A, et al. Sarcopenia in advanced serous ovarian cancer. Int J Gynecol Cancer. 2017;27(2). [DOI] [PubMed] [Google Scholar]
- 10.Rutten IJG, van Dijk DPJ, Kruitwagen RFPM, Beets‐Tan RGH, Olde Damink SWM, van Gorp T. Loss of skeletal muscle during neoadjuvant chemotherapy is related to decreased survival in ovarian cancer patients. J Cachexia Sarcopenia Muscle. 2016;7(4):458–466. [DOI] [PMC free article] [PubMed] [Google Scholar]
- 11.Aust S, Knogler T, Pils D, et al. Skeletal muscle depletion and markers for cancer cachexia are strong prognostic factors in epithelial ovarian cancer. PLoS One. 2015;10(10):e0140403. [DOI] [PMC free article] [PubMed] [Google Scholar]
- 12.Thoresen L, Frykholm G, Lydersen S, et al. Nutritional status, cachexia and survival in patients with advanced colorectal carcinoma. Different assessment criteria for nutritional status provide unequal results. Clin Nutr. 2013;32(1):65–72. [DOI] [PubMed] [Google Scholar]
- 13.Prado CMM, Antoun S, Sawyer MB, Baracos VE. Two faces of drug therapy in cancer: drug-related lean tissue loss and its adverse consequences to survival and toxicity. Curr Opin Clin Nutr Metab Care. 2011;14(3):250–254. [DOI] [PubMed] [Google Scholar]
- 14.Burckart K, Beca S, Urban RJ, Sheffield-Moore M. Pathogenesis of muscle wasting in cancer cachexia: targeted anabolic and anti-catabolic therapies. Curr Opin Clin Nutr Metab Care. 2010;13(4):410. [DOI] [PMC free article] [PubMed] [Google Scholar]
- 15.Millward DJ, Garlick PJ, Stewart RJC, Nnanyelugo DO, Waterlow JC. Skeletal-muscle growth and protein turnover. Biochem J. 1975;150(2):235–243. [DOI] [PMC free article] [PubMed] [Google Scholar]
- 16.Millward DJ, Garlick PJ, Nnanyelugo DO, Waterlow JC. The relative importance of muscle protein synthesis and breakdown in the regulation of muscle mass. Biochem J. 1976;156(1):185–188. [DOI] [PMC free article] [PubMed] [Google Scholar]
- 17.Millward DJ, Bates PC, Brown JG, Rosochacki SR, Rennie MJ. Protein degradation and the regulation of protein balance in muscle In: Protein Degradation in Health and Disease. Excerpta Medica; Amsterdam; 1980:307–329. [DOI] [PubMed] [Google Scholar]
- 18.Svaninger G, Bennegard K, Ekman L, Ternell M, Lundholm K. Lack of evidence for elevated breakdown rate of skeletal muscles in weight-losing, tumor-bearing mice. J Natl Cancer Inst. 1983;71(2):341–346. [PubMed] [Google Scholar]
- 19.Lopes MN, Black P, Ashford AJ, Pain VM. Protein metabolism in the tumour-bearing mouse. Rates of protein synthesis in host tissues and in an Ehrlich ascites tumour at different stages in tumour growth. Biochem J. 1989;264(3):713–719. [DOI] [PMC free article] [PubMed] [Google Scholar]
- 20.Emery PW, Lovell L, Rennie MJ. Protein synthesis measured in vivo in muscle and liver of cachectic tumor-bearing mice. Cancer Res. 1984;44(7):2779–2784. [PubMed] [Google Scholar]
- 21.Emery PW, Edwards RH, Rennie MJ, Souhami RL, Halliday D. Protein synthesis in muscle measured in vivo in cachectic patients with cancer. Br Med J (Clin Res Ed). 1984;289(6445):584–586. [DOI] [PMC free article] [PubMed] [Google Scholar]
- 22.Dworzak F, Ferrari P, Gavazzi C, Maiorana C, Bozzetti F. Effects of cachexia due to cancer on whole body and skeletal muscle protein turnover. Cancer Interdiscip Int J Am Cancer Soc. 1998;82(1):42–48. [PubMed] [Google Scholar]
- 23.Tessitore L, Costelli P, Bonetti G, Baccino FM. Cancer cachexia, malnutrition, and tissue protein turnover in experimental animals. Arch Biochem Biophys. 1993;306(1):52–58. [DOI] [PubMed] [Google Scholar]
- 24.Durham WJ, Dillon EL, Sheffield-Moore M. Inflammatory burden and amino acid metabolism in cancer cachexia. Curr Opin Clin Nutr Metab Care. 2009;12(1):72. [DOI] [PMC free article] [PubMed] [Google Scholar]
- 25.Rosa-Caldwell ME, Fix DK, Washington TA, Greene NP. Muscle alterations in the development and progression of cancer-induced muscle atrophy: a review. J Appl Physiol. 2020;128(1):25–41. [DOI] [PMC free article] [PubMed] [Google Scholar]
- 26.Millward DJ, Garlick PJ, James WPT, Nnanyelugo DO, Ryatt JS. Relationship between protein synthesis and RNA content in skeletal muscle. Nature. 1973;241(5386):204–205. doi: 10.1038/241204a0 [DOI] [PubMed] [Google Scholar]
- 27.Paule MR. Transcription of Ribosomal RNA Genes by Eukaryotic RNA Polymerase I Springer; 1998. [Google Scholar]
- 28.Grummt I Regulation of mammalian ribosomal gene transcription by RNA polymerase I. Prog Nucleic Acid Res Mol Biol. 1999;62:109–154. [DOI] [PubMed] [Google Scholar]
- 29.Reeder RH. Regulation of RNA polymerase I transcription in yeast and vertebrates In: Progress in Nucleic Acid Research and Molecular Biology. Vol 62 Elsevier; 1998:293–327. [DOI] [PubMed] [Google Scholar]
- 30.Moss T, Stefanovsky VY. Promotion and Regulation of Ribosomal Transcription in Eukaryotes by RNA Polymerase. Prog Nucleic Acid Res Mol Biol. 1995;50(C):25–66. doi: 10.1016/S0079-6603(08)60810-7 [DOI] [PubMed] [Google Scholar]
- 31.Hannan KM, Hannan RD, Rothblum LI. Transcription by RNA polymerase I. Front Biosci. 1998;3:d376–98. http://www.ncbi.nlm.nih.gov/pubmed/9514985 [DOI] [PubMed] [Google Scholar]
- 32.Russell J, Zomerdijk JCBM. Europe PMC Funders Group RNA-polymerase-I-directed rDNA transcription, life and works. 2013;30(2). doi: 10.1016/j.tibs.2004.12.008.RNA-polymerase-I-directed [DOI] [PMC free article] [PubMed] [Google Scholar]
- 33.Bell SP, Learned RM, Jantzen H-M, Tjian R. Functional cooperativity between transcription factors UBF1 and SL1 mediates human ribosomal RNA synthesis. Science (80-). 1988;241(4870):1192–1197. [DOI] [PubMed] [Google Scholar]
- 34.Learned RM, Cordes S, Tjian R. Purification and characterization of a transcription factor that confers promoter specificity to human RNA polymerase I. Mol Cell Biol. 1985;5(6):1358–1369. doi: 10.1128/MCB.5.6.1358 [DOI] [PMC free article] [PubMed] [Google Scholar]
- 35.Learned RM, Learned TK, Haltiner MM, Tjian RT. Human rRNA transcription is modulated by the coordinate binding of two factors to an upstream control element. Cell. 1986;45(6):847–857. [DOI] [PubMed] [Google Scholar]
- 36.Conconi A, Widmer RM, Koller T, Sogo J. Two different chromatin structures coexist in ribosomal RNA genes throughout the cell cycle. Cell. 1989;57(5):753–761. [DOI] [PubMed] [Google Scholar]
- 37.Sanij E, Poortinga G, Sharkey K, et al. UBF levels determine the number of active ribosomal RNA genes in mammals. J Cell Biol. 2008;183(7):1259–1274. [DOI] [PMC free article] [PubMed] [Google Scholar]
- 38.Tseng H, Chou W, Wang J, Zhang X, Zhang S, Schultz RM. Mouse ribosomal RNA genes contain multiple differentially regulated variants. PLoS One. 2008;3(3). [DOI] [PMC free article] [PubMed] [Google Scholar]
- 39.Galluzzi L, Baehrecke EH, Ballabio A, et al. Molecular definitions of autophagy and related processes. EMBO J. 2017;36(13):1811–1836. [DOI] [PMC free article] [PubMed] [Google Scholar]
- 40.Wyant GA, Abu-Remaileh M, Frenkel EM, et al. NUFIP1 is a ribosome receptor for starvation-induced ribophagy. Science (80-). 2018;360(6390):751–758. [DOI] [PMC free article] [PubMed] [Google Scholar]
- 41.Pin F, Barreto R, Kitase Y, et al. Growth of ovarian cancer xenografts causes loss of muscle and bone mass: a new model for the study of cancer cachexia. J Cachexia Sarcopenia Muscle. 2018;9(4):685–700. [DOI] [PMC free article] [PubMed] [Google Scholar]
- 42.von Walden F, Casagrande V, Östlund Farrants A-K, Nader GA. Mechanical loading induces the expression of a Pol I regulon at the onset of skeletal muscle hypertrophy. Am J Physiol Physiol. 2012;302(10):C1523–C1530. doi: 10.1152/ajpcell.00460.2011 [DOI] [PubMed] [Google Scholar]
- 43.von Walden F, Liu C, Aurigemma N, Nader GA. mTOR signaling regulates myotube hypertrophy by modulating protein synthesis, rDNA transcription, and chromatin remodeling. Am J Physiol Physiol. 2016;311(4):C663–C672. doi: 10.1152/ajpcell.00144.2016 [DOI] [PubMed] [Google Scholar]
- 44.Stevenson EJ, Koncarevic A, Giresi PG, Jackman RW, Kandarian SC. Transcriptional profile of a myotube starvation model of atrophy. J Appl Physiol. 2005;98(4):1396–1406. [DOI] [PubMed] [Google Scholar]
- 45.Choi RH, McConahay A, Silvestre JG, Moriscot AS, Carson JA, Koh H. TRB3 regulates skeletal muscle mass in food deprivation–induced atrophy. FASEB J. 2019;33(4):5654–5666. [DOI] [PMC free article] [PubMed] [Google Scholar]
- 46.Wool IG, Kurihara K. Determination of the number of active muscle ribosomes: effect of diabetes and insulin. Proc Natl Acad Sci U S A. 1967;58(6):2401. [DOI] [PMC free article] [PubMed] [Google Scholar]
- 47.Mueller O, Lightfoot S, Schroeder A. RNA integrity number (RIN)–standardization of RNA quality control. Agil Appl note, Publ. 2004;1:1–8. [Google Scholar]
- 48.Schroeder A, Mueller O, Stocker S, et al. The RIN: an RNA integrity number for assigning integrity values to RNA measurements. BMC Mol Biol. 2006;7(1):1–14. [DOI] [PMC free article] [PubMed] [Google Scholar]
- 49.Baracos VE, DeVivo C, Hoyle DH, Goldberg AL. Activation of the ATP-ubiquitin-proteasome pathway in skeletal muscle of cachectic rats bearing a hepatoma. Am J Physiol Metab. 1995;268(5):E996–E1006. [DOI] [PubMed] [Google Scholar]
- 50.Goodlad GAJ, Clark CM. Response of skeletal muscle RNA polymerases I and II to tumour growth. Biochim Biophys Acta (BBA)-Gene Struct Expr. 1988;950(3):296–302. [DOI] [PubMed] [Google Scholar]
- 51.Cui C, Tseng H. Estimation of ribosomal RNA transcription rate in situ. Biotechniques. 2004;36(1):134–138. [DOI] [PubMed] [Google Scholar]
- 52.Larson DE, Xie W, Glibetic M, O’Mahony D, Sells BH, Rothblum LI. Coordinated decreases in rRNA gene transcription factors and rRNA synthesis during muscle cell differentiation. Proc Natl Acad Sci. 1993;90(17):7933–7936. [DOI] [PMC free article] [PubMed] [Google Scholar]
- 53.Machida M, Takeda K, Yokono H, et al. Reduction of ribosome biogenesis with activation of the mTOR pathway in denervated atrophic muscle. J Cell Physiol. 2012;227(4):1569–1576. [DOI] [PubMed] [Google Scholar]
- 54.Klionsky DJ, Abdelmohsen K, Abe A, et al. Guidelines for the use and interpretation of assays for monitoring autophagy. Autophagy. 2016;12(1):1–222. [DOI] [PMC free article] [PubMed] [Google Scholar]
- 55.Kristensen AR, Schandorff S, Høyer-Hansen M, et al. Ordered organelle degradation during starvation-induced autophagy. Mol Cell proteomics. 2008;7(12):2419–2428. [DOI] [PubMed] [Google Scholar]
- 56.Ramachandran KV, Fu JM, Schaffer TB, Na CH, Delannoy M, Margolis SS. Activity-dependent degradation of the nascentome by the neuronal membrane proteasome. Mol Cell. 2018;71(1):169–177. [DOI] [PMC free article] [PubMed] [Google Scholar]
- 57.Wreschner DH, James TC, Silverman RH, Kerr IM. Ribosomal RNA cleavage, nuclease activation and 2–5A (ppp (A2′ p) nA) in interferon-treated cells. Nucleic Acids Res. 1981;9(7):1571–1581. [DOI] [PMC free article] [PubMed] [Google Scholar]
- 58.King KL, Jewell CM, Bortner CD, Cidlowski JA. 28S ribosome degradation in lymphoid cell apoptosis: evidence for caspase and Bcl-2-dependent and-independent pathways. Cell Death Differ. 2000;7(10):994–1001. [DOI] [PubMed] [Google Scholar]
- 59.Li M, Zeringer E, Barta T, Schageman J, Cheng A, Vlassov AV. Analysis of the RNA content of the exosomes derived from blood serum and urine and its potential as biomarkers. Philos Trans R Soc B Biol Sci. 2014;369(1652):20130502. [DOI] [PMC free article] [PubMed] [Google Scholar]
- 60.Hirsch CA, Hiatt HH. Turnover of liver ribosomes in fed and in fasted rats. J Biol Chem. 1966;241(24):5936–5940. [PubMed] [Google Scholar]
- 61.Nikolov EN, Dabeva MD. Turnover of ribosomal 28S and 18S rRNA during rat liver regeneration. Biosci Rep. 1983;3(8):781–788. [DOI] [PubMed] [Google Scholar]
- 62.Mathis AD, Naylor BC, Carson RH, et al. Mechanisms of in vivo ribosome maintenance change in response to nutrient signals. Mol Cell Proteomics. 2017;16(2):243–254. [DOI] [PMC free article] [PubMed] [Google Scholar]
- 63.Yan S, Frank D, Son J, et al. The potential of targeting ribosome biogenesis in high-grade serous ovarian cancer. Int J Mol Sci. 2017;18(1):210. [DOI] [PMC free article] [PubMed] [Google Scholar]


