Abstract
It has long been recognized that liquid interfaces, such as the air–water interface (AWI), can enhance the formation of protein fibrils. This makes liquid interfaces attractive templates for fibril formation but fully realizing this requires knowledge of protein behavior at interfaces, which is currently lacking. To address this, molecular dynamics simulation is used to investigate fragments of amyloid beta, a model fibril forming protein, at the air–water interface. At the air–water interface, the enrichment of aggregation-prone helical conformations provides a mechanism for the enhancement of fibrillation at interfaces. The conformational ensemble at the air–water interface was also considerably reduced compared to bulk solution due to the tendency of hydrophobic side chains partitioning into the air restricting the range of conformations. Little overlap between the conformational ensembles at the AWI and in the bulk solution was found, suggesting that AWI induces the formation of a different set of structures compared to bulk solution. The smaller A(16–22) and A(25–35) fragments show an increase in the propensity for an ordered secondary structure at the air–water interface but with a increased propensity for turn over other motifs, illustrating the importance of intra-protein interactions for stabilizing helical and extended conformations.
I. INTRODUCTION
The formation of amyloid fibrils (dense linear protein aggregates) is a common feature among proteins.1,2 They first came to prominence due to their connection with a number of diseases,3 such as Alzheimer’s, in which the formation of plaques formed by amyloid fibrils was first observed, Parkinson’s, and type-II diabetes. Coupled with its implications in disease, fibrils that perform a number of biological functions (functional fibrils) have been identified.4,5 These functions include formation of structural features, such as biofilms or insect egg cases, information transfer, and the storage of hormones. In many cases, functional fibrils take advantage of the excellent material and mechanical properties of protein fibrils. Their properties have also prompted the use of fibrils as components in materials’ applications. Combining their strength with their biocompatibility has led to a number of applications ranging from biomaterials to electronics.
While amyloid fibrils can form in many environments, it has been shown that liquid interfaces, such as air–water or oil–water interfaces, can greatly enhance their formation.6–9 This is due to a combination of the (i) increased protein concentration at interfaces and (ii) interfaces stabilizing conformations favorable for fibril formation.10,11 Within the body, there are a host of interfaces, e.g., cell membranes and surfaces of organelles, that can nucleate fibril formation. This has been implicated in a number of diseases, such as the disruption of membranes by aggregation of islet amyloid polypeptide (IAPP) leading to type-II diabetes.12 Liquid interfaces have also been used as templates for the formation of ordered structures from a range of building blocks, both synthetic and natural, as such liquid interfaces provide an attractive environment for the formation of fibrils for use in many applications. To realize these applications, we need to understand the fibrilliation process at interfaces, in particular, understanding how the interfacial conformation of proteins can be related to their fibrillation. Study of the early stages of fibrillation, in particular, the conformations adopted by proteins at interfaces, will allow us to decouple the effect of the interface templating fibril-favoring conformations and identify intermediate states on the fibrillation pathway.
The investigation of protein conformation at interfaces is challenging experimentally due to the small length scales involved. Surface sensitive techniques, such as sum frequency generation13 (SFG), refractive index matched emulsion circular dichroism (RIME CD),14 and synchrotron radiation circular dichroism (SRCD),15 can give information on molecular structure at surfaces and interfaces. These, however, are ensemble techniques, and so they are averaged over all the protein molecules. This is a particular issue for intrinsically disordered proteins (IDPs), such as amyloid beta (A), which lack a well-defined native structure. Understanding the interfacial behavior of these proteins requires knowledge of the ensemble of different conformations they can exist in and how this is affected by interfaces.
Molecular dynamics simulation has become a powerful tool for the investigation of a biomolecular structure. In particular, the use of advanced sampling techniques, such as replica exchange16 or metadynamics,17 allows for the exhaustive sampling of conformations of IDPs. A number of previous studies have used these to investigate the structure of proteins on interfaces18–20 and surfaces,21,22 giving new insight into the role of such environments in driving changes to the protein structure. In particular, for disordered proteins, it has been shown that adsorption onto interfaces and surfaces can induce the formation of ordered structures, such as -helices or -strands, which may then be prone to further aggregation.
To aid understanding of the fibrillation process, it is common to investigate fragments of larger proteins. For A commonly, these include the A(10–40) fragment, which lacks the N-terminal region which remains disordered following fibril formation,23 A(16–22) fragment, which contains the central hydrophobic core of the protein, and A(25–35) fragment that is the smallest fragment to show the same neurotoxic effects of the full protein.24 While it may be expected that these fragments should mimic that of the full protein, in some cases these can show significantly different behaviors. For instance, on gold surfaces, the diphenylalanine motif in A(16–22) shows different behaviors to that in the full protein,25,26 which is responsible for the contrasting effect of surfaces on the fibrillation of the fragment and full protein. This highlights the importance of a larger protein structure on fragment behavior. To understand this comparison of small and large fragments, in particular, the investigation of whether the fragment behaves in the same way in a larger molecule than when its on its own is necessary.
In this paper, the behavior of three fragments of A, A(16–22), A(25–35), and A(10–40) is investigated at the air–water interface (AWI), a model hydrophobic–hydrophilic interface. Comparison with the structures found in the bulk solution shows that, in common with studies of other IDPs, the AWI induces the formation of ordered structures. This was primarily -helical for the largest fragment, significantly different to the structure found in the bulk solution. For the smaller two fragments, the similar secondary structure motifs were found on both the AWI and in the bulk solution but with a higher probability of the ordered structure at the AWI. This difference between the smaller and larger fragment highlights the importance of the larger protein in stabilizing the secondary structure formation.
II. MODEL AND METHODOLOGY
A. Simulated system
The simulated systems consist of a single protein molecule [A(16–22), A(25–35), or A(10–40) fragment] in water. For A(10–40) and A(25–35) the initial peptide structures were taken from experimental nuclear magnetic resonance (NMR) structures [1IYT (Ref. 27) and 1QYT (Ref. 28)] with the first nine and last two residues removed for A(10–40). The initial structure for A(16–22) was taken to be a linear chain constructed using Avogadro. Protonation states of the termini and for polarizable residues were set appropriate for pH = 7. For the AWI simulations, this was placed in a water slab with initial sizes of , , and for A(10–40) A(16–22) and A(25–35), respectively, with the box tripled in the -direction to give a vacuum layer on each side of the slab. For the bulk simulations, the protein was placed in a cubic water box with side lengths of 70 Å, 40 Å, and 50 Å for A(10–40) A(16–22) and A(25–35), respectively.
B. Simulation method
In order to enhance sampling of protein conformations’ replica exchange with solute tempering (REST) was employed.29,30 This is a variation on replica exchange molecular dynamics,31 where the temperature varies only for a subset of the system, in this case, the protein. The temperature scaling was performed by scaling the protein–protein and protein–solvent interactions by a factor depending on the effective temperature. Specifically, the potential energy was given by Ref. 30,
| (1) |
where , , and are the protein–protein, protein–solvent, and solvent–solvent interactions, respectively, and the scaling factor . For all systems, the effective temperature was in the range from 300 K to 440 K, slightly wider than used in previous REST simulations of the A(10–40) fragment,32 with the scaling factors and effective temperatures for different systems are given in Table I. Exchange attempts between neighboring replicas were attempted every 500 time steps (1 ps). Transitions between different temperatures and acceptance probabilities are given in the Appendix (Fig. 9 and Table V).
TABLE I.
REST scaling factors and effective temperatures.
| Nreplica | Scaling factors | ||
|---|---|---|---|
| Aβ(10–40) | AWI | 12 | 1 (300 K), 0.966 (311 K), 0.932 (322 K), 0.9 (333 K), 0.867 (345 K) |
| 0.84 (357 K), 0.811 (370 K), 0.784 (383 K), 0.757 (396 K), 0.731 (410 K) | |||
| 0.706 (425 K), 0.682 (440 K) | |||
| Solution | 10 | 1 (300 K), 0.956 (313 K), 0.918 (327 K), 0.88 (341 K), 0.843 (355 K) | |
| 0.808 (371 K), 0.775 (387 K), 0.742 (404 K), 0.711 (422 K), 0.682 (440 K) | |||
| Aβ(16–22) | AWI | 6 | 1 (300 K), 0.926 (324 K), 0.858 (350 K), |
| 0.795 (377 K), 0.736 (408 K), 0.682 (440 K) | |||
| Solution | 6 | 1 (300 K), 0.926 (324 K), 0.858 (350 K), | |
| 0.795 (377 K), 0.736 (408 K), 0.682 (440 K) | |||
| Aβ(25–35) | AWI | 8 | 1 (300 K), 0.947 (319 K), 0.896 (335 K), 0.849 (354 K) |
| 0.803 (373 K), 0.761 (394 K), 0.72 (417 K), 0.682 (440 K) | |||
| Solution | 8 | 1 (300 K), 0.947 (319 K), 0.896 (335 K), 0.849 (354 K) | |
| 0.803 (373 K), 0.761 (394 K), 0.72 (417 K), 0.682 (440 K) |
FIG. 9.
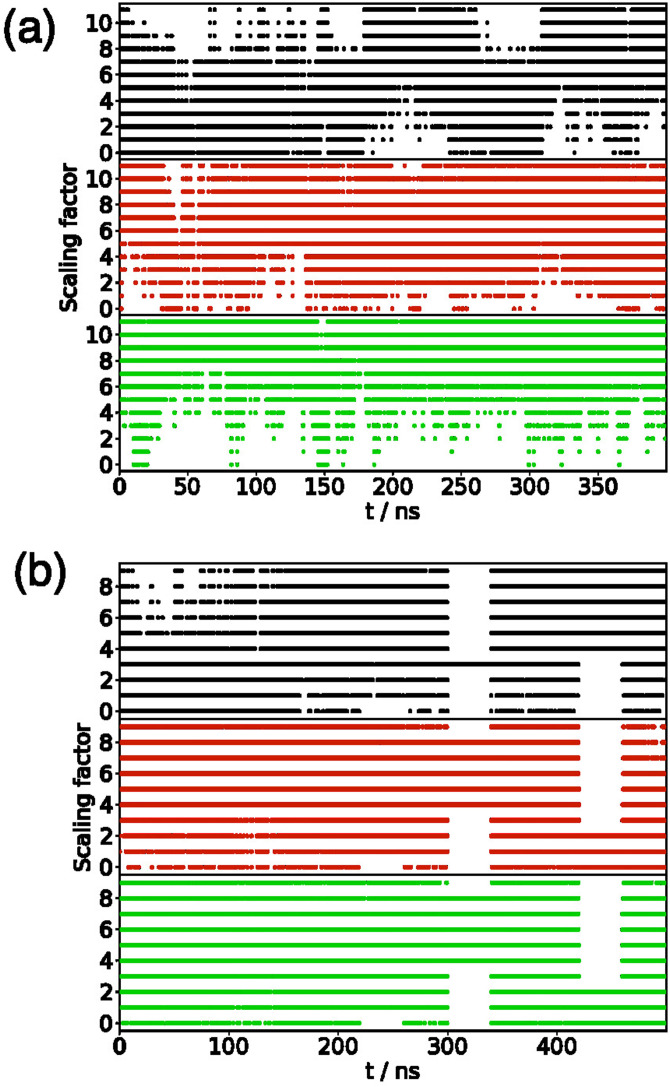
(a) Plot of scaling factor ( denotes ) for A(10–40) at the AWI. Graphs show (from top to bottom) replicas with , 6, and 11 at . (b) Plot of scaling factor ( denotes ) for A(10–40) in the bulk solution. Graphs show (from top to bottom) replicas with , 5, and 9 at .
TABLE V.
Acceptance rates for REST simulations.
| 0↔1 | 1↔2 | 2↔3 | 3↔4 | 4↔5 | 5↔6 | 6↔7 | 7↔8 | 8↔9 | 9↔10 | 10↔11 | ||
|---|---|---|---|---|---|---|---|---|---|---|---|---|
| Aβ(10–40) | AWI | 0.317 | 0.331 | 0.322 | 0.318 | 0.324 | 0.358 | 0.396 | 0.352 | 0.369 | 0.406 | 0.345 |
| Solution | 0.246 | 0.324 | 0.279 | 0.238 | 0.363 | 0.350 | 0.334 | 0.387 | 0.327 | |||
| Aβ(16–22) | AWI | 0.330 | 0.306 | 0.376 | 0.337 | 0.365 | ||||||
| Solution | 0.309 | 0.293 | 0.375 | 0.347 | 0.378 | |||||||
| Aβ(25–35) | AWI | 0.451 | 0.414 | 0.490 | 0.508 | 0.420 | 0.498 | 0.513 | ||||
| Solution | 0.469 | 0.451 | 0.509 | 0.528 | 0.466 | 0.539 | 0.555 |
Interfacial simulations were performed in the -ensemble with the temperature controlled using a velocity rescaling algorithm33 with a relaxation time of 0.2 ps. Bulk simulations were performed in the -ensemble using the Parrinello–Rahman barostat34 (relaxation time 2 ps) to control the pressure. All simulations were performed at a temperature of 300 K, and the bulk simulations had a pressure of 1 atm. Periodic boundary conditions were used with a cutoff of 12 Å for the van der Waals and short-range electrostatic interactions. Long-range electrostatic interactions were evaluated using a Particle Mesh Ewald35 sum with a Fourier spacing of 0.16 nm. Reciprocal space grids of (bulk solution) and (surface) were used. The equations of motion were integrated using a time step of 2 fs with the Linear Constraint Solver (LINCS) algorithm use to constrain bond lengths.36 Simulations were performed using the Gromacs simulation package (version 4.6.7),37–39 compiled with the PLUMED library40 to implement REST simulations.
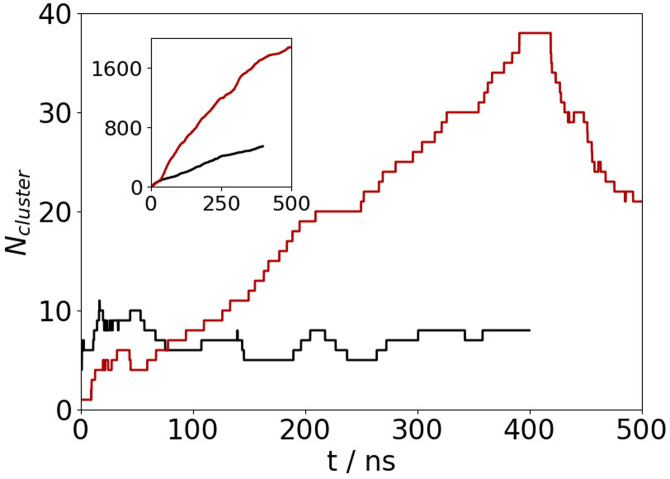
Simulation lengths were 400 ns for the interface simulations and 500 ns for the bulk simulation. Equilibration was judged from considering the number of unique conformations found from cluster analysis (Fig. 10) using the method of Daura et al.41 Conformations were partitioned into nonoverlapping clusters based on the root-mean-squared difference (RMSD) between positions (two conformations were in the same cluster if the RMSD was less than 3 Å). Equilibration being achieved once the number of low energy clusters (with free energy within of the most populated cluster) had plateaued. Following this, the simulations were run for a further 200 ns with the analysis performed over this period (unless otherwise stated).
FIG. 10.
Number of unique clusters against time for A(10–40) at the AWI (black) and in the bulk solution (red). The main panel shows number of clusters within of most common cluster, and the inset shows the total number of clusters.
C. Analysis
The analysis of the simulations was performed using a combination of standard Gromacs utilities, custom-written python scripts using the MDAnalysis library,42 and visual molecular dynamics.43 The secondary structure analysis was performed using the STRIDE algorithm.44 Similarity to helices was also analyzed through determining the number of -helical and 3/10-helical hydrogen bonds,21
| (2a) |
| (2b) |
where , , , and the sums run over all potential -helical [Eq. (2a)] and 3/10-helical [Eq. (2b)] hydrogen bonds, i.e., between backbone carbonyl oxygens and amine hydrogens separated by four or three residues, respectively. The similarity to -strands was analyzed through the dihedral offset function,
| (3) |
where the sum runs over the and angles of the protein residues and the reference angles are rad and rad, corresponding to an ideal -strand with alternating residues on opposite sides of the protein backbone.
Protein size was characterized through the radius of gyration
| (4) |
where is the position of the th atom and is the protein center of mass, and the sum runs over atoms in the protein and the eigenvalues of the gyration tensor are
| (5) |
The formation of compact structures can also be investigated through the number of contacts between C atoms calculated using
| (6) |
where the double summation runs over C atoms on different residues and the switching function is given by
| (7) |
where , , and . Contacts between C atoms () are calculated similarly (with ). The conformational ensemble was analyzed from a cluster analysis, using the method of Daura et al.,41 using a cutoff of 3 Å. Unless otherwise stated, the analysis was performed for the replica (the only physically relevant one).
III. RESULTS
A. Air–water interface induces formation of helical structures in amyloid-β
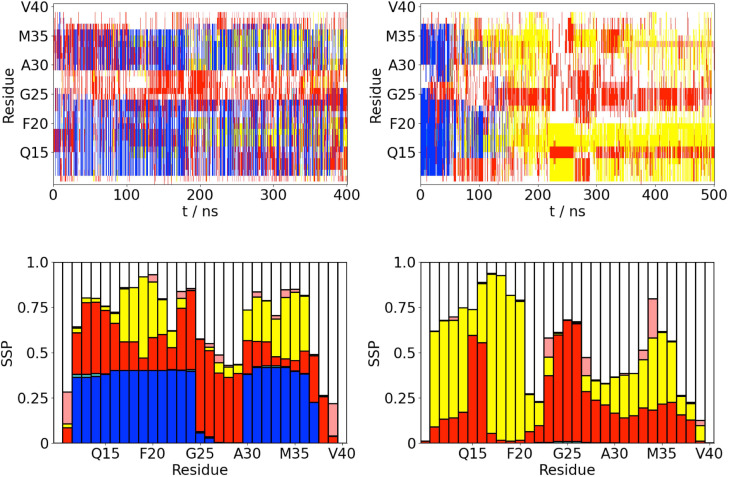
Adsorption onto the air–water interface significantly changes the structure of A(10–40). The secondary structure [Fig. 1(a)] shows large differences between the AWI and the bulk solution even from the same -helical starting structure. At the interface, the protein adopts a mixture of conformations, including ones with a high -helix content. The -helical conformations typically have two helical regions (V12-D23 and A30-V36). The formation of -helical structures is consistent with previous experimental studies of A,8,45 which have identified the formation of helical structures that may act as intermediate states for fibrillation on liquid interfaces. In the bulk solution, after the initial equilibration period, there are no -helical conformations. Rather, the protein adopts a mixture of -strand and disordered conformations.
FIG. 1.
(a) Time variation of the secondary structure for A(10–40) at the AWI (left) and in the bulk solution (right). -helix, -strand, turn, 3/10-helix, and random coil (disordered) denoted by blue, yellow, red, cyan, and white, respectively. (b) Propensity for different secondary structure motifs (both ordered and random coil) for each residue (averaged over last 200 ns of simulations). -helix, -strand, turn, 3/10-helix, and random coil (disordered) denoted by blue, yellow, red, cyan, and white, respectively.
The changes in the protein structure can also be seen from the propensity for different secondary structure motifs [Fig. 1(b)]. At the AWI, regions of higher -helix propensity can be seen, consistent with the time series of the secondary structure. Notably, no residue has an -helix propensity above 50%. There are also some regions (L17-A21 and I31-V36) that have a significant propensity for the -strand formation. These are both contained within the -strand regions in the A(1–40) fibril.23
In the bulk solution, there is a region of high -strand propensity near the N-terminus (E11-H14 and L17-F20) with the remainder of the protein being less ordered. Notably, there is lower propensity for -strand formation toward the C-terminal end of the peptide. Unlike the AWI, there are no -helical regions. For both AWI and bulk solution, there are also regions of the protein, such as the terminal residues and F20-A21 in the bulk solution, which adopt largely disordered conformations for most of the simulation (shown by white in the SSP plot).
The tertiary structure of A(10–40) is altered at the AWI (Table II). At the AWI, the protein is slightly more compact with and being larger than in the bulk solution. The more compact structure is also evidenced by the higher number of C contacts. Notably, the number of C contacts is similar in both environments, suggesting that differences in the protein structure are reflected largely in the backbone conformation than the packing of the side chains. Consistent with the differences in the secondary structures at the AWI, the number of helical hydrogen bonds (both -helix and 3/10-helix) is higher and the dihedral offset () is lower than in the bulk solution.
TABLE II.
Structure of Aβ(10–40) at the AWI and the bulk solution. Quoted uncertainties estimated from standard deviation.
| AWI | Solution | |
|---|---|---|
| Rg/Å | 10.7 ± 1.6 | 11.5 ± 1.8 |
| Gmax/Å | 8.9 ± 2.0 | 9.7 ± 2.1 |
| Gmid/Å | 5.0 ± 0.7 | 5.0 ± 0.9 |
| Gmin/Å | 3.4 ± 0.4 | 3.4 ± 0.4 |
| NCα | 162 ± 18 | 148 ± 14 |
| NCγ | 39 ± 6 | 37 ± 5 |
| Nα−HB | 5.8 ± 6.8 | 0.5 ± 0.4 |
| N3−10 | 4.6 ± 3.8 | 1.5 ± 0.6 |
| DH | 36 ± 9 | 46 ± 2 |
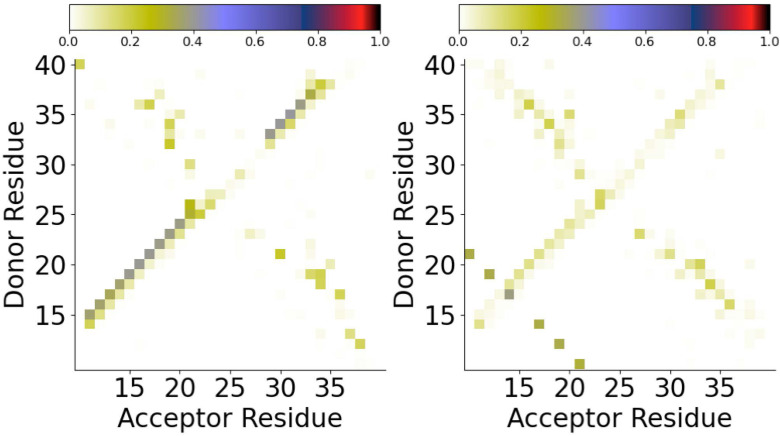
The difference in the secondary and tertiary structure of A(10–40) is driven by the differences in intramolecular interactions, in particular, backbone hydrogen bonding, in these environments. The probabilities of backbone hydrogen bond formation between the different residues are shown in Fig. 2. At the AWI, hydrogen bonds consistent with -helix formation are more probable than in the bulk solution, consistent with the higher -helix propensity [Fig. 1(b)]. The probability of these hydrogen bonds are , showing that the -helical structures are still in a minority. In the bulk solution, there is a significant probability of hydrogen bonding between the (E11-H14 and L17-F20) -strand regions, consistent with the formation of an intramolecular antiparallel beta sheet. Outside of this, the hydrogen bond probabilities are typically lower than at the AWI, suggesting that a hydrophobic interface induces the formation of more ordered structures.
FIG. 2.
Backbone hydrogen bond map for A(10–40) at the AWI (left) and in the bulk solution (right).
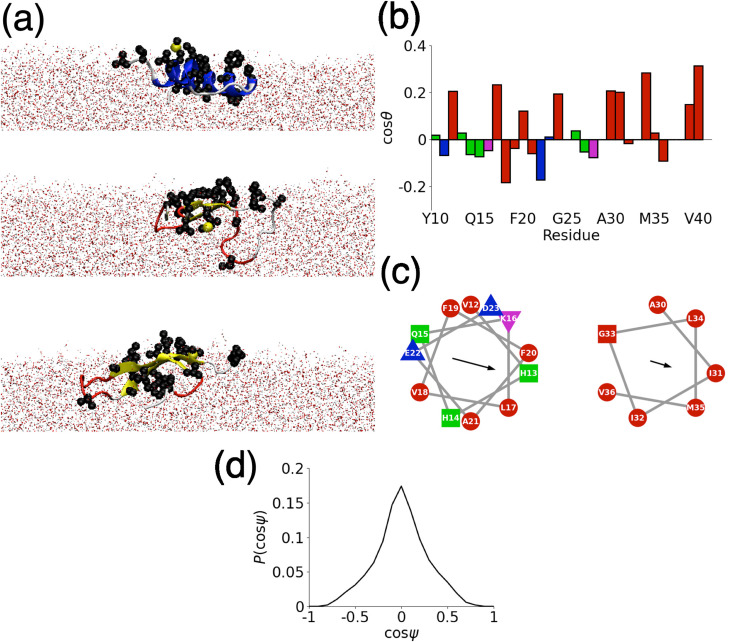
The formation of -helices at hydrophobic interfaces, which has been observed in a number of previous studies,46,47,20 is typically ascribed to the partitioning of hydrophobic residues into the hydrophobic media. Representative simulation snapshots [Fig. 3(a)] suggest that this holds for A(10–40). In all cases (for both -helix and -strand rich conformations), hydrophobic residues typically lie near the AWI or in the air region.
FIG. 3.
A(10–40) structure at the AWI. (a) Representative simulation snapshots, corresponding to the most common probable structures from cluster analysis. Hydrophobic side chains are highlighted as van der Waals (VDW) spheres. (b) Side chain orientation. Red, green, blue, and magenta denote hydrophobic, polar, negatively-charged, and positively charged residues, respectively. (c) Helical wheel plots for -helical regions (V12-D23 and A30-V36). Colors as in (b). (d) Probability histogram of helix orientation relative to AWI ().
The partitioning of the hydrophobic residues can be assessed quantitively through the orientation of each side chain [Fig. 3(b)]. This was defined as the angle between the interface normal, taken to be the -axis and the vector joining the atom, and terminal heavy atom in the side chain for each residue. Typically, hydrophobic residues orient toward the air–water interface. Consideration of the two principal -helical regions [Fig. 3(c)] shows that in the first of these (V12-D23) forms an amphipathic helix with a predominately hydrophobic face (consisting of H13, K16, L17, F20, and A21). This hydrophobic face may act as a hotspot for aggregation between neighboring molecules on the AWI, increasing the rate of fibrillation. The second helical region (A30-V36) is largely hydrophobic (being drawn from the more hydrophobic C-terminus of the protein).
As can be seen from the snapshots, the helices also tend to lie in the plane of the AWI. This can be assessed quantitatively through the angle between the helix axis and the interface normal. The average consistent with the helix lying in the interface plane. This is also shown by the histogram of [Fig. 3(d)], which is peaked around . Similar behavior was seen for the insulin B-chain at the air–water interface.20
B. Effect of air–water interface on the conformational ensemble of Aβ
As an intrinsically disordered protein, A exists in an ensemble of different conformations, which can be modified through adsorption onto interfaces. Using the cluster analysis, the size of the conformational ensemble and typical structures in these different environments can be examined. There is a substantial reduction in the number of distinct conformations at the AWI compared to the bulk solution (256 vs 647). This shows that adsorption to the interface restricts the number of conformations the protein can adopt, likely driven by the preferred partitioning of the hydrophobic side chains into air.
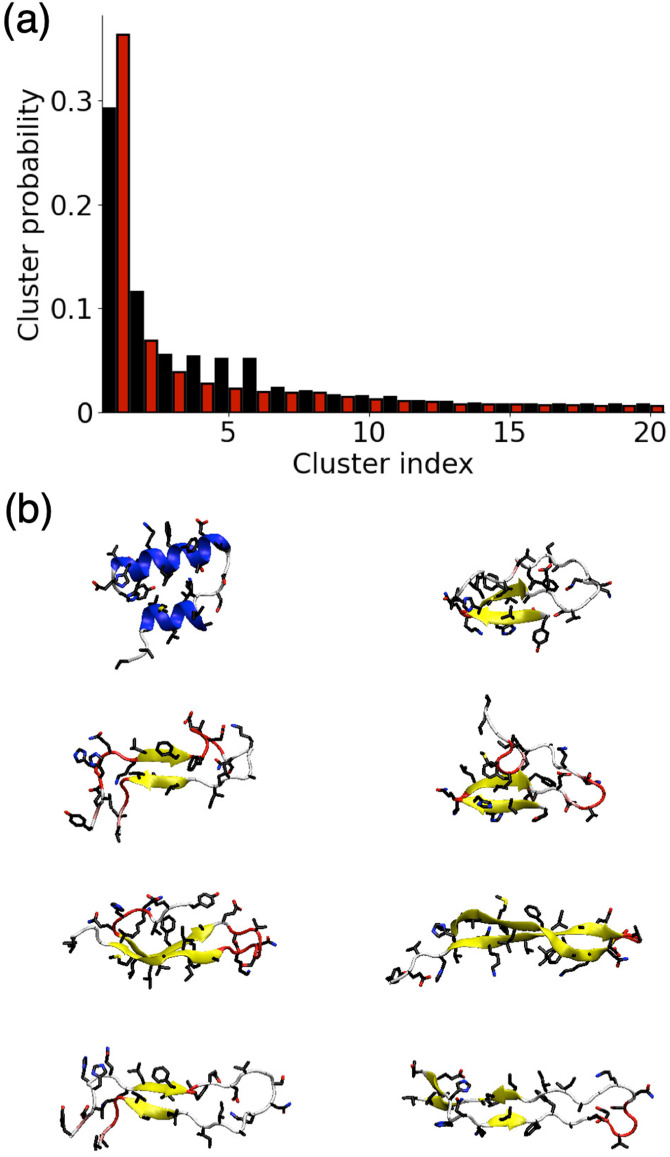
The probability of different clusters for the AWI and the bulk solution is shown in Fig. 4(a). While in both environments, the first cluster is significantly more probable than the others, it is still showing that there is not a single predominant structure in both environments. Despite the reduction in the total numbers of conformations at the AWI, the decrease in probability with the cluster index is slower than in the bulk solution. Comparison of the structures of the different clusters [Fig. 4(b)] shows that the most common cluster at the AWI is -helical rich but the other common clusters have a higher -strand content. This is consistent with the enriched formation of aggregation-prone helical intermediates at the AWI. In the bulk solution, there are no -helical conformations among the most common clusters.
FIG. 4.
(a) Probability of different clusters for A(10–40) at the AWI (black) and in the bulk solution (red). (b) Snapshots showing higher ranked clusters for A(10–40) at the AWI (left) and in the bulk solution (right).
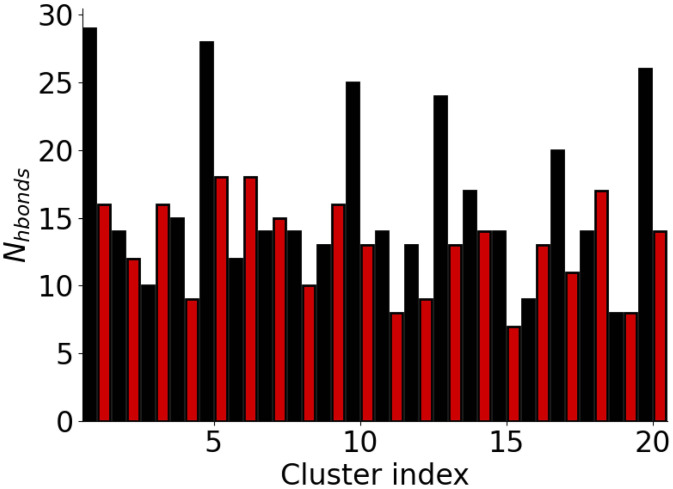
The different hydrogen bonding patterns between the AWI and the bulk solution (Fig. 2) are also apparent when we consider the hydrogen bonds formed in the different clusters (Table III). At the AWI, the top ranked cluster has a number of -helical hydrogen bonds. It, and other clusters with -helical structures, has significantly more hydrogen bonds than the other clusters at the AWI and those found in the bulk solution (Fig. 5). The increase in the number hydrogen bonds has been seen for other proteins that form -helices at interfaces20 and reflects the increase in the hydrogen bond strength at interfaces. Other clusters found at the AWI also show different hydrogen bonding patterns to those in the bulk solution. In particular, hydrogen bonds between residues at the N- and C-termini (Y10-V40, V12-G38) are found, which suggest increased interactions between the two termini. Hydrogen bonds between the residues near the termini are less common in the most common solution conformations.
TABLE III.
Hydrogen bonds in highest ranked clusters (first residue donor, second acceptor). α-helical hydrogen bonds highlighted in bold.
| Cluster ID | Nhbonds | Hydrogen bond list |
|---|---|---|
| AWI | ||
| 1 | 29 | E11→H14, H13→H13, Q15→Y10, Q15→E11, Q15→E11, K16→V12, |
| L17→H13, V18→H14, F19→Q15, F20→K16, F20→L17, A21→L17, | ||
| A21→V18, E22→V18, D23→F19, V24→F20, V24→A21, G25→E22, | ||
| S26→A21, K28→E22, K28→E22, G29→N27, G33→G29, L34→A30, | ||
| M35→I31, M35→I32, V36→I32, G37→G33, G38→L34 | ||
| 2 | 14 | V12→G38, H13→G37, H14→H13, Q15→H14, K16→G37, K16→E11, |
| L17→V36, F19→L34, E22→N27, N27→F20, K28→E22, L34→F19, | ||
| V36→L17, V40→Y10 | ||
| 3 | 10 | Q15→V36, K16→H13, V18→L34, A21→A30, G25→D23, G25→D23, |
| S26→D23, G29→S26, A30→A21, I32→F19 | ||
| 4 | 15 | V12→G38, H13→G37, H13→Q15, H14→H13, H14→H14, K16→G37, |
| K16→E11, L17→V36, F19→L34, D23→E22, K28→D23, K28→D23, | ||
| L34→F19,V36→L17, V40→Y10 | ||
| Solution | ||
| 1 | 16 | Y10→A21, Y10→D23, Y10→D23, V12→F19, H13→E11, H14→L17, |
| L17→H14, F19→V12, F20→G33, A21→Y10, D23→N27, N27→D23, | ||
| N27→G25, M35→F20, V36→M35, V40→G38 | ||
| 2 | 12 | Y10→A21, Y10→D23, V12→F19, H14→L17, L17→H14, F19→V12, |
| F20→I32, A21→Y10, D23→N27, S26→D23, N27→D23, L34→F20 | ||
| 3 | 16 | Q15→G38, L17→M35, F19→G33, A21→A30, D23→N27, V24→D23, |
| S26→D23, S26→G25, N27→D23, N27→V24, G29→A21, I32→F19 | ||
| G33→F19, M35→L17, G37→G15, V40→H13 | ||
| 4 | 9 | V12→G38, H13→E11, V18→L34, S26→D23, S26→D23, L34→V18, |
| V36→K16, G38→V12, V40→Y10 |
FIG. 5.
Number of hydrogen bonds in clusters for A(10–40) at the AWI (black) and in the bulk solution (red).
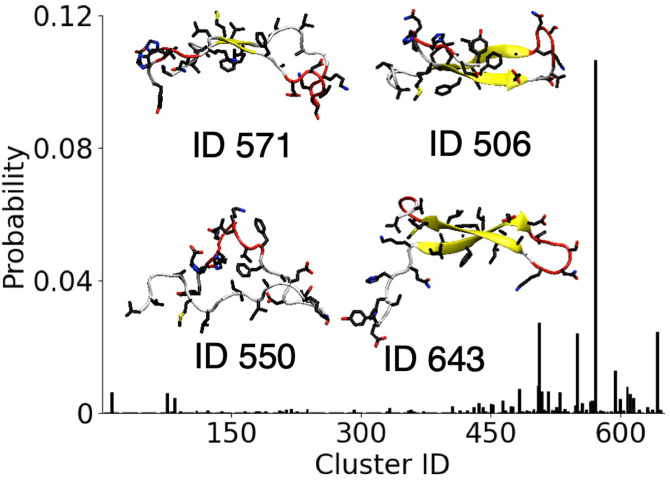
To investigate the difference between the conformational ensembles at the AWI and in the bulk solution, the probability of finding each solutionlike conformation in the AWI simulation is determined. Following the previous work,22 the –C distance root-mean-squared deviation (DRMSD) is calculated between each saved conformation from the AWI simulation and the clusters found in the bulk solution with the conformations matching if . Similar to the previous study of the model fibril forming polypeptide hIAPP on hydrophobic surfaces, generally the conformations formed at the AWI do not typically correspond to those found in the bulk solution with of the conformations found at the interface having a from any solution conformation. This suggests that the AWI induces the formation of conformations that are qualitatively different to those found in the bulk solution. This is similar to behavior seen for other IDPs on hydrophobic interfaces but differs from the behavior of A on more hydrophilic gold surfaces,26 suggesting that interfacial hydrophobicity plays a major role in determining the protein conformation. The only solutionlike conformations (Fig. 6) that are found with a probability greater than 0.01 correspond to cluster IDs 506 (), 550 (0.02), 571 (0.11), 594 (0.01), and 643 (0.02), where increasing ID corresponds to decreasing probability for these clusters in the bulk solution. This indicates that solutionlike conformations found at the AWI do not correspond to the most commonly observed conformations in the solution. The solutionlike clusters typically are either -strand or random coil, suggesting the the aggregation-prone -helical conformations are induced at the air–water interface and not present in the bulk solution.
FIG. 6.
Probability of A(10–40) solution conformations (by cluster ID) found in AWI simulation. Insets show snapshots of most probable solutionlike conformations at the AWI.
C. Effects of AWI on fragment conformation
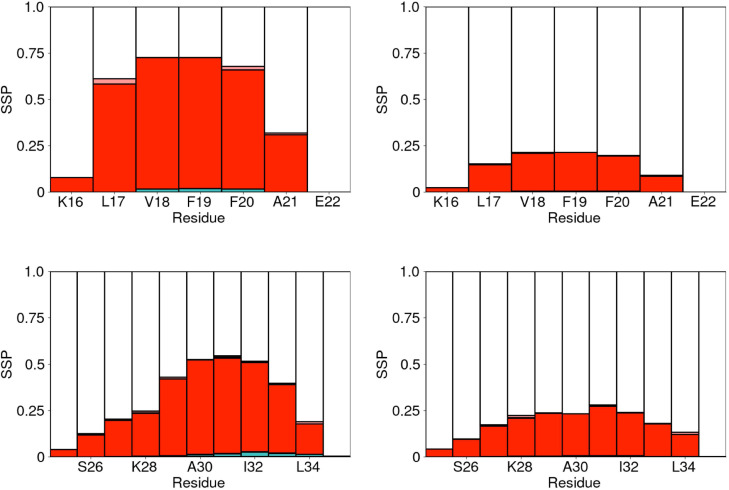
The secondary structure propensities for the A(16–22) and A(25–35) fragments are shown in Fig. 7. Similar to the A(10–40) peptide adsorption at the AWI changes the secondary structure propensity. For both these smaller fragments, this is primarily an increase in the proportion of turn residues, caused by an increase in the probability of backbone hydrogen bonding at the AWI. In the A(16–22) the probabilities of the F20-V18 and A21-L17 hydrogen bonds are significantly higher than in the solution. For the A(25–35) fragment, there is an increase in the probability of L34-I32 hydrogen bonds, increasing the propensity for turn in the second half of the peptide.
FIG. 7.
Secondary structure propensity for each residue (averaged over last 200 ns of simulations) at the AWI (left) and in the bulk solution (right). Top and bottom show A(16–22) and A(25–35), respectively. Colors as in Fig. 1.
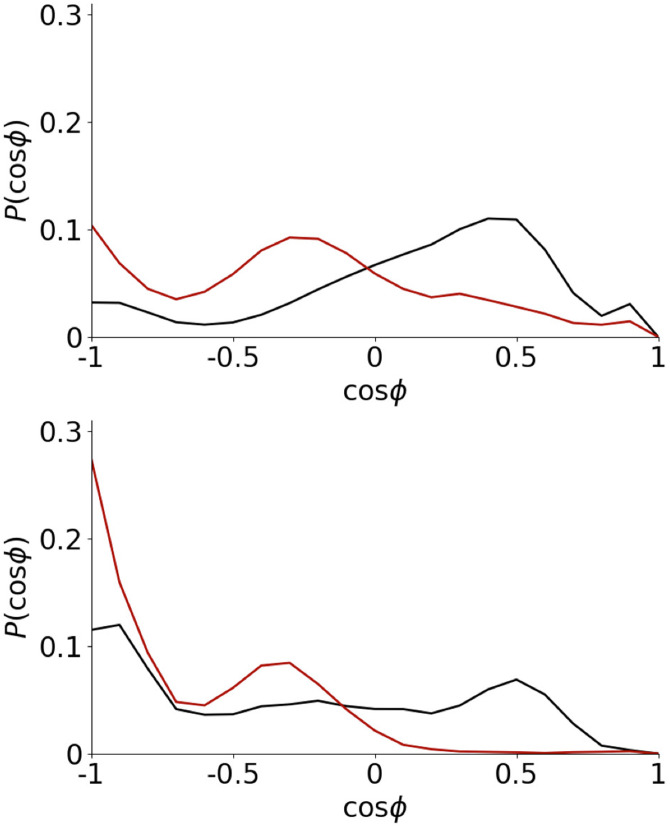
Notably, for both these fragments, the secondary structures are different than in the larger A(10–40) system [Fig. 1(b)]. Partially, this can be attributed to these fragments being too short to sustain helices or strands. For the A(16–22) fragment, the most significant structural feature is often considered to be the F19-F20 diphenylalanine motif. Containing two hydrophobic side chains, the conformation of this significantly affected by the AWI. The probability distribution of the angle between these two side chains is shown in Fig. 8. Compared to the bulk solution at the AWI, this distribution is shifted toward states, similar to previous studies of A(16–22) on gold surfaces25 and the diphenylalanine molecule at the water–cyclohexane interface.48 This allows both these side chains to partition into the air, which further stabilizes turn conformations. For the larger A(10–40) fragment, tendency for conformations at the AWI is weaker as the adoption of -states leads to more unfavorable interactions for the rest of the molecule.
FIG. 8.
Histogram of F19–F20 orientation for A(16–22) (top) and A(10–40) (bottom). AWI and solution data shown in black and red, respectively.
There is a smaller difference in the secondary structure propensity for the A(25–35) region in the small and large fragments. The first half of this region (G25-G29) is mostly turn (AWI) or random coil (solution) in both cases. Formation of turn, rather than -helix or -strand, is due to the lose of interactions that stabilize these structures that are found in the A(10–40) system.
Despite the differences in the secondary structure, the tertiary structures of these fragments are similar to the equivalent regions in Table IV. For both fragments, there is a slight decrease in and , particularly in the bulk solution. The tendency of the AWI to induce more structured conformations may be reducing the differences in the tertiary structure between the smaller and larger fragments. Consistent with the loss of helical structures, and are both lower for A(16–22) and A(25–35) than for the equivalent regions in A(10–40).
TABLE IV.
Comparison between structures of Aβ(16–22) and Aβ(25–35) fragments and equivalent regions in Aβ(10–40).
| Aβ(16–22) | AWI (frag) | AWI (full) | Solution (frag) | Solution (full) |
|---|---|---|---|---|
| Rg/Å | 5.7 ± 0.4 | 6.1 ± 0.7 | 6.6 ± 0.6 | 7.5 ± 0.4 |
| Gmax/Å | 4.4 ± 0.5 | 4.9 ± 1.1 | 5.6 ± 0.9 | 7.0 ± 0.6 |
| Gmid/Å | 3.2 ± 0.3 | 3.2 ± 0.3 | 3.0 ± 0.4 | 2.5 ± 0.3 |
| Gmin/Å | 2.2 ± 0.3 | 2.1 ± 0.4 | 2.1 ± 0.3 | 1.9 ± 0.2 |
| NCα | 17 ± 2 | 16 ± 3 | 14 ± 1.5 | 12.4 ± 0.4 |
| NCγ | 4.6 ± 0.7 | 3.8 ± 0.6 | 4.0 ± 0.7 | 3.2 ± 0.7 |
| Nα−HB | 0.2 ± 0.3 | 1.0 ± 1.2 | 0.0 ± 0.1 | 0 ± 0 |
| N3−10 | 0.5 ± 0.4 | 0.8 ± 0.9 | 0.2 ± 0.2 | 0.05 ± 0.03 |
| DH | 6.8 ± 0.9 | 6.1 ± 2.4 | 8.2 ± 1.0 | 9.4 ± 0.4 |
| Aβ(25–35) | AWI (frag) | AWI (full) | Solution (frag) | Solution (full) |
| Rg/Å | 7.4 ± 1.1 | 7.4 ± 1.3 | 8.1 ± 1.2 | 8.6 ± 0.8 |
| Gmax/Å | 6.3 ± 1.3 | 6.3 ± 1.4 | 7.2 ± 1.5 | 7.3 ± 1.2 |
| Gmid/Å | 3.5 ± 0.5 | 3.2 ± 0.5 | 3.4 ± 0.5 | 3.8 ± 0.8 |
| Gmin/Å | 2.3 ± 0.3 | 2.3 ± 0.3 | 2.2 ± 0.3 | 2.2 ± 0.2 |
| NCα | 31 ± 5 | 32 ± 5 | 28 ± 4 | 26 ± 6 |
| NCγ | 4.5 ± 1.1 | 4.3 ± 1.3 | 3.7 ± 1.0 | 3.1 ± 0.6 |
| Nα−HB | 0.2 ± 0.5 | 1.1 ± 1.2 | 0.1 ± 0.1 | 0.05 ± 0.05 |
| N3−10 | 0.6 ± 0.5 | 1.1 ± 0.9 | 0.3 ± 0.3 | 0.3 ± 0.3 |
| DH | 12.2 ± 1.7 | 11.4 ± 2.3 | 13.5 ± 1.3 | 14.0 ± 1.0 |
IV. CONCLUSIONS
Protein aggregation has long been recognized as being enhanced at liquid (e.g., air–water, oil–water) interfaces. One driving force for this is the interface templating the formation of aggregation-prone conformations. This is particularly true for intrinsically disordered proteins, which typically lack a well-defined structure in the bulk solution. Using molecular dynamics simulation, we found that the model fibril forming protein amyloid beta can adopt -helical conformations at the AWI; this formation of ordered conformations at the AWI is consistent with other IDPs and contrary to the loss of structure often seen for globular proteins.49
The formation of helical structures at hydrophobic interfaces has been observed for a number of intrinsically disordered proteins,20,46 suggesting that this is a common feature. Indeed, experimental investigations of A8,45 have identified -helical intermediates as a key step in its interfacial aggregation. As these helices are commonly amphipathic, the exposed hydrophobic faces can make these more prone to aggregation. Notably, only one of the two helices formed at the AWI is amphipathic (V12-D23) with the other consisting of solely hydrophobic amino acids.
As an intrinsically disordered protein, A exhibits a number of distinct conformations, both at the AWI and in the bulk solution. The number of conformations is significantly reduced at the AWI compared to the bulk solution due to the partitioning of hydrophobic side chains into the air. There is also little overlap between the sets of conformations in these two environments. This suggests that A exhibits induced fit-like50 behavior at hydrophobic interfaces in common with other IDPs.
Comparison between the smaller [A(16–22) and A(25–35)] and larger [A(10–40)] fragments illustrates the influence of the larger protein structure conformational behavior. Both the smaller fragments show an increase in the propensity for the ordered secondary structure, in common with the larger fragment, but for both the smaller fragments, this is predominately turn as they are too short to form stable helical or extended structures at least as monomers. In the case of A(16–22) fragment, the difference in the secondary structure is further driven by the increased adoption of cis-conformations of the F19-F20 diphenylalanine motif at the AWI.
While the AWI provides a simple model of a hydrophobic/hydrophilic interface, we would expect amyloid beta, and other amyloidogenic proteins, to exhibit similar behavior at other more complex interfaces. Within biological systems, proteins can encounter a variety interfaces, most notably the cell membrane. These can often act to induce protein conformational change and aggregation, which is implicated in cell damage caused by amyloidogenic proteins. Knowledge of the conformation of amyloid beta at interfaces can then be used to give insight into fibril formation on other biological environments. Surfaces and interfaces are also commonly used in the preparation of protein structures, such as fibrils, for the use in materials’ science and biotechnological applications, where the enhancement of fibrillation is advantageous.
ACKNOWLEDGMENTS
Computational facilities for this work were provided by the SFI/HEA funded Irish Centre for high end computing. S.S. was supported by a postgraduate research scholarship from the College of Science, NUI Galway.
APPENDIX: SIMULATION SAMPLING AND CONVERGENCE
Motion of trajectories between replicas can be monitored through the variation of the REST scaling parameter () for different replicas (Fig. 9) for A(10–40). As can be seen, the replicas explore different values of . The acceptance rates for the simulations are shown in Table V. In all cases, the acceptance rates are above 20 % for all simulations and all pairs of replicas.
To see whether the conformational ensemble has been well sampled, the number of unique conformations found (using the cluster analysis) against simulation for A(10–40) is shown in Fig. 10. As can be seen, the number of clusters within of most common cluster has plateaued within 200 ns for the AWI simulation and 300 ns for the bulk solution, suggesting adequate sampling of the conformational ensemble.
DATA AVAILABILITY
The data that support the findings of this study are available from the corresponding author upon reasonable request.
Note: This paper is part of the Biointerphases Special Topic Collection on Molecular Scale Modeling of Biological Molecules at Interfaces.
REFERENCES
- 1.Chiti F. and Dobson C. M., Annu. Rev. Biochem. 75, 333 (2006). 10.1146/annurev.biochem.75.101304.123901 [DOI] [PubMed] [Google Scholar]
- 2.Iadanza M. G., Jackson M. P., Hewitt E. W., Ranson N. A., and Radford S. E., Nat. Rev. Mol. Cell Biol. 19, 755 (2018). 10.1038/s41580-018-0060-8 [DOI] [PMC free article] [PubMed] [Google Scholar]
- 3.Benson M. D., Buxbaum J. N., Eisenberg D. S., Merlini G., Saraiva M. J. M., Sekijima Y., Sipe J. D., and Westermark P., Amyloid 25, 215 (2018). 10.1080/13506129.2018.1549825 [DOI] [PubMed] [Google Scholar]
- 4.Knowles T. P. J. and Mezzenga R., Adv. Mater. 28, 6546 (2016). 10.1002/adma.201505961 [DOI] [PubMed] [Google Scholar]
- 5.Li C., Qin R., Liu R., Miao S., and Yang P., Biomater. Sci. 6, 462 (2018). 10.1039/C7BM01124E [DOI] [PubMed] [Google Scholar]
- 6.Schladitz C., Vieira E. P., Hermel H., and Möhwald H., Biophys. J. 77, 3305 (1999). 10.1016/S0006-3495(99)77161-4 [DOI] [PMC free article] [PubMed] [Google Scholar]
- 7.Morinaga A., Hasegawa K., Nomura R., Ookoshi T., Ozawa D., Goto Y., Yamada M., and Naiki H., Biochim. Biophys. Acta Proteins Proteomics 1804, 986 (2010). 10.1016/j.bbapap.2010.01.012 [DOI] [PubMed] [Google Scholar]
- 8.Hoernke M., Falenski J. A., Schwieger C., Koksch B., and Brezesinski G., Langmuir 27, 14218 (2011). 10.1021/la203016z [DOI] [PubMed] [Google Scholar]
- 9.Campioni S., Carret G., Jordens S., Nicoud L., Mezzenga R., and Riek R., J. Am. Chem. Soc. 136, 2866 (2013). 10.1021/ja412105t [DOI] [PubMed] [Google Scholar]
- 10.Jean L., Lee C. F., Lee C., Shaw M., and Vaux D. J., FASEB J. 24, 309 (2010). 10.1096/fj.09-137653 [DOI] [PubMed] [Google Scholar]
- 11.Jean L., Lee C. F., and Vaux D. J., Biophys. J. 102, 1154 (2012). 10.1016/j.bpj.2012.01.041 [DOI] [PMC free article] [PubMed] [Google Scholar]
- 12.Last N. B., Rhoades E., and Miranker A. D., Proc. Natl. Acad. Sci. U.S.A. 108, 9460 (2011). 10.1073/pnas.1102356108 [DOI] [PMC free article] [PubMed] [Google Scholar]
- 13.Hosseinpour S., Roeters S. J., Bonn M., Peukert W., Woutersen S., and Weidner T., Chem. Rev. 120, 3420 (2020). 10.1021/acs.chemrev.9b00410 [DOI] [PubMed] [Google Scholar]
- 14.Husband F. A., Garrood M. J., Mackie A. R., Burnett G. R., and Wilde P. J., J. Agric. Food Chem. 49, 859 (2001). 10.1021/jf000688z [DOI] [PubMed] [Google Scholar]
- 15.Miles A. J. and Wallace B. A., Chem. Soc. Rev. 35, 39 (2006). 10.1039/B316168B [DOI] [PubMed] [Google Scholar]
- 16.Earl D. J. and Deem M. W., Phys. Chem. Chem. Phys. 7, 3910 (2005). 10.1039/b509983h [DOI] [PubMed] [Google Scholar]
- 17.Laio A. and Gervasio F. L., Rep. Prog. Phys. 71, 126601 (2008). 10.1088/0034-4885/71/12/126601 [DOI] [Google Scholar]
- 18.Cheung D. L., Langmuir 32, 4405 (2016). 10.1021/acs.langmuir.5b04619 [DOI] [PubMed] [Google Scholar]
- 19.Cheung D. L., J. Chem. Phys. 147, 195101 (2017). 10.1063/1.4994561 [DOI] [PubMed] [Google Scholar]
- 20.Cheung D. L., J. Chem. Phys. 151, 064706 (2019). 10.1063/1.5100253 [DOI] [Google Scholar]
- 21.Deighan M. and Pfaendtner J., Langmuir 29, 7999 (2013). 10.1021/la4010664 [DOI] [PubMed] [Google Scholar]
- 22.Cheung D. L., Biointerphases 15, 051001 (2020). 10.1116/6.0000417 [DOI] [PubMed] [Google Scholar]
- 23.Paravastu A. K., Leapman R. D., Yau W.-M., and Tycko R., Proc. Natl. Acad. Sci. U.S.A. 105, 18349 (2008). 10.1073/pnas.0806270105 [DOI] [PMC free article] [PubMed] [Google Scholar]
- 24.Millucci L., Ghezzi L., Bernardini G., and Santucci A., Curr. Protein Pept. Sci. 11, 54 (2010). 10.2174/138920310790274626 [DOI] [PubMed] [Google Scholar]
- 25.Bellucci L., Ardèvol A., Parrinello M., Lutz H., Lu H., Weidner T., and Corni S., Nanoscale 8, 8737 (2016). 10.1039/C6NR01539E [DOI] [PubMed] [Google Scholar]
- 26.Bellucci L., Bussi G., Di Felice R., and Corni S., Nanoscale 9, 2279 (2017). 10.1039/C6NR06010B [DOI] [PubMed] [Google Scholar]
- 27.Crescenzi O., Tomaselli S., Guerrini R., Salvadori S., D’Ursi A. M., Temussi P. A., and Picone D., Eur. J. Biochem. 269, 5642 (2002). 10.1046/j.1432-1033.2002.03271.x [DOI] [PubMed] [Google Scholar]
- 28.D’Ursi A. M., Armenante M. R., Guerrini R., Salvadori S., Sorrentino G., and Picone D., J. Med. Chem. 47, 4231 (2004). 10.1021/jm040773o [DOI] [PubMed] [Google Scholar]
- 29.Liu P., Kim B., Friesner R. A., and Berne B. J., Proc. Natl. Acad. Sci. U.S.A. 102, 13749 (2005). 10.1073/pnas.0506346102 [DOI] [PMC free article] [PubMed] [Google Scholar]
- 30.Wang L., Friesner R. A., and Berne B. J., J. Phys. Chem. B 115, 9431 (2011). 10.1021/jp204407d [DOI] [PMC free article] [PubMed] [Google Scholar]
- 31.Sugita Y. and Okamoto Y., Chem. Phys. Lett. 314, 141 (1999). 10.1016/S0009-2614(99)01123-9 [DOI] [Google Scholar]
- 32.Smith A. K., Lockhart C., and Klimov D. K., J. Chem. Theory Comput. 12, 5201 (2016). 10.1021/acs.jctc.6b00660 [DOI] [PubMed] [Google Scholar]
- 33.Bussi G., Donadio D., and Parrinello M., J. Chem. Phys. 126, 014101 (2007). 10.1063/1.2408420 [DOI] [PubMed] [Google Scholar]
- 34.Parrinello M. and Rahman A., J. Appl. Phys. 52, 7182 (1981). 10.1063/1.328693 [DOI] [Google Scholar]
- 35.Essmann U., Perera L., Berkowitz M. L., Darden T., Lee H., and Pedersen L. G., J. Chem. Phys. 103, 8577 (1995). 10.1063/1.470117 [DOI] [Google Scholar]
- 36.Hess B., Bekker H., Berendsen H. J. C., and M. Fraaije J. G. E., J. Comput. Chem. 18, 1463 (1997). [DOI] [Google Scholar]
- 37.Van Der Spoel D., Lindahl E., Hess B., Groenhof G., Mark A. E., and Berendsen H. J. C., J. Comput. Chem. 26, 1701 (2005). 10.1002/jcc.20291 [DOI] [PubMed] [Google Scholar]
- 38.Hess B., Kutzner C., van der Spoel D., and Lindahl E., J. Chem. Theory Comput. 4, 435 (2008). 10.1021/ct700301q [DOI] [PubMed] [Google Scholar]
- 39.Abraham M. J., Murtola T., Schulz R., Páll S., Smith J. C., Hess B., and Lindahl E., SoftwareX 1–2, 19 (2015). 10.1016/j.softx.2015.06.001 [DOI] [Google Scholar]
- 40.Tribello G. A., Bonomi M., Branduardi D., Camilloni C., and Bussi G., Comput. Phys. Commun. 185, 604 (2014). 10.1016/j.cpc.2013.09.018 [DOI] [Google Scholar]
- 41.Daura X., Gademann K., Jaun B., Seebach D., Van Gunsteren W. F., and Mark A. E., Angew. Chem. Int. Ed. 38, 236 (1999). [DOI] [Google Scholar]
- 42.Michaud-Agrawal N., Denning E. J., Woolf T. B., and Beckstein O., J. Comput. Chem. 32, 2319 (2011). 10.1002/jcc.21787 [DOI] [PMC free article] [PubMed] [Google Scholar]
- 43.Humphrey W., Dalke A., and Schulten K., J. Mol. Graph. 14, 33 (1996). 10.1016/0263-7855(96)00018-5 [DOI] [PubMed] [Google Scholar]
- 44.Heinig M. and Frishman D., Nucleic Acids Res. 32, 500 (2004). 10.1093/nar/gkh429 [DOI] [PMC free article] [PubMed] [Google Scholar]
- 45.Jiang D., Dinh K. L., Ruthenburg T. C., Zhang Y., Su L., Land D. P., and Zhou F., J. Phys. Chem. B 113, 3160 (2009). 10.1021/jp8085792 [DOI] [PMC free article] [PubMed] [Google Scholar]
- 46.De Simone A., Kitchen C., Kwan A. H., Sunde M., Dobson C. M., and Frenkel D., Proc. Natl. Acad. Sci. U.S.A. 109, 6951 (2012). 10.1073/pnas.1118048109 [DOI] [PMC free article] [PubMed] [Google Scholar]
- 47.Dalgicdir C., Globisch C., Peter C., and Sayar M., PLoS Comput. Biol. 11, e1004328 (2015). 10.1371/journal.pcbi.1004328 [DOI] [PMC free article] [PubMed] [Google Scholar]
- 48.Dalgicdir C., Sensoy O., Peter C., and Sayar M., J. Chem. Phys. 139, 234115 (2013). 10.1063/1.4848675 [DOI] [PubMed] [Google Scholar]
- 49.Stefani M., Int. J. Mol. Sci. 9, 2515 (2008). 10.3390/ijms9122515 [DOI] [PMC free article] [PubMed] [Google Scholar]
- 50.Koshland D. E., Proc. Natl. Acad. Sci. U.S.A. 44, 98 (1958). 10.1073/pnas.44.2.98 [DOI] [PMC free article] [PubMed] [Google Scholar]
Associated Data
This section collects any data citations, data availability statements, or supplementary materials included in this article.
Data Availability Statement
The data that support the findings of this study are available from the corresponding author upon reasonable request.


